E
STIMATING
E
ULER
E
QUATIONS
Orazio Attanasio
Hamish Low
Estimating Euler Equations
♣♣♣♣Orazio P. Attanasio
*and Hamish Low
**March 17, 2002
♣ We would like to thank Sule Alan, Martin Browning, Chris Carroll, Tom MaCurdy, Costas Meghir, Luigi Pistaferri,
Guglielmo Weber and seminar participants at Chicago and Stanford for useful discussions.
Executive Summary
In this paper we consider conditions under which the estimation of a log-linearized Euler equation for consumption yields consistent estimates of preference parameters. When utility is isoelastic and a sample covering a long time period is available, consistent estimates are obtained from the log-linearized Euler equation when the innovations to the conditional variance of consumption growth are uncorrelated with the instruments typically used in estimation.
We perform a Montecarlo experiment, consisting in solving and simulating a simple life cycle model under uncertainty, and show that in most situations, the estimates obtained from the log-linearized equation are not systematically biased. This is true even when we introduce heteroscedasticity in the process generating income.
The only exception is when discount rates are very high (e.g. 47% per year). This problem arises because consumers are nearly always close to the maximum borrowing limit: the estimation bias is unrelated to the linearization and estimates using nonlinear GMM are as bad. Across all our situations, estimation using a log-linearized Euler equation does better than nonlinear GMM despite the absence of measurement error.
1.
Introduction
Much of the empirical literature on consumption has used extensively Euler equations derived from the inter-temporal optimization problem of a generic consumer to estimate structural parameters and test the restrictions implied by the model. Since Hall’s (1978) contribution, the Euler equation approach has been applied to both micro and macro data sets to fit a variety of different preference specifications in a variety of different contexts. The main attraction of this approach lies in the fact that it avoids solving explicitly the optimization problem faced by a generic consumer and focuses instead on a specific first order condition implied by that problem. In other words, the Euler equation, by differencing out the fixed effect constituted by the marginal utility of wealth, allows one to avoid its parameterization, while at the same time allowing the estimation of preference parameters. The estimation of these equations, however, is not without problems. Some of these problems have been widely discussed in the literature. Others are less well known.
In this paper, we discuss the conditions under which structural preference parameters can be identified using an Euler equation. Our starting point is that to estimate consistently preference parameters and test over-identifying restrictions, aggregation issues require the use of micro data. Moreover, if one does not want to use a representative agent/ complete markets framework, it is crucial to use ‘large-T’ asymptotics. Given these considerations, we then stress the importance of obtaining an equation that is linear in the parameters and with additive residuals. This points to the usefulness of log-linear approximations of Euler equations. Therefore, we discuss the circumstances in which the use of log-linearized Euler equations does yield consistent estimates of the structural parameters of the model.
estimates of a log-linearized Euler equation. As we discuss below, the results we obtain indicate no systematic biases arising from estimating structural preference parameters with a log-linearized Euler equation. In particular, we notice that the presence of precautionary behaviour does not seem to introduce any bias in the estimation of preference parameters.
Recently, the appropriateness of using a log-linearized Euler equation has received increased attention. Ludvigson and Paxson (2001) have considered the approximation error of the consumption function obtained by using a loglinearized Euler equation in a numerical method. Moreover, they consider the biases in estimates of prudence derived from a log-linearized Euler equation and have shown that it can be considerable. However, they estimate prudence from the coefficient on the variance of consumption growth under the assumption of isoelastic utility. This assumption implies prudence is tied to the intertemporal elasticity, and yet there is no interest rate variation in their model to identify this elasticity, and no convincing instruments for the variance of consumption growth. The emphasis of this paper is different: we want to establish to what extent a log-linearized Euler equation can be used to estimate structural preference parameters, in particular to estimate intertemporal elasticities using interest rate variation.
Carroll (2001), in a colorfully titled paper, has argued that estimates of structural parameters based on log-linearized Euler equations yield seriously biased parameters. The conclusions we reach in this paper are quite different. We show that, for sensible parameter specifications, if the sample is long enough, one obtains estimates of the preference parameters from log-linearized Euler equations that do not present large systematic biases. This result also holds even when we introduce heteroscedasticity in the process generating household income. The main difference between our approach and Carroll’s is in his focus on cross section rather than time series variability. The only case in which we find that the log-linearized Euler equation yields consistently biased estimates is when the discount rate is exceedingly and implausibly high. However, the problem in such a situation does not lie in the loglinear approximation but in the fact that many consumers are very close to consuming all their cash-in-hand most of the time. We also show that, for all parameter specifications, the performance of the non-linear GMM estimator is considerably worse than that of the estimators based on the log-linearized equations.
equation. However, the life cycle dynamics of such a variable has not been studied before. We use our numerical solution method and quadrature formulae to compute the conditional variance of consumption growth and study its behaviour over the life cycle. We show that, for most parameter values, the life cycle profiles are remarkably flat, making the Gourinchas and Parker’s claim unwarranted. Moreover, we show that the introduction of such a term in the log-linearized Euler equation does not make much difference to the estimates of the elasticity of intertemporal substitution, contradicting Carroll’s claim.
As a by-product of our exercise, we also obtain a number of other results. For example, an increase in the variability of the interest rate (one of the two sources of variability in our model) does not necessarily decrease the precision of our estimates of the elasticity of intertemporal substitution and often increases it. The reason is quite intuitive: such an increase induces more variation in intertemporal prices and this allows more precise estimates of intertemporal preferences. We also show that, as to be expected, the precision of our estimates decreases with the variability of wages (the second source of randomness in our model) and increases with T. Therefore, how large T should be to get reasonably precise estimates is a function of the variability of wages and of the interest rate. Calibrating wage variance is a very challenging task. In our Montecarlo exercise, we calibrate it so that the simulated consumption growth mimics the variance of observed cohort data.
In the results we show below, the estimates of the elasticity of intertemporal substitution do not present strong systematic biases but are, for the sample size we consider, not extremely precise. It should be stressed, however, that this is not a problem with the log-linearization. Moreover, and more importantly, the exercise we perform is not designed to mimic the precision of the estimator we study in real circumstances. We show that the precision of the estimates depends crucially on the degree of persistence of interest rates and (presumably) labour income. In our exercise we purposely limit the degree of persistence we consider to make the numerical solution simpler.
The rest of the paper is organized as follows. Section 2 outlines the problems associated with Euler equation estimation. Most of this material is well known, but this has not prevented many researchers from using estimators that are consistent only under very restrictive assumptions. It is therefore worthwhile emphasizing the conditions on data availability and on the nature of unobserved heterogeneity that guarantee consistency of various estimators.
present evidence on the life cycle pattern of the conditional variance of consumption growth. In Section 5, we present our Montecarlo evidence. Section 6 concludes.
2.
Euler equation estimation
Many studies of inter-temporal consumption use some version of the following equation:
(1) (1 ) 1
) , , ( ) , , ( 1 1 1 1 = + + + + + β t h t h t h t c h t h t h t c t R v z C U v z C U E
where subscripts index time and superscripts index individuals. Uc denotes the marginal utility of consumption which is assumed to depend on: C, (non-durable) consumption; z, a vector of observable variables; and v, some random variable meant to capture unobserved heterogeneity across individuals and/or measurement equation in consumption.1 R is the real ex-post interest rate on an asset for which the
individual consumer is not at a corner and β is the ‘pure’ discount factor. To estimate the structural parameters in equation (1) one needs to specify the functional form of the utility function, the variables that affect the marginal utility of non durable consumption and the interest rate whose variation one wants to use to estimate some of the parameters of interest.
The isoelastic specification U C z v( , , )= C exp( z v)
− +
−
1
1
γ
γ θ is often used as it gives rise to relatively tractable
specifications. In particular, computing the relevant quantities using such a specification, equation (1) above becomes:
(2) 1 exp( 1 1)(1 1) =1
+ ∆ + ∆ + + + − + θ β γ t h t h t h t h t
t z v R
C C E
Several considerations are in order if one is interested in estimating the parameters of equation (2).
(i) Equation (2) is not a consumption function, but an equilibrium condition. Such a condition can be used to derive orthogonality conditions that can be used to estimate the parameters of the utility function and test eventual over-identifying restrictions. The vector z can include endogenous variables, such as labour supply choices and durable consumption. This would be the case if we modeled preferences conditional on the optimal value of some other variables that we do not model explicitly. This is extremely useful in the
case of variables for which non-convexities and corners are important, such as durables, labour supply and so on.
(ii) An assumption that is usually made when bringing equation (2) to the data, is that of rational expectations. This means that the conditional expectation operator in (2) coincides with the mathematical expectation of the expression within the brackets and implies that deviations from the actual value of that expression and the left-hand side of (2) are, on average, zero and orthogonal to all information available to the consumer at time t. If we neglect, for the moment, the presence of the ‘taste-shock’ (or measurement error) vt , we can in principle use these orthogonality conditions to estimate the parameters of interest, as
long as the number of the latter is less or equal than the number of orthogonality conditions. It should be stressed, however, that the average is zero for each consumer over time. There is no reason to believe, without additional assumptions, that the cross section mean of these deviations is zero at any point in time. This point was first stressed by Chamberlain (1984) and has been discussed, among others, by Hayashi (1987), Altug and Miller (1990), Deaton (1992), Keane and Runkle (1994) and Attanasio (1999). Its most important implication is the fact that one can use purely cross sectional data to estimate Euler equations only under very special circumstances. In particular, as stressed by Altug and Miller (1990), one
needs the assumption of complete markets to guarantee that the expectational errors uth can be decomposed into the sum of an aggregate component ηt and a purely idiosyncratic one εth. In this case, the aggregate shock is absorbed by the constant of the equation or, if there is more than one time period, by time dummies.2 In the absence of complete markets, when the expectational errors of different
individuals are correlated but not identical, the introduction of time dummies does not solve the problem. This is because the consideration of each instrument would need the introduction of a new set of time dummies to capture the correlation of the instrument with the expectational errors: the model is effectively not identified. Therefore, to estimate an Euler equation in the absence of complete markets one needs a large T: in general, N-asymptotics does not work.
(iii) In the absence of heterogeneity, or under assumptions that guarantee the existence of a representative consumer, and in the absence of measurement error, one can estimate the discount factor and the coefficient of relative risk aversion using aggregate time series data. Hansen and Singleton (1982) were the first to use GMM to estimate a version of equation (2). However, because of the non-linear structure of equation (2), the presence of measurement error in consumption and/or unobserved heterogeneity can
2 Moreover, to identify the elasticity of intertemporal substitution, it is necessary to have cross-sectional variation in
have devastating effects on our ability to obtain consistent estimates of the parameters of interest. Moreover, while the asymptotics (large T) properties of the non-linear GMM estimator are clear, there is no much Montecarlo evidence on its performance in relatively small samples of life-cycle behaviour. (iv) There is now a substantial amount of evidence that aggregation issues are important for the estimation and evaluation of Euler equations. In particular, both non-linearities and the role played by certain demographic and labour supply variables can be crucial in explaining the results typically obtained with aggregate time series data. Furthermore, using individual data, one can focus on individuals or groups of individuals, who are more likely to satisfy the assumptions posed to obtain an empirically tractable specification.
An obvious implication of point (iv) above is that Euler equations can properly be estimated only using individual data.3 On the other hand, point (iii) above stresses the necessity of working with linear (in
parameters) models to be able to deal with the unavoidable measurement error present in individual level data4 and with some forms of unobserved heterogeneity. This implies that an equation such as (2) is of
limited use. A possibly appealing alternative, therefore, is to consider a log-linear version of (2). Following the steps in Hansen and Singleton (1983), for instance, from equation (2) one can derive the following:
(3) h t h t t h t t h t h
t k z R v u
C C 1 1 1 1
1 1( ln(1 ) )
ln + +θ∆ + + + + +∆ + + +
γ =
If the relevant variables are log-normal,
+ γ − + + γ + β = + + +
+ var (ln(1 )) 2 cov ln ,ln(1 )
ln var )
ln( 2 1 1 h1 t 1
t h t t t t h t h t t t R C C R C C k
where the t subscripts on the second moments indicates that these are conditional on the information available at t. When the conditional distribution of the relevant variables is not log-normal, the term kt will include higher conditional moments as well. As conditional second (and higher) moments are typically unobserved, it is useful to re-write equation (3) as follows:
3However, it should be stressed that one does not necessarily need panel data. A time series of cross sections, as long as the
model does not involve temporal non-separabilities, will be enough. One can form groups with constant membership over time and follow the relevant aggregates for these groups. As the asymptotics is on large T anyway, little is lost by going from the individual to the grouped data. It is crucial, however, that the relevant non-linear transformation of the data is computed.
(4) h t t
h t h
t h
t k z R e
C C
1 1
1
1 1( ln(1 ))
ln + +θ∆ + + + + + +
γ =
where the term k includes the log of the discount factor and the unconditional mean of the second (and higher) moments of consumption growth and real interest rates. The residual e includes expectational
errors u, unobserved heterogeneity v and the deviations of kt from k. Notice that, of the parameters in the
utility function, only γ and θ can be identified. Equation (4) is typically estimated by Instrumental Variables or GMM, using as instruments variables that are known at time t.
Obviously equations (3) and (4) are only approximations to equation (2). In the next section we discuss the
extent to which these approximations can be used to estimate the structural parameters γ and θ. Before that, however, it is worth mentioning two additional points. First, as we stressed above, to estimate Euler equations in the absence of complete markets, the availability of data covering a long time horizon is crucial. Unfortunately, long panel data containing information on consumption are almost non-existent. In the US and in the UK, only time series of cross sections are available.5 To estimate any dynamic model,
therefore, it is necessary to use synthetic panel techniques, such as those pioneered by Browning, Deaton and Irish (1985). However, to apply such techniques it is necessary to deal with relationships that are linear in parameters, such as equation (3), but not (1). The presence of multiplicative measurement error in consumption, only reinforces the desirability of dealing with an equation such as (4) as opposed to (2). Second, the fact that equation (4) is non-linear in variables (but linear in parameters) is a problem for aggregate time series data (as shown by Attanasio and Weber, 1993), but not for synthetic panel techniques, where one controls the aggregation process directly.
3.
How useful are log-linear Euler equations?
When studying intertemporal preferences, it is obviously desirable to allow for unobserved heterogeneity in preferences and measurement error in consumption. The discussion of the previous section implies, on the other hand, that it is important to be able to obtain a specification linear in parameters with additive errors. Such a specification should then be estimated on individual data covering a long time period.
As shown above, an approximate log-linear equation can be readily obtained.6 A relevant question,
therefore, is to ask to what extent such an approximation is a good one and, above all, to what extent its use introduces biases in the estimation of the structural parameters of interest. Once again, notice that the use of a log-linear approximation to the Euler equation has no implications for precautionary saving. The latter follows only from the nature of preferences.
It is relatively easy to state a condition under which the use of an IV technique yields consistent estimates of the parameters in equation (4). That is: the instruments one uses should be uncorrelated with the residuals of the equation. As mentioned above, these residuals are made up of three parts: (i) the
expectational error, (ii) the terms reflecting unobserved heterogeneity, ∆vth
+1, and (iii) the innovation to the conditional second (and possibly higher) moments of consumption growth and interest rates. The main goal of this paper is to study the effect of the third component.
Before delving into a discussion of the relevant problems, however, it is worth discussing briefly the issue of unobserved heterogeneity. The v term in equation (2) (and subsequent equations) could capture heterogeneity in discount factors and/or multiplicative measurement error in consumption. If one were to use panel data, provided a long enough panel existed, consistency of the estimator would depend on the stochastic properties of such a term. If one is willing to assume that such a term is a constant or a pure random walk, its presence would not jeopardize consistency. In the presence of persistent taste shocks, however, problems would arise if one used individual specific instruments. This would be the case, for instance, if different individuals were characterized by differences in discount factors. When dealing with grouped data, however, the issue is greatly simplified. The reason is, once again, that one relies on large T to obtain consistency.7 Therefore one can in principle control for heterogeneity between groups by
inserting group specific intercepts. This constitutes yet another strong argument (beside the availability of relatively long time series) for the use of grouped data, such as synthetic cohorts.
We now discuss the possible problems caused by the presence of the innovation to the second (and higher) moments of consumption growth and the interest rate in the residuals of equation (4) arising from
6 An alternative strategy is to start from a specification for the marginal utility of consumption that is (log) linear. From
such a specification, one derives exact log-linear Euler equations. The utility function (and the implications for precautionary saving) can be derived by integration of the estimated marginal utility. This strategy is followed by Attanasio and Browning (1995).
the log-linearization of equation (2). Going beyond the statement that to obtain consistency these innovations should be uncorrelated with the instruments used in estimation, however, is very hard, as these conditional moments are endogenously determined. Without a closed form solution for consumption specifying its relation to the interest rate and its other determinants, it is difficult to establish how the conditional variance of consumption growth should evolve. Even if one is willing to assume the absence of heteroscedasticity in the interest rate and in the other determinants of income (such as income innovations), one cannot rule out the possibility that consumption growth exhibits heteroscedasticity of a very persistent nature. If this were the case, the use of lagged instruments to estimate equation (4) would induce important biases in the estimation of the parameter of interest, such as the elasticity of intertemporal substitution.
To investigate this issue we perform a Montecarlo exercise. Given some assumptions on preferences and on the processes generating income and interest rates, we solve numerically for the optimal consumption of a generic individual. With the consumption function so obtained, we simulate consumption and interest rate paths for groups of individuals for a relatively large number of time periods. We then use the generated data to estimate versions of equation (4) both for an individual consumer and for different individuals grouped together. We repeat this exercise many times to establish the properties of the estimator of the log-linearized Euler equation.
Having created the data, we can also assess the performance of alternative estimators. In particular, we can assess the performance of the non-linear GMM which, by construction, is not affected by the approximation problem. Such an estimator therefore, constitutes an important benchmark. Moreover, evidence on the small sample properties of the non linear GMM in a life cycle framework is not, to the best of our knowledge, available. The details of the exercise are described in the next section.
4.
A Simple Life-Cycle Model and its Simulation
obtained under a variety of scenarios, in terms of preferences and stochastic environments faced by the individual consumers and information available to the econometrician. We are considering the case where the econometrician has a single observation per time period, and the results we report show the accuracy of estimation using such a time series of observations. Given the considerations discussed above, we will not investigate the results one would obtain estimating the Euler equation from a single (or a few) cross-sections.
4.1. The life-cycle problem and its numerical solution
We begin by outlining the optimization problem of a generic consumer and describing the method used to obtain consumption functions. As mentioned above, we assume expected utility maximization. In addition, we assume that utility is a function of a homogeneous consumption good, it is inter-temporally separable and is homothetic. In empirical estimation researchers have typically used non-durable consumption, and so we are implicitly assuming separability between this component of consumption and durables, leisure and so on. We are also neglecting the role that demographic variables play in the intertemporal allocation of resources. Therefore, the problem of individual consumer h can be written as:
(5) h j t h j t h j t h j t h j t t S j j h j t t C Y A R A t s C E Max + + + + + + − = γ − + − + + = β γ −
∑
) 1 ( . . 1 ) ( 1 0 1where C denotes, consumption, A assets, Y labour income and R the rate of interest. The length of life S is assumed to be certain. All variables are in real terms. The discount factor b is assumed to be between zero and unity and the coefficient of risk aversion g to be greater than zero. We assume that the consumer does not have a bequest motive and that she is born with no assets. These assumptions imply that A1=0 and
AS+1=0. To complete the description of the problem faced by consumer h, we need to specify the
processes that generate income and the interest rate. We consider the following income process:
(6) 1 h;
t h t h
t Y
Y = −ε
between aggregate and idiosyncratic shocks in the choice facing the individual because for each estimate we only observe one individual at a time. In both the grouped and ungrouped cases we need the realised shocks to be independent across simulations in order to identify the properties of the estimator. Furthermore, we assume that individuals can use only asset A to smooth consumption over time. That is, we rule out the presence of complete insurance markets that could be used to smooth out idiosyncratic shocks. We assume that individuals can borrow at most an amount that they will be able to repay with certainty. In this respect the assumption that income is bounded away from zero is crucial. If income could be zero with positive probability at each point in time, consumers never borrow. The maximum amount they borrow in our model is the present discounted value of the minimum income realization over the remainder of their life-time. This constraint will never bind exactly because the marginal utility of zero consumption is infinite and so consumers ensure strictly positive consumption in all remaining periods. However, when the discount factor is high relative to the current interest rate or when future income is expected to grow quickly, this constraint will be close to binding. In other words, the individual will consume very close to the maximum possible and this means that changes in consumption due to intertemporal substitution and variation in intertemporal prices will be dominated by changes in current income. The interest rate will still affect consumption because it affects the maximum that the individual can borrow. This variation, however, is not useful in identifying the elasticity of intertemporal substitution.
The interest rate is generated by an AR(1) process:
(7) h
t h t h
t r u
r = ρ −1 +
where r = log(1+R) and the innovations to the interest rate are assumed to be uncorrelated over time. We consider both the case in which innovations to the interest rate are idiosyncratic and the case in which innovations are common across subgroups. For simplicity, we assume that innovations are homoscedastic. Notice that to be able to estimate the elasticity of intertemporal substitution with a log-linear Euler equation, it is necessary to have an interest rate that varies over time and does so in a way that is at least partly predictable. The latter requirement is necessary if one wants to use instrumental variable techniques of the kind typically used in the empirical analysis of Euler equations. This assumption is not unrealistic.
The numerical solution to this problem is by now standard. Following Deaton (1991) the model is solved recursively from the terminal condition to give consumption in each period as a function of two state variables: the ratio of cash-in-hand to permanent income and the interest rate. A few points need to be noted. First, given the assumption about finite lives, the problem is inherently non-stationary. For this reason we have to derive S consumption functions. Second, an additional element of non-stationarity is introduced by the random walk assumption for income. For this reason, we re-parameterize the problem in (5) by dividing by permanent income. Third, even when income innovations are an i.i.d. process, we have two state variables as the current interest rate gives information about future interest rates. When we introduce heteroscedasticity (and persistence in the variance of income), we have an additional state variable.
The variable cash-in-hand is continuous, but the numerical solution is found explicitly only at a finite set of nodes in the state space. Values of the solution in between these nodes are found by local interpolation. The range of the grid for cash-in-hand is different at different points of the life cycle and is chosen such that no extrapolation is used. Further, the grid is most dense near to the lower bound and 200 points are used in the discretisation. In equation (7) the interest rate is a continuous variable, but in the numerical solution we assume that the interest rate takes one of 12 distinct values. Following Tauchen and Hussey (1991), we form a first-order Markov process, giving transition probabilities from rt-1 to rt, which mimics
the underlying continuous AR(1) process. A similar technique is used to describe the evolution of the variance of the shock to income. The underlying process is that
(8) h
t h
t w h
t
w =λσ +η
σ , ,−1
where σw is the variance of income and h is the shock to the variance. In the numerical solution, σw can
either be high or low and the probability of observing σw,t high is greater if σw,t-1 is high. Finally, in solving
The preference specification and the stochastic environment in which we put our consumers may sound very restrictive. In particular, it has been shown that to fit actual micro data it is necessary to allow preferences to depend on demographic and possibly labour supply variables. Furthermore, it is certainly unrealistic to assume the absence of aggregate shocks to wages as well as deterministic trends (and age effects) in earning profiles. However, the reason for these simplifications is that we want to focus on the performance of standard IV estimators.
The effect of introducing demographic variables would be equivalent to the introduction of a varying discount factor, and would therefore change the incentives consumers have to anticipate or postpone consumption for any interest rate. As we discuss the effect of different discount factors on our results, it is relatively straightforward to guess the results that one would obtain allowing for the effect of demographic variables. Analogously, one could guess the effect of deterministic earning trends by recognising that they will be relevant if they make it more likely that liquidity constraints become binding. In other words, the effect on our estimators of most complications that can be translated into a larger (or smaller) probability of liquidity constraints being binding, can be guessed by considering our results for different discount factors.8
4.2. Generating artificial data
In what follows, we solve and simulate the model with a set of parameter values that provide a baseline case and then experiment with changing some of these parameters. We pick the parameter values for the baseline case trying to be as ‘realistic’ as possible, within the stylized framework of our model. In this section we discuss our choices.
The two important preference parameters are the elasticity of intertemporal substitution and the discount factor. In the baseline, we fix the elasticity of intertemporal substitution at 0.67 (γ=1.5), consistent with a range of estimates presented by Attanasio and Weber (1993) and Blundell, Browning and Meghir (1994) and the discount rate at 0.005 per quarter, which corresponds to a period in our model.
The interest rate process was estimated from time series data for 3-months T-bill real returns in the UK over the period 1960-1996. The AR(1) model provides a reasonable representation of the time series process associated with the annual data, but it is less good for quarterly data. Using an AR(4) would add an additional 3 state variables and so is less practical. However, we would expect a higher order AR process to
yield better instruments for the interest rate and so improve the efficiency of the estimates. The process is calibrated to have an unconditional mean of 0.0037 (corresponding to 0.015 annual). We choose the persistence and the variance of the interest rate process in the baseline case so to match the unconditional variance of the quarterly returns and the predictability of the process (as measured by the R-squared of the AR(4)).
Calibrating the standard deviation of the innovation to the income process is more complicated. Even if one were to ignore the difficulty in distinguishing uncertainty from unobserved heterogeneity in the data, it is not obvious that wages or earnings are the right variable to use in such a calibration, as the income innovation represents all the uncertainty, besides that on interest rates, faced by consumers. The implications of different levels of uncertainty have to be interpreted with great caution. The approach we use is to calibrate the uncertainty in the income process so that the variability of the resulting consumption growth time series is matched to the available evidence. Even this criterion, however, is difficult to implement as very little exists on the time series variability of consumption growth. We use as a rough guide the estimates presented in Attanasio (1999) obtained from synthetic panels for the US and the UK. In the baseline, the standard deviation of the income process innovation is fixed at 0.02.
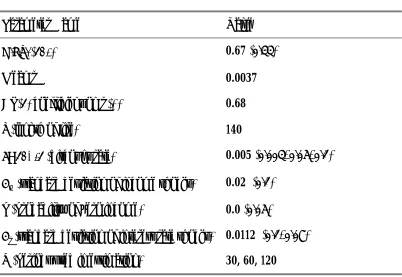
We report the parameter values used in the baseline specification and in some alternatives specifications in
Table 1. Baseline parameters are shown in bold, alternative parameters are given in brackets.
As we mentioned above, in addition to the baseline specification, we consider a variety of other specification in which we change taste and technology parameters to check how the properties of the estimators we consider depend on them. A parameter whose magnitude is likely to be crucial for our results is the variability of the income process. In addition to the baseline value, we try a much higher value, consistent with some recent estimates reported by Meghir and Pistaferri (2001). Notice that such a value implies a consumption growth series that is much more volatile than what we observe in reality. We also add a transitory shock that causes the process to be zero with probability 0.05. This type of process has been used by Carroll (1997, 2001) and generates a large role for precautionary saving behaviour.
As for the interest rate process, we present results with a ‘high variability’ situation, keeping, however, the level of persistence (and predictability) constant.
As for preference parameters, we experiment with different values of the elasticity of intertemporal substitution and with different values of the discount factor. Changing the value of the discount factor is particularly important because with higher values of δ, impatient consumers will borrow close to the maximum possible. It is in this case that it has been argued that precautionary saving behaviour becomes most relevant. Notice that in our baseline case, the discount rate is higher than the average interest rate. We experiment with a value of δ lower than the baseline and slightly lower than the mean interest rate (0.003) and two values where the discount rate is very high: if we take into account that our period is calibrated to be one quarter, the values of 0.05 and 0.1 in Table 1 correspond to 23% and 47% discount rates on an annual basis.
Table 1: Parameter Values
Parameter Name Value
E.I.S. (1/γ) 0.67 (0.33)
Mean r 0.0037
AR(1) coefficient on r (r) 0.68
S (length of life) 140
δ=1/β-1 (discount rate) 0.005 (0.003, 0.05, 0.1)
σw (standard deviation of income shocks) 0.02 (0.1)
p (probability of zero income) 0.0 (0.05)
σr (standard deviation of interest rate shocks) 0.0112 (0.1, 0.07)
T (periods used in estimation) 30, 60, 120
For each of our parameter specifications, we run 1,000 simulations of individual behaviour to generate consumption paths that differ ex-post, despite being generated by the same preferences and stochastic processes. We then use these simulated data to estimate the structural parameters using different techniques. In particular, we use non-linear GMM and two different estimators for the log-linear specification. The first is a standard IV regression of consumption growth on interest rates, as it has been estimated in the literature. The second is the ‘normalization-free’ GMM proposed by Hansen and Singleton (1991) and used recently by Attanasio, Banks and Tanner (2002). We estimate our models using three different values for T, the number of time series observations: 30, 60 and 120.
Before performing our Montecarlo experiment, we use the simulations to check the properties of our
numerical solution method. In particular, we check that E C
C R
t h
t
h t
+ −
+
+
= 1
1
1 1
γ
β
( ) . In the first three
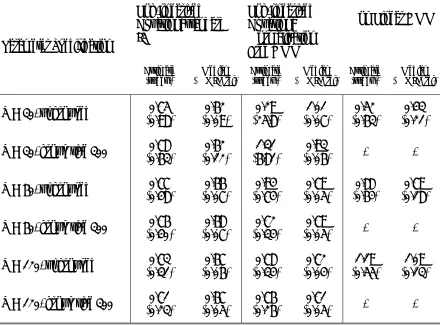
columns of Table 2, we report the average values for 1/β implied by the simulated values of the non-linear Euler equation with T=30, 60 and 120. The average is computed over time and across simulations. The standard errors reported in parentheses are computed across simulations. The first row refers to the baseline case, in which the true value is 1.005. In the following rows we change the variance of interest rate and income innovations. We then introduce heteroscedasticity in the innovations to income. Finally, we consider different assumptions about preferences. All results in Table 2 use individual data.
Notice that, with the exception of the case in which the discount factor is very high (5% or 10%), the discounted ratio of marginal utilities estimates the discount factor very well. This is not surprising at all, but constitutes an important check on the validity of the numerical algorithms that generate the time series used in estimation. Notice that an increase in T induces, as expected, a reduction in the standard error of the estimator. When the discount factor is very high, our estimate of the discount factor is poor: individuals consume close to the maximum and so consumption in any given period is very sensitive to shocks in that period, leading to a high variance in consumption growth. This makes it hard to identify parameters with much precision. This is shown in the behaviour of our simple estimator in the bottom
two rows. The underestimates of the point estimates of 1+δ when the true δ=0.05 or 0.1 suggests that the agents in our simulations are saving ‘too much’. However, this result is explained by the possibility of very low probability events stopping individuals from choosing to consume more. These low probability events are not observed sufficiently often in 1000 simulations: when we run the simulations for 1 million
Table 2: Checking the solution method
Parameter Specification E C
C R t h t h t + − + + 1 1 1 γ ( ) Standard deviation of
( )
h tC 1
log +
∆
T=30 T=60 T=120
Baseline σw = 0.02; σr= 0.011 1.0051
(0.008)
1.0050 (0.006)
1.0050
(0.004) 0.025
σr= 0.1 1.0057
(0.0035) (0.024)1.0051 (0.015)1.0049 0.088
σw = 0.1 1.0052
(0.024) (0.015)1.0051 (0.010)1.0048 0.071
σw = 0.02, p=0.05 1.0043
(0.018)
1.0047 (0.014)
1.0047
(0.009) 0.036
Heteroscedasticity in income Innovations: P(σwt = σwt-1) = 0.8
1.0049
(0.017) (0.012)1.0051 (0.009)1.0048 0.059
1/γγγγ= 0.33 1.0052
(0.012) (0.009)1.0050 (0.006)1.0050 0.021
δ = 0.003 1.0029
(0.008) (0.006)1.0030 (0.004)1.0030 0.024
δ = 0.05 1.025
(0.018) (0.011)1.025 (0.008)1.025 0.110
δ = 0.1 1.039
(0.020) (0.013)1.035 (0.009)1.035 0.150
4.3. The conditional variance of consumption growth
The key terms omitted by the approximation in equation (4) are the second and higher order moments of the log of the Euler equation. If consumption growth is lognormal, the omitted term is simply the deviation of the conditional variance of log consumption growth from the unconditional variance. Estimation using the approximation is likely to be problematic when these moments are correlated with the instruments. In simulating the paths of consumption, we can use our solution of consumption and
quadrature methods to calculate the exact omitted variable (
[
−γ∆ln +1+ t+1 +lnβ]
ht
t C r
E ) and in Table 6
below we include this term as an additional regressor to test for omitted variable bias. This is particularly interesting for the cases in which we encountered problems, such as with very high discounting. In this section, instead, we want to present some evidence on the life cycle patterns of the conditional variance. This is the main component of the omitted term, but as far as we know, its theoretical properties have not been investigated so far. Despite this, the term has recently received a considerable amount of attention and has been often appealed to in discussions of the estimation of Euler equations.9
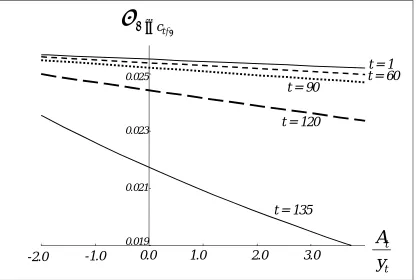
In Figure 1, we plot the standard deviation of consumption growth conditional on the asset/income ratio (at different ages) for our baseline parameter set. As is to be expected, the conditional standard deviation of consumption decreases with the ratio of cash-in-hand to income. However, at the beginning of the life cycle, the relationship is much flatter than in later periods. As individuals approach the end of their life, if they are in debt, their consumption will be strongly affected by the particular realisations of shocks, and this causes the conditional variance to increase at low levels of assets. By contrast, if individuals approach the end of their life with positive assets, they will be better able to smooth shocks, and this causes the conditional variance to decrease.
Figures use different scales as the magnitude of the conditional variance is very different in different environments. An increase in the variance between two periods early in life indicates that individuals have reduced their asset holdings (or started borrowing).
In Figure 2, the profile for the baseline case is mildly hump-shaped: the variance increases initially as individuals (who are impatient) borrow. As the loans are paid back, the conditional variance declines. The profile when individuals are very risk averse, but still impatient, is almost flat: assets are very low and do not change much over the life-cycle.
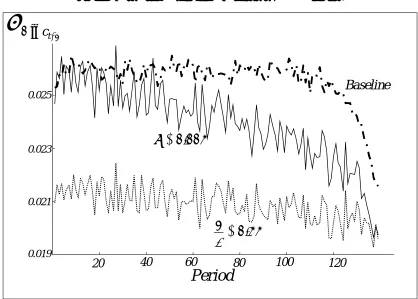
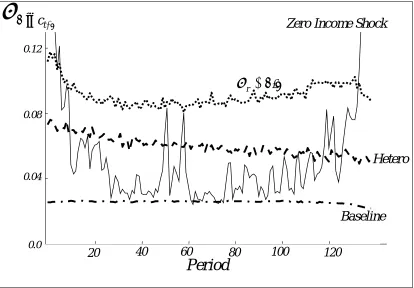
In Figure 3, we plot the conditional variance for different income and interest processes, in addition to the baseline profile. In particular, we report the case in which the income process is heteroskedastic, the case in which the interest rate process is more volatile than in the baseline case and the case in which income is not bounded away from zero. In all cases, the conditional variance of consumption growth is higher than in the baseline case, but does not exhibit strong life cycle patterns, with the possible exception of the ‘Carroll income process’, where it increases substantially in the last part of the life cycle.
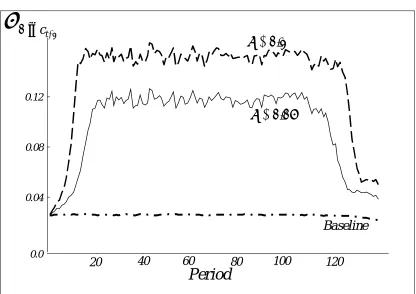
A striking feature of Figure 4 is the very strong hump shape of the variance of consumption growth when
the discount factor is very high (δ=0.05 or 0.1). In mid-life, individuals consume close to the maximum and are strongly affected by current income. This induces the high variance in consumption growth. This
also explains why estimates with larger T appear to give worse estimates for high values of δ: when T is large, individuals spend longer away from the terminal points and so they have more periods with high variability in consumption growth, worsening estimates. While this pattern is quite strong, it should be remembered that, to obtain it, we have to assume extreme values for the discount rate. Further, this pattern is not observed if we use the same discount factor but allow a positive probability of zero income. In that case, the profile for the variance of consumption growth is an inverse hump shape, as in the profile for the zero income shock in Figure 3.
We conclude this discussion by noticing that the variance of consumption growth is relatively flat over the life cycle for most sensible parameter configurations. It seems unlikely that large movements in the conditional variance of consumption could cause biases in the estimation of a log-linearized Euler equation. The fact that the conditional variance of consumption is substantially flat is also informative about the possible interpretation of the role of demographics in log-linearized Euler equation. In
9 Carroll refers to this term when discussing the supposed bad performance of the log-linearized Euler equation. Gourinchas
particular, the claim made by Gourinchas and Parker (2002) that these variables capture the effect of precautionary saving behaviour seems unwarranted.
5. Estimating log-linearized Euler equations
In our Montecarlo experiment, we estimate equations similar to (4) above for different combinations of parameters, starting with our baseline specification described above. In particular, we focus on the estimation of the elasticity of intertemporal substitution (EIS) 1/g, by estimating the following equation:
(9) h
t t h
t h
t k r e
C C
1 1
1 1
ln + + + +
γ + =
To estimate (9) we use both a standard IV method and a Normalization Free GMM (NF-GMM) proposed by Hansen and Singleton (1991). As instruments we use lagged interest rates, lagged income and lagged consumption growth. These are the instruments typically used in empirical analysis. It should be stressed, however, that the lack of persistence in innovations in income (and the limited persistence in interest rates) might make the model harder to estimate because of the scarcity of informative instruments.
In addition to the log-linearized Euler equation, we also use our Montecarlo simulations to evaluate the small sample performance of the non-linear GMM. It should be stressed that the environment we are considering is the best one could hope for such an estimator, as we are not introducing measurement error in consumption.
would have if the sample is renewed each period. Obviously, the second exercise is not possible when using the non-linear GMM.
Notice that when using the grouped estimator, we assume that interest rates are common across sub-groups (grouped data), but wage shocks are idiosyncratic. When using the ungrouped estimator, instead, the shocks can be thought of as either aggregate or idiosyncratic: we estimate the EIS from the time path for one individual so the nature of shocks across individuals does not matter for each estimate. To identify the distribution of the estimator, however, the simulated shocks need to be independent across simulations. Grouping averages out heterogeneity due to differences in realized wage rates and this reduces the standard errors dramatically. Neither the grouped nor the ungrouped cases correspond to the case in which we have a panel where shocks have an idiosyncratic and an aggregate component. Such a panel would imply multiple observations on consumption at each point in time: if such a panel existed and shocks had an idiosyncratic component, the performance of the estimators could be significantly improved. Even when using grouped data one could improve efficiency, relative to the results we report, by considering, as is normal practice in the literature, several groups (cohorts) at the same time.
5.1 The baseline experiment
In Table 3, we report results on the estimation of the elasticity of intertemporal substitution as well as the Sargan test of overidentifying restrictions for our baseline parameters using different methods of estimation and different sample sizes. As mentioned above, we use both individual and grouped data. In the table we report, for each of the experiments, the mean, median and standard errors of the estimates of 1/γ (whose ‘true’ value is 0.67) over 1,000 replications as well as the proportion of rejections obtained with the test of over-identifying restrictions. Under the null hypothesis, there would be a 5% rejection rate. The first point to make is that, not surprisingly, a large T is required to achieve unbiased estimates and low standard errors. As discussed in section 2, consistency depends on T asymptotics and hence we need a large T. The need for a large T is reflected in the large number of rejections of the Sargan test for the IV estimator when T=30. When we tried to estimate the model with T=20 (results available) we experienced severe biases in the mean and the median estimates for both the IV and NF-GMM estimator.
however, the standard error of the NF-GMM improves considerably, even though the bias of the median estimator does not change.10
Table 3: Baseline Estimates for Different T
Log-linearized Equation: standard IV
Log-linearized Equation: Normalization Free GMM
Non Linear GMM
Parameter Specification
Estimate
(st.dev.) (% OID rej)Median Estimate(st.dev.) (% OID rej)Median Estimate(st.dev.) (% OID rej)Median
T = 30, ungrouped 0.75
(0.98)
0.62 (0.09)
0.29 (25.8)
1.01 (0.07)
0.52 (0.63)
0.43 (0.21)
T = 30, group size 300 (0.63)0.78 (0.12)0.62 (6.81)1.31 (0.06)0.93 -
-T = 60, ungrouped (0.48)0.77 (0.07)0.66 (0.74)0.94 (0.05)0.79 (0.64)0.88 (0.18)0.79
T = 60, group size 300 0.76 (0.40)
0.68 (0.07)
0.72 (0.34)
0.79
(0.05) -
-T = 120, ungrouped (0.31)0.73 (0.06)0.67 (0.34)0.78 (0.04)0.72 (0.55)1.19 (0.13)1.09
T = 120, group size 300 (0.23)0.71 (0.05)0.67 (0.26)0.76 (0.05)0.71 -
-Note: For estimates, standard errors in parentheses. Baseline specification. True value = 0.67. The second column for each estimator reports the median estimate and, in parentheses, the percentage of rejections of the Sargan overidentifying restrictions at 5%.
Grouping turns out to be extremely useful as it reduces the variability of idiosyncratic wage shocks. In general, the performance of both estimators used in the log-linearized case improves when one reduces the variance of the income shocks.
Perhaps the most surprising feature of Table 3, is the relatively poor performance of the non-linear GMM. With T=120, the estimator performs worse than both the log-linear alternatives presented in the Table.
10 We chose to report the results in terms of the elasticity of intertemporal substitution, as the regression of consumption
growth on interest rates is what is usually reported in the literature. For the NF-GMM the results one gets are obviously independent of the normalization. The mean of the estimated γ, however, is closer to 1.5 than the mean of the estimated 1/γ
Moreover, the test of overidentifying restrictions rejects much more than the 5% one would expect. It should be stressed, once again, that the situation we are considering is a best case scenario for the non-linear GMM, as we are not considering the possibility of measurement error in consumption.11
In addition to equation (9), we also estimate two other specifications by IV. First, instead of considering a first order Taylor expansion to perform the log-linearization, we consider a second order expansion. It has been claimed that such a method might solve the possible problems that the omission of the second (and higher) moments of consumption growth and interest rates might create. A second-order expansion has been used, for instance, by Dynan (1993), albeit in a study using only 4 quarters of data. Second, we add to the log-linearized Euler equation the rate of growth of income. It has been argued (Carroll, 1997) that ‘excess sensitivity’ of consumption growth to income, might be reflecting the presence of ‘precautionary saving’. According to this line of reasoning, income growth would capture the missing variance term.12
The introduction of a second order term does not change the results dramatically and the average of the point estimates are still close to the true value of the elasticity of intertemporal substitution. However, the introduction of the squared consumption term increases the standard errors dramatically. This is likely to be a consequence of the difficulty in identifying good instruments for this term. Similarly, the introduction of expected wage growth does not change the results much. In this model, expected wage growth does not improve the performance of the estimator for low T and only increases the variability of the estimates for the case in which the estimation horizon is longer. This term does not seem to be correlated with the variance of consumption growth.
To conclude the discussion of the baseline case, this first set of simulations shows that the log-linearization of the Euler equation does not introduce large systematic biases in the estimation of the elasticity of inter-temporal substitution when T is sufficiently large. While the mean estimates tend to be slightly larger than the true value, the bias does not seem to be severe. The median for the IV estimates is very close to the true value, even though the median for NF-GMM is a bit above it. The estimates are quite volatile. However, some experiments, such as the one with grouped data and T=60, indicate that such a parameter can be estimated with reasonable precision. It should be stressed, however, that the main aim of the
11 It is interesting to note that the estimates of the discount rate obtained by non-linear GMM are remarkably good.
Obviously this parameter is not identified in the log-linear case.
12 In both cases we add to the list of instruments an additional variable to identify the additional coefficient: the square of
experiment we consider is to assess whether the log-linearization of the Euler equation introduces substantial biases, rather than to test the efficiency and precision of the estimates of the elasticity of intertemporal substitution. To address the latter question it would be necessary to simulate a more complex model that would incorporate the amount of persistence observed in real data: as we mention above, the introduction of more persistent wage growth and interest rate processes makes the numerical solution more complicated while, presumably, letting the IV estimators get more precise as more efficient instruments can be used.
5.2 Changing preference parameters
In Table 4, relative to the baseline specification, we change the two preference parameters. In particular, we consider a lower elasticity of intertemporal substitution (0.33) and three different discount rates, one that is lower than in the baseline (and lower than the interest rate) and two that are much higher than in the baseline. We report the results obtained with the grouped estimators and T=60 and 120 and reproduce the baseline results from Table 3 for these cases. The results with T=30 and ungrouped data are sufficiently predictable, given the results presented, to be excluded from the Table. They are available upon request.
When changing the true elasticity of intertemporal substitution (row 5) or when decreasing the discount rate to a value (0.003) slightly below the mean interest rate (row 2), the substance of the results does not change considerably. Both estimators present some upward biases at T=60, which are slightly larger for the NF-GMM. The IV estimates are also less variable. For T=120 both estimators perform reasonably well: there is no sign of systematic and large bias induced by the log-linearization procedure.
The results change substantially when δ is set to large values, as in rows 3 and 4, where it is set to 0.05 and 0.1 at the quarterly level. In both cases, the mean and median estimates are substantially higher than the true value of the E.I.S. Moreover, the estimates are very volatile. Individuals will consume close to the maximum possible and consumption will be strongly affected by current shocks. Changes to the interest rate impact on behaviour primarily through changing the maximum amount of feasible borrowing, and this
Table 4: Estimates for Different Preference Parameters (Grouped) Log-linearized Equation: standard IV Log-linearized Equation: Normalization Free GMM Parameter Specification T=60 Mean Estimate [median est.] (st.dev.)
T=120 Mean Estimate [median est.]
(st.dev.)
T=60 Mean Estimate [median est.] (st.dev.) T=120 Mean Estimate [median est.] (st.dev.)
Baseline (δ = 0.005, 1/γ = 0.67)
0.76 [0.68] (0.40) 0.71 [0.67] (0.23) 0.72 [0.79] (0.34) 0.76 [0.71] (0.26)
δ = 0.003
0.74 [0.68] (0.35) 0.71 [0.67] (0.21) 0.89 [0.78] (0.51) 0.75 [0.71] (0.24)
δ = 0.05
2.51 [2.24] (1.59) 2.36 [2.24] (0.89) 3.12 [2.68] (2.10) 2.55 [2.37] (0.98)
δ = 0.1
3.83 [3.45] (1.99) 3.61 [3.34] (1.28) 4.62 [3.97] (2.93) 3.85 [3.58] (1.43)
1/γ = 0.33
0.38 [0.34] (0.19) 0.35 [0.33] (0.11) 0.44 [0.39] (0.25) 0.38 [0.35] (0.12)
Note: For mean estimates, standard errors in parentheses. Group size 300. For rows 1-4, true value = 0.67. For row 5, true value = 0.33.
The direction of bias in estimates using high discount rates depends on the income process: if we use the same discount factor (0.1) but allow a positive probability of zero income, the estimate for T=120 is 0.25 (0.16). The bias is again caused by the sensitivity of consumption to current income, but in this case, the zero income shocks mean individuals never borrow. As we saw in the pictures of the conditional variance, if individuals are borrowing the conditional variance is increasing, potentially leading to upward bias in the estimates of the EIS; whereas if individuals are saving, the conditional variance is decreasing, potentially
leading to downward bias. This suggests that the poor performance may be due to approximation error, but as discussed further in section 5.3, the estimates using nonlinear GMM are as bad.
5.2 Changes in interest rates and wage processes
In Table 5, we study the effect of changing the variability of the wage and interest rate processes. As in Table 4, we report the results of using IV and NF-GMM on the log-linearized Euler equation with grouped data and T=60 and 120. In particular, we consider two alternative values for the variance of the
interest rate, σr, both larger than in the baseline case (0.07 and 0.1, against 0.011) and one alternative value
for the standard deviation of wages, σw, larger than in the baseline (0.1 rather than 0.02). Moreover, we
consider two additional changes to the income process. First, we consider the possibility that income equals zero with a certain probability (p=0.05): this process has been extensively used by Carroll to generate precautionary savings. Second, we consider the possibility that the variance of the income process changes over time following an AR(1) process. When changing the variance of the interest rate process, we also change the autocorrelation so to maintain its predictability unchanged.
Starting with the results for the interest rate, we observe that, while the average of the estimates does not change much with the variance of the interest rate, the estimates become more precise as the variance increases. This is because the estimator is able to exploit the larger variability in intertemporal prices to estimate the elasticity of intertemporal substitution more precisely. This is not necessarily the case for the normalisation free estimates: in the table, when T=60, the standard deviation increases with the variance of
the interest rate. If, instead, we reported estimates of γ, the standard deviation does decrease as the
variance of the interest rate increases. When σr=0.1, the corresponding estimate for γ is 1.44 (0.42). Notice
that the variance of the interest rate is one of the terms in the ‘constant’ of the equation that is present because of the log-linearization.
behaviour, leading individuals to save more, and this improves the precision of the EIS. In the ungrouped data, the first effect dominates, but grouping removes this increase and the second effect dominates. Further, it is interesting to notice that changes in the variance of wages, which increase the motive for precautionary saving, have practically no effect on the average of the estimates (both in the grouped and ungrouped case). This shows, once again, that precautionary behaviour has no direct effect on the estimates of the log-linearized Euler equation and their bias. This is because any bias depends only on the correlation between the innovations to the variance of consumption growth and the instruments used in the estimation.
Table 5: Estimates for Different Stochastic Processes
Log-linearized Equation: standard IV Log-linearized Equation: Normalization Free GMM Parameter Specification T=60 Mean Estimate [Median est.] (st.dev.)
T=120 Mean Estimate [Median est.]
(st.dev.)
T=60 Mean Estimate [Median est.]
(st.dev.)
T=120 Mean Estimate [Median est.]
(st.dev.)
Baseline σw = 0.02; σr= 0.011 [0.68]0.76
(0.40) 0.71 [0.67] (0.23) 0.72 [0.79] (0.34) 0.76 [0.71] (0.26)
σr=0.1
0.69 [0.65] (0.34) 0.66 [0.65] (0.12) 0.74 [0.70] (1.08) 0.68 [0.67] (0.13)
σw=0.02 and p=0.05
0.72 [0.66] (0.32) 0.69 [0.65] (0.19) 0.84 [0.75] (0.42) 0.73 [0.69] (0.21)
σw=0.1
0.71 [0.66] (0.28) 0.68 [0.66] (0.13) 0.80 [0.73] (0.34) 0.71 [0.68] (0.14)
Heteroscedasticity in income Innovations: P(σwt = σwt-1) = 0.8
0.73 [0.66] (0.32) 0.69 [0.67] (0.17) 0.85 [0.76] (0.44) 0.73 [0.70] (0.18)
Note: For mean estimates, standard errors in parentheses. Group size 300. True value = 0.67.
When considering an income process that is not bounded away from zero, our results, in terms of average estimates and precision, do not change much. This is remarkable as such an income process induces a substantial amount of precautionary saving. This result shows, once more, that log-linearizing the Euler equation does not introduce a systematic bias in the estimation of the structural parameters, independently of the strength of the precautionary saving motive.
Finally, we turn to the consideration of heteroscedasticity in the wage process. Given the fact that the log-linearized Euler equation includes a conditional variance, this is the most likely situation in which its use in estimation could introduce biases in the estimation of the structural parameters. The particular form of heteroscedasticity we consider makes the variance follow a Markov process with two values of the
variance. Thus, the variance in t is the same as in t-1 with probability ρ, and this is symmetric between the
high and low values. The value ρ = 0.8, high σε = 0.1 and low σε = 0.005. As is apparent from the table,
this particular form of heteroscedasticity in the wage process does not affect the average estimates of the elasticity of intertemporal substitution substantially.
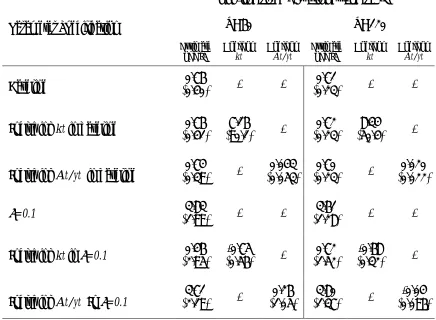
5.3 Adding the approximation error
As we mentioned above, within our framework it is possible to compute, using quadrature methods and
our numerical solutions to the consumption function, the true value of kt. A natural check on whether the approximation used in the log-linearization is responsible for any bias we encounter in our Montecarlo exercise is to add such a variable to equation (9) and check what changes it makes to the performance of
the IV estimator. In this case, we also add kt to the list of instruments. The results are reported in Table 6. In this table, we also add to equation (9) the ratio of current wealth to current income, which has been
proposed as a proxy for kt. We report the results with T=60 and T=120.
The results show that, in the baseline case, the omitted term in the log-linearisation does not matter for the
mean estimate of the EIS or for the standard deviation. The results on the coefficient on kt itself are somewhat disappointing. The coefficient is extremely variable and, on average, very far from the true value
it should attract, -1/γ. In the case where the discount rate is very high (0.1), however, the average
estimate of the EIS remarkably close to its true value. Finally, while the test of overidentifying restriction
rejects 90% of the time when δ=0.1, this percentage drops to 3.6% when we add kt to equation (9).
Table 6: Tests of the Approximation Error
Log-linearized Equation: standard IV
T=60 T=120
Parameter Specification
Estimate
of EIS Coeff onkt Coeff onAt/yt Estimateof EIS Coeff onkt Coeff onAt/yt
Baseline (0.40)0.76 - - (0.23)0.71 -
-Including kt in baseline (0.41)0.76 (90.1)7.16 - (0.23)0.72 (50.4)8.34
-Including At/yt in baseline (0.39)0.74 - (0.053)0.043 (0.23)0.70 - (0.022)0.020
δ=0.1 (1.99)3.83 - - (1.28)3.61 -
-Including kt in δ=0.1 (2.95)0.46 (0.56)-0.75 - (1.52)0.72 (0.32)-0.68
-Including At/yt In δ=0.1 (2.19)3.71 - (1.05)0.26 (1.37)3.80 - (0.096)-0.04
Note: For estimates, standard errors in parentheses. Group Size 300. True value = 0.67.
[
−γ∆ln 1+ 1 +lnβ]
= + t+ h t t
t E C r
k
This suggests that the difficulty with the high discounting case may be due to the approximation bias. However, the difficulty remains even if we use the nonlinear GMM estimator where there is no approximation bias: for T=120, on ungrouped data, nonlinear GMM estimates the EIS at 0.084 (0.045) when the true value is 0.67; and for T=60, the EIS is estimated at 0.075 (0.057).
equation. These results seem to confirm, once more, that the log-linear approximation of the Euler equation does not introduce, per se, any systematic bias.
If consumption growth and interest rates are jointly log normal, the residuals of the non linear Euler
equation εt are also log-normal and kt includes only conditional second moments. As a final exercise, we checked the conditional log-normality of the residuals of the Euler equation. While we can formally reject normality, as the tails of the distribution are slightly fatter than those of a gaussian distribution, such a deviation is not substantial for the baseline case.
5.
Conclusions
It is well known that to obtain consistent estimates of structural preference parameters from an Euler equation, in the absence of complete markets, it is necessary to use ‘large-T’ asymptotics. In the presence of measurement error and unobserved heterogeneity it is advisable to work with specifications that are linear in the parameters and with additive residuals. For this reason, the log-linearization of the non-linear Euler equations typically derived from homothetic preferences seems particularly attractive. The issue is then whether variation in the conditional second (or higher) moments that are typically included in the constant of the log-linearized Euler equation induce any bias in the estimation of the elasticity of intertemporal substitution. We have presented Montecarlo evidence that shows that under a variety of assumptions, the approximated Euler equation yields consistent estimates of the EIS. We have used the isoelastic specification and the instruments often used in the applied literature. Our results show that, at least for the cases that we considered, the endogenously determined conditional variance of consumption growth (and of the interest rates) is uncorrelated with the instruments we use in estimation. Interestingly, our results hold even in the case in which we consider heteroscedastic innovations to the wage processes. We have also shown that the use of grouped data can improve the efficiency of the estimates.