Accepted Manuscript
Title: A big data analytics method for tourist behaviour analysis
Author: Shah J. Miah Huy Quan Vu John Gammack Michael McGrath
PII: S0378-7206(16)30357-3
DOI: http://dx.doi.org/doi:10.1016/j.im.2016.11.011
Reference: INFMAN 2958
To appear in: INFMAN
Received date: 22-6-2016 Revised date: 14-10-2016 Accepted date: 28-11-2016
Please cite this article as: Shah J.Miah, Huy Quan Vu, John Gammack, Michael McGrath, A big data analytics method for tourist behaviour analysis, Information and Management http://dx.doi.org/10.1016/j.im.2016.11.011
Page #1
A big data analytics method for tourist behaviour analysis
Shah J Miah
College of business, Victoria University Melbourne, Australia
Email: [email protected]
Huy Quan Vu
Centre for Applied Informatics (CAI) College of Engineering and Science Victoria University, Melbourne, Australia Email: [email protected]
John Gammack
College of Technological Innovation Zayed University, Dubai
Email: [email protected]
Michael McGrath
College of business, Victoria University Melbourne, Australia
Page #2 Highlights
• This paper introduces a big data analytics solution for destination management organization’s decision support
• The design artifact is specified as a ‘method’ to analyse the social media data to support strategic decision-making in tourism
• Proposed solution method has the capability to provide insight of tourist’s behavioural patterns at destinations.
• The capability of the solution method is demonstrated in a case study of inbound tourists to Melbourne, Australia.
Abstract
Big data generated across social media sites has created numerous opportunities for bringing more insights to decision-makers. Few studies on big data analytics, however, have demonstrated the support for strategic decision-making. Moreover, a formal method for analysing social media-generated big data for decision support is yet to be developed, particularly in the tourism sector. Using a design science research approach, this study aims to design and evaluate a ‘big data analytics’ method to support strategic decision-making in tourism destination management. Using geotagged photos uploaded by tourists to the photo-sharing social media site, Flickr, the applicability of the method in assisting destination management organisations to analyse and predict tourist behavioural patterns at specific destinations is shown, using Melbourne, Australia, as a representative case. Utility was confirmed using both another destination and directly with stakeholder audiences. The developed artefact demonstrates a method for analysing unstructured big data to enhance strategic decision making within a real problem domain. The proposed method is generic, and its applicability to other big data streams is discussed. Keywords: tourism destination management; tourist behaviour; big data; predictive analytics; strategic decision support
1. Introduction
Page #3
voluntary posts and digital photo and video uploads. Infographic [28] suggests that YouTube users upload 72 h of new video files per minute, which is indicative of the very large amount of data that must be handled in any real-world analytics project. However, traditional data management approaches are capable neither of managing such a large and diversified amount of data nor of handling its effective growth and maintenance as the volume and velocity of relevant data increase [4; 27; 73].
Big data is characterised by its Volume (much bigger than traditional data sets), Velocity (the rapid speed with which it is produced and available), Variety (of formats in particular), Variability (over time and diversity of sources), and Volatility (inconsistent levels of production) [57]. ‘Big data analytics’ describes the activities involved in the specification, capture, storage, access and analysis of such datasets to make sense of its content and to exploit its value in decision-making [22]. Big data has attracted increasing attention by researchers and business decision-makers: examples in tourism include knowledge generation for strategic planning purposes in tourism destinations (TDs) [18], hospitality management [74], customer relation management [56] and destination marketing [47]. Although social media has been considered as a useful and reliable source of tourist information [68], the analysis of big data generated particularly through social media remains underexplored, particularly in TD management. In this study, we focus on supporting strategic decision-making in this sector, because, in general, big data analytics has not yet provided use cases for strategic decision support [57].
A TD can be described as a geographical area that offers tourists the opportunity of participating in a variety of attractions and activities and an area that is supported by all the hospitality and other services that the visitor might require. Fundamentally, a TD is a collection of physical locations in which tourists spends their time and visits for sightseeing (both constructed and natural sites), participating in activities (e.g. swimming, skiing and learning) and enjoyment (e.g. visits to bars, events, shops and restaurants). Destination management organisations (DMOs) are responsible, in general, for managing and promoting the TD, liaising with the local tourism industry and leading development strategies. Therefore, they must be alert to the needs of future marketplace and collaborations among the various stakeholders involved [19; 71].
Page #4
used for photo sharing (Flickr), video sharing (YouTube), immediate response sharing (Twitter), photo & comment sharing and discussion (Facebook). Such data are rarely collected by tourism authorities, despite the fact that it might offer important insight into tourists’ behaviour and preferences relevant to TD management. Current technologies for analysing and converting such big data into meaningful decision support information are not widely available outside large corporations. In part, this is because that the massive volume and variety of the big data sets extend beyond the scope of the more common analytics tools [4].
A major challenge in TD management is how to track the behaviour of tourists. Destination managers need to know the details of specific locations visited by tourists, what attracts tourists at each location, personal reflections on tourists’ experiences and future travel behavioural intentions. In general, most current approaches are unable to address these issues in a decision-centric, integrated and comprehensive manner. Most of the existing methods for analysing social media data are focused on finding answers to specific questions that are predefined in their studies (e.g. [10; 53]) and not on developing a general understanding of tourists’ movement, interests and experiences (e.g. [41; 77]). Some location-based analytics methods are specialised for analysing spectral or GPS-tracked data to extract flows and patterns of tourist movement within particular regions [8]. Parameterisation of spatial and temporal dimensions is non-trivial, depending critically on GPS accuracy, threshold choices and often prior limited knowledge of the dataset: such approaches also suffer from size of cell that affects summary statistics in the case of spatially aggregated data, and likewise the temporal resolution of the observations [54]. Patterns
identified by them neither indicate the semantics of visitor movements nor demographic variations; thus, it seems imperative that new analytic methods, considering information implicit in big data, are required for DMO’s strategic decision-making.
Page #5
A DSR methodology is adopted, where the seven design guiding principles of Hevner et al. [25] are used to design, evaluate and communicate the solution. As defined by March and Smith [46], our design artefact is specified as a “method”1 designed to process and analyse social media big data, such as geotagged photos, together with their associated personal and meta-data, to support DMO’s strategic decision-making within the context of TD management.
Our solution method combines four computational techniques such as text processing, geographical data clustering, visual content processing and time series modelling to more comprehensively address the DMO’s decision support needs. This method has the capability to provide insight into tourists’ behaviour, and to assist with the forecasting of future and seasonal demands for the purposes of tourism
development, management and planning. Using geotagged data allows unstructured social media to be analysed and categorised numerically by using algorithms such as the density-based cluster algorithm proposed by Kisilevich et al. [34] to identify, for example, attractive places.
The remainder of the paper is structured as follows. Section 2 overviews the background literature relevant to the design of the solution artefact. Details of the research study methodology are discussed, and, in the subsequent section, we specify details of the design artefact, describing our contribution in the context of previous, relevant work. We then demonstrate the value of the artefact, according to utility, usability and accuracy criteria, within a representative case context. The discussion section highlights overall contributions of the study, followed by the conclusion section that includes the details of study limitations and identification of avenues for further research.
2. Literature overview
In this section, we first introduce the big data paradigm, with an emphasis on unstructured user-generated posts in social media within the context of their potential benefit to tourism decision-making. We then focus on the application of analytics solution in tourism, particularly for TD management, to highlight the importance of designing a new analytics method for DMO’s strategic decision support.
2.1 Social media as big data source
1 A method as a design research artefact specifies a way to perform goal-directed activities. It defines processes and
Page #6
“Big Data” refers to the very large datasets that are increasingly available as digital activity increases. The data recorded through CCTV cameras, GPS and sensor networks, and the increased communication using digital texts, uploaded photos and blog posts mean that huge amounts of data are potentially available for analysis. Big data is classically characterised not just as voluminous, but also having variety (different types) and having velocity, in that it is often available in real- or near-real time. A formal definition has been proposed by De Mauro et al. [16, p. 131]: “Big Data is the Information asset
characterised by such a High Volume, Velocity and Variety to require specific Technology and Analytical Methods for its transformation into Value.” Variant definitions suggest veracity, volatility (variability) and so on to reflect particular aspects of datasets.
“Social Media” is defined as a “generic term for social interactions built on a multitude of digital media and technologies, which allow users to create and share content and to act collaboratively” [59, p. 3]. Social media provides voluminous, varied and velocitous data of potential value to decision makers and is a rich source for big data [31]. Social media data are generated by the popular use of social networking applications and websites, such as Facebook, Twitter, LinkedIn, Tumblr, TripAdvisor, YouTube and Flickr. Content includes user-produced blog posts about real-time activity, photos, short videos (typically but not necessarily), brief comments or opinions and professional or personal information. The
widespread growth of social media sites allows voluntary public sharing of such information and has created a new and extensive global society of always-connected people enthusiastic about sharing, interacting and collaborating [13; 14].
Travel blogs, online travel reviews and online consumer reviews are all rich sources of big data. Studies, such as those of Marine-Roig and Clavé [47] and Xiang et al. [74], suggested that big data provides a huge amount of detail that contains deep-structure information on experiences, feelings, interests and opinions. In general, authors agree on the strategic value of big data in the field of tourism [35; 42; 47] in areas relevant to DMOs, such as the construction of destination image through the electronic word-of-mouth effect [26; 29].
2.2 Big data analytics and tourism
Page #7
predominantly for information systems design), these possibilities directly apply in data-intensive
industries such as tourism, particularly for DMOs in the context of TD planning and operations. However, most existing support tools are not capable of coping with the sheer volume and rich data diversity that characterises the domain, as well as the data management required given expanding growth of datasets and user-produced content. In most cases, databases, rules, models and other traditionally relevant technologies and methods employed in decision support systems were not designed to work with social media data: instead, these work best with highly structured data [15; 67]. In contrast, 95% of big data is unstructured, necessitating the development of new analytic tools and techniques specific to the properties of big data sets [22]. Big data analytics leverages multiple datasets from a heterogeneous variety of associated media and metadata to drive decisions concerning the future, and predictive analytic
techniques designed for smaller, structured data sets will have to be adapted, complemented or replaced. With regard to predictions, Conway and Klabjan [11] noted that the existing forecasting models (and relevant visualisations) can be improved by the “more granular record of the past” afforded by big data’s more accurate inputs [p.135].
Various new analytics approaches and frameworks have been proposed under the umbrella of the social media and big data paradigm. We classified the analytics applications into two subgroups: (a) social media analytics in general and (b) social media analytics in tourism. Both the groups use data generated through social media, but the former refers to the analytics for general business applications, whereas the latter refers to analytics specifically relevant to tourism management. The following paragraphs discuss these groups in detail.
Page #8
determination of business trends and customer mood within the business environment [20]. Organisation-specific social media big data has also been used to enhance managers’ understanding of stakeholders’ concerns to better inform managerial decisions relating to stakeholders and their connection with major events [30].
In tourism context, most analytics have centred on travel recommender systems (TRS), though earlier systems rarely used social media and were not designed for use by DMOs. Kurashima et al. [36] used the sequence of locations in tourists’-shared geotagged photos to identify and recommend travel routes that can be personalised according to interests and time available. Shi et al. [60] used geotagged photos sourced from Flickr to recommend landmarks, personalised to individual users, which reflect their specific tastes, not necessarily the most popular landmarks. Similarly, Khotimah et al. [32] proposed a TRS that extracted data from various social media in Indonesia to provide a user-related recommendation that can overcome the sparsity problem caused when users rarely post, and the static nature of information in traditional TRS. Bao et al. [2] provided a comprehensive survey of TRS that use location-based data in social networks, but do not relate any of these to support strategic decision-making by DMOs. Cheng and Edwards [9] used visual analytics on data sourced from Sina Weibo (the “Chinese Twitter”) to provide destination managers insights into the effect of travel news on the attitudes of potential Chinese consumers. Marine-Roig and Clavé [47] proposed a method composed of five stages to gather and analyse big social data and images; the five stages are as follows: destination choice, web-hosting selection, data collection, pre-processing and content analysis. Although their study did not involve the development of any new analytics tool, their work is very pertinent within the context of the design of innovative analytics solutions in smart TD management. These various studies point to the underexploited potential for social media data to inform the DMO’s strategic decisions [36].
2.3 Analytics in TD management
Page #9
activities. This information is useful for destination marketing, and services such as transportation can be better planned to meet the actual needs of tourists. An issue with the existing approaches to tourist behaviour analysis is that DMOs usually predetermine what should be examined, which may leave out other important visitor interests. Thus, DMOs have, to date, been unable to form an accurate picture of what activities visitors have actually been involved in. For many TDs (typically with a wide variety of different attractions), this information is crucial. In addition, traditional approaches to information gathering for TD management and planning purposes have previously relied heavily on surveys and questionnaires. This approach is time-consuming and not particularly effective. DMOs still face major difficulties in finding accurate answers to the following critical questions: What attracts tourists when visiting a destination? What locations do tourists visit in exploring a destination? What are the tourist’s personal experiences at each of the visited attractions? What, at a fine-grained level (e.g. broken down by market segment, origin or age), does future tourism demand look like? By making use of big data, a DMO could obtain comprehensive insights on tourists’ activities, their experiences and personal reflections. With regard to the determination of tourist preferences in TD management, Surugiu and Surugiu [62] highlighted the need for destination managers and entrepreneurs to use technological innovations,
particularly social media, for collecting information on specific trends of interest and disseminating brand messages to potential visitors. Some previous studies, related to analytics solution development for TD management, are detailed in Table 1.
*** Please Insert Table 1 here***
Page #10
purpose of this study is, therefore, to outline a solution method for analysing social media big data, which can provide a comprehensive insight into tourists’ behaviour and better predict future tourism demand, to support the decision-making of destination managers in the context of smart TD management.
3. Methodology
This section describes how DSR methodology is employed as a research strategy for designing,
developing and communicating the proposed big data analytics solution as a design artefact, specifically, a method. The details on data collection and processing are also included in the section for the
representations of theoretical and practical implications of the design. The evaluation approach is also discussed in this section.
3.1 Approaches
This research follows in the tradition of Hevner et al. [25] and Gregor and Hevner [23], in targeting a deeper understanding for the enhancement of organisational capabilities (in particular, a DMO’s ability to make more informed strategic decisions) by developing a more powerful IT solution artefact. The adopted research methodology is modelled on the framework proposed by Hevner et al. [25], which conforms to seven guidelines covering three broad project phases (described in Table 2): identifying business problems and artefact types; artefact creation and evaluation and, finally, research contributions of the artefact and communication of results.
March and Smith [46] argued that design research can produce four types of artefacts: constructs, models, methods, and instantiations. In our study, we design a method as artefact, consisting principally of a set of algorithms intended to address current shortcomings in TD management decision support including the need for an improved understanding of tourists’ interests and locations visited, and the need for better tourism demand prediction.
Page #11
purposes: (1) determination of the relevant problem and design artefact required; (2) development and evaluation of the artefact; and (3) dissemination and knowledge creation of the research.
*** Please Insert Table 2 here***
3.2 Data collection and processing
This work uses geotagged photo data publicly available on the photo-sharing site, Flickr. Those photos were taken by users along their travelling path using GPS-enabled photo capturing devices that
automatically record geographical information. The photos and their associated metadata can be extracted using Flickr’s Application Programming Interface [64]. For TD management, we can define the region, from which we want to extract data, by using a bounding box, whose coordinates are referenced by 𝑙𝑜𝑚𝑖𝑛, 𝑙𝑎𝑚𝑖𝑛, 𝑙𝑜𝑚𝑎𝑥 and 𝑙𝑎𝑚𝑎𝑥 for minimum longitude, minimum latitude, maximum longitude and maximum latitude, respectively. In addition to geographical data, temporal information such as photo taken date and time is also recorded automatically and stored in the photo tag. We can define the photo taken period by two parameters 𝑡𝑚𝑖𝑛 for earliest time and 𝑡𝑚𝑎𝑥 for latest time. Only photos taken within the defined region and time period are returned.
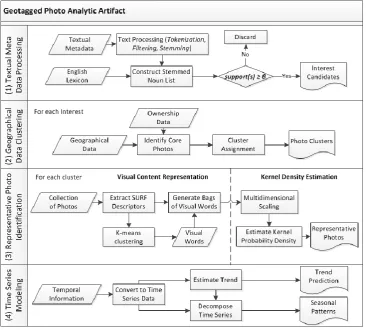
As mentioned earlier, the proposed method for geotagged photo data processing comprises four techniques, the details of which were described in the subsequent sections, as follows: (1) textual
metadata processing; (2) geographical data clustering; (3) representative photo identification and (4) time series modelling.
3.3.1 Textual Metadata Processing
The textual metadata of photos often contain specific keywords, which may reflect certain priorities or tourists’ interests and motivations when taking photos. Such textual data is normally unstructured, which is not suitable for the analysis without some form of pre-processing. We employ a powerful text
processing tool named General Architecture for Text Engineering (GATE) [21]. GATE [21] provides several language databases, including an English lexicon, containing a comprehensive list of vocabulary terms for descriptions of interests.
Page #12
algorithm, wherein the stream of text is broken into words, phrases, symbols or other meaningful elements called “tokens”. A filter is applied to the tokens to normalise all letters to lowercase, and to remove elements such as symbols and numbers. The remaining tokens are input into a stemming process to reduce inflected words to their stem, base, or root form. It is assumed that the English vocabulary of noun type is used to refer to entities of interests (e.g. street, building and tree). A list of stemmed nouns appeared in the data set is constructed, and is denoted as 𝑆 = {𝑠1 , 𝑠2 , . . . , 𝑠𝑚}. The type of words such as nouns, verb or adjective can be determined based on a set of tags associated with each word in the English lexicon. A binary vector 𝐛(𝑢𝑖) = {𝑏
1(𝑢𝑖), 𝑏2(𝑢𝑖), … , 𝑏𝑚(𝑢𝑖)} is then constructed for each user, where
𝑏𝑗(𝑢𝑖) takes the value of 1 if 𝑠j appear at least once in the textual metadata of the photo collection
belonging to user 𝑢𝑖; or 0 otherwise. Let 𝑈 denote the total number of users in the collected data set, and
𝐶(𝑠𝑗) denote the count of the vector 𝐛, whose value is 𝑏𝑗 = 1. The degree of interest of each stemmed
noun 𝑠𝑗∈ 𝑆, reflecting the degree of tourist interest, is evaluated by a support value:
(3.1) 𝑠𝑢𝑝𝑝𝑜𝑟𝑡(𝑠𝑗) =𝐶(𝑠𝑈𝑗)
A user predefined support threshold 𝛽 is used to measure the significance of the nouns in the data set. If a noun 𝑠𝑗, satisfies 𝑠𝑢𝑝𝑝𝑜𝑟𝑡(𝑠𝑗 ) ≥ 𝛽, that noun is selected into a tourist interest candidate list; otherwise,
it is removed. As a result, a list of interest candidates is automatically constructed from the textual metadata. A TD researcher can inspect the list to identify potential tourist interests for the subsequent analysis.
3.3.2. Geographical Data Clustering
Page #13
longitude and latitude, respectively. Distance between two photos 𝑝𝑖 and 𝑝𝑗 on the Earth’s surface is computed [49] and denoted as 𝐷(𝑝𝑖 , 𝑝𝑗). Let 𝑟 be a neighbourhood radius. The neighbourhood photo
𝑁𝑟(𝑝𝑖) of a photo 𝑝𝑖 is then defined by:
(3.2) 𝑁𝑟(𝑝𝑖) = (𝑝𝑗∈ 𝑃̂ , 𝑂(𝑝𝑗) ≠ 𝑂(𝑝𝑖)|𝐷(𝑝𝑖, 𝑝𝑗) ≤ 𝑟)
where 𝑂(𝑝𝑗) is an ownership function to specify the owner of photo 𝑝𝑗. Let |𝑁𝑟(𝑝𝑖)| be the number of owners of the neighbouring photos 𝑁𝑟(𝑝𝑖), and 𝛼 be an owner number threshold. Photo 𝑝𝑖 is called a core photo if |𝑁𝑟(𝑝𝑖)| ≥ 𝛼. At the beginning of the clustering process, all photos are marked as unprocessed. For each photo 𝑝𝑖, if it is a core photo, it is assigned to a cluster 𝑐 and its neighbours assigned to a queue to be processed next; otherwise, it is discarded. Each of the neighbouring photos is then processed and assigned to the current cluster 𝑐 until the queue is empty. The process is iterated for the rest of the photos in 𝑃̂, and the result is a set of clusters 𝐶 = {𝑐1 , 𝑐2 , . . . }. The geographical coordinates of the clusters are then examined to determine the location of tourist interests and their spatial extent.
3.3.3. Representative Photo Identification
Given a specific location, tourism managers are interested in identifying the most representative photos for each tourist interest. This allows insight into tourist’s personal experience to be obtained, with implications for developing promotional material and destination iconography. In our artefact, representative photos are defined as those photos whose contents appear most frequently in a set of photos. Our representative photos identification is carried out in two steps: Visual Content Representation and Kernel Density Estimation
Page #14
extracted and then vector quantised into the visual words for the vocabulary. Each photo is then presented as a bag of visual words, denoted as 𝐰(𝑝𝑖) = {𝑤
1(𝑝𝑖), 𝑤2(𝑝𝑖), … , 𝑤𝑘(𝑝𝑖)}. The value of each element 𝑤𝑗(𝑝𝑖) is
the number of times the visual word 𝑤𝑗(𝑝𝑖) appears in photo 𝑝𝑖. Values of 𝑤𝑗 are varied depending on the
content in photos, which helps to characterise the visual content of the photos.
Kernel Density Estimation (KDE): KDE is a non-parametric method to estimate the probability density function of a random variable [63]. Let {𝐱1 , 𝐱2 , . . . , 𝐱n} be a sample set of d-dimensional random vectors drawn from a common distribution described by the density function 𝑓. The multivariate kernel density at each point 𝐱 is estimated as:
(3.3) 𝑓̂𝐇(𝑥) =1
𝑛∑ 𝐾𝐇(𝐱 − 𝐱𝑖)
𝑛
𝑖=1
where 𝐇 is a 𝑑 × 𝑑 symmetric and positive definite matrix, which acts as a smoothing parameter.
𝐾𝐇(𝐱 − 𝐱𝒊) = |𝐇|−
1
2𝐾 (|𝐇|−
1
2(𝐱 − 𝐱𝒊)) is the kernel, a non-negative function that integrates to one and
has mean zero. The choice of the kernel function 𝐾𝐇(𝐱 − 𝐱𝒊) is not crucial to the accuracy of kernel density estimators [7].
In practice, multivariate kernel density estimators in more than three dimensions suffer from the curse of dimensionality [51]. A higher dimensional space is sparsely populated by data points, with very few neighbouring data points to any value 𝐱. It is thus necessary to reduce the dimensionality of the data points for the bag of visual words features, while still preserving the similarity or distance between them. We thus apply the Multidimensional Scaling (MDS) technique [6] to the bag of words feature. Let 𝛿𝑖,𝑗 ≈
||𝐰(𝑝𝑖)− 𝐰(𝑝𝑗)|| be the Euclidean distance between the bag of word features of photos pair 𝑝
𝑖 and 𝑝𝑗 . The goal of MDS is to find vectors 𝐱𝑝1, 𝐱𝑝2, … ∈ 𝑅𝑑 such that ||𝐱(𝑝𝑖)− 𝐱(𝑝𝑗)|| ≈ 𝛿𝑖,𝑗, where the chosen value of d is small (2 or 3). After the application of the MDS process, each bag of words 𝐰(𝑝𝑖) =
{𝑤1(𝑝𝑖), 𝑤2(𝑝𝑖), … , 𝑤𝑘(𝑝𝑖)} having 𝑘-dimensions is transformed into a low-dimensional vector 𝐱(𝑝𝑖) =
{𝑥1(𝑝𝑖), 𝑥
2
(𝑝𝑖), … , 𝑥
𝑑(𝑝𝑖
)} having 𝑑 dimensions. Given the reduced dimensional feature 𝐱, we then identify
Page #15
densities are returned as representative photos. The general theme of the photo collection for each feature of interest can be easily identified by examining the small numbers of representative photos.
3.3.4 Time Series Modelling
Given a geotagged photo data collection, time series data are constructed by counting the number of tourists according to months. The trend of the time series can be estimated using a parametric approach because it produces smooth trend curves representing the overall tendency, and allowing for future trends to be computed for prediction purposes. Popular fitting functions include linear, exponential and quadratic types, whose description is provided in [12]. The choice of fitting function can be determined using the mean absolute error (MAE), a commonly used measure of model performance in time series analysis:
(3.4) 𝑀𝐴𝐸 =∑𝑁𝑡=1|𝑂𝑡− 𝐸𝑡|
𝑁
where 𝑂𝑡 and 𝐸𝑡 are the original time series data and estimated trend, respectively. 𝑁 is the total number of data samples. It should be noted that in our study, the use of MAE is to select the most appropriate model for trend estimation rather than to predict an actual value of the time series. A smaller MAE indicates a better model for our purpose of analysis. Besides the trend, we can reveal seasonal patterns using a time series decomposition technique. The seasonal component is obtained by subtracting the estimated trend 𝐸𝑡 from the original time series 𝑂𝑡. By assuming that seasons are months, seasonal mean values are computed as the average of seasonal components for the same month according to years. Figure 1 shows an example of time series decomposition. The trend was modelled using a quadratic function (Figure 1.a), and seasonal means are shown by the red line, whose values are computed by the average of seasonal components for each month (Figure 1.b).
4. *** Please Insert Figure 1 here***Artefact description
Page #16
geographical data, we used an algorithm called P-DBSCAN [34], which identifies areas of high photographing activity, using information both on the number of tourists supplying photos and the number of photos uploaded to find clusters in popular tourist locations. This algorithm ensures the identified “attractive places” are decided by the tourists’ own choices of photographic subject, and is analysed at fine-grained levels, allowing local, domestic and various groups of international tourists’ distinctive cluster patterns to be discerned. The third technique is to identify representative photos (e.g. the photo subjects that most frequently appear) for each tourist interest that provide insights into tourist’s own experience and interests. The representative photo identification stage is carried out in two distinct steps: visual content representation and kernel density estimation as described in Section 3. Finally, the time series data modelling technique aims to predict future tourism demand and reveal seasonal travel patterns for future planning and decision-making.
*** Please Insert Figure 2 here***
The four techniques are combined together in our solution artefact to process and analyse different types of data (textual tags, geographical tags, photo content and time), to provide deeper and more
Page #17
and seasonal effects for better planning and strategic decision-making. The effectiveness of our solution artefact is demonstrated using the case of a major tourist destination, Melbourne, Australia, in Section 5.
5. Evaluation and case demonstration
Hevner et al. [25] offered five approaches for evaluating design artefact: observational, analytical, experimental, testing and descriptive. We adopted the descriptive approach as we used case data (Melbourne) as a representative destination for tourism, which can be validated against justifiably accepted knowledge and independent tourism statistics. The experimental approach was also partially adopted; in that, qualities of the proposed artefact were evaluated through internal assessments of comparative quantitative settings and fitting models. By referring to ongoing stakeholder evaluation during iterative development, validity and utility considerations were addressed throughout. The
algorithms and techniques used, namely P-DBSCAN and SURF [3], are stable and robust and have been independently shown to be superior to alternatives in the literature already cited.
The following section demonstrates the practical application of the proposed method through an
expository illustration using tourists’ social media data for Melbourne, Australia. Melbourne represents a major destination, serving both domestic and international markets, and, receiving 2.4 million
international visitors in the current year to March 2016 and 8.4 million domestic visitors in 2015 [66]. This generates a lot of social media content. The geotagged photo data were extracted and processed using the framework discussed in the previous section to identify tourist interests, locations,
representative photos and to support demand forecasting. Description and analysis of the results are provided, followed by a discussion of practical implications.
5.1 Data description
The geotagged photo data set used in this study was collected from Flickr using its API. A bounding box, with coordinates, 𝑙𝑜𝑚𝑖𝑛= 144.40882, 𝑙𝑎𝑚𝑖𝑛= −38.222732, 𝑙𝑜𝑚𝑎𝑥= 145.578864 and 𝑙𝑎𝑚𝑎𝑥= −37.461429, was designed to cover the entire geographical area of Melbourne, as indicated on Google
Page #18
downloaded, using ‘medium’ size (as defined within Flickr), which is adequate to display content sufficiently clearly for subsequent processing stages while reducing computing costs.
In addition to an overall analysis of tourist interests, our solution artefact also predicts the demand for different demographics groups. The geographic origin of each user was retrieved from Flickr based on the UserID. Melbourne residents were treated as local tourists, whereas tourists coming from other parts of Australia (domestic tourists) were labelled as the Australia group. International visitors were grouped based on their home continent. Most international tourists came from Asia, Europe, North America, and thus, only these groups were considered in this analysis. As provision of resident location is not essential when creating a Flickr account, many users did not provide such information. In total, 2550 tourists were identified with location of residence as shown in Table 3. Although this number of tourists is less than that of the original data set, it is sufficient to extract trend and seasonal patterns for demand forecasting. Here we noticed that local tourists appeared to take many more photos than tourists from other locations, with more than 46 photos per tourist. Tourists from other groups took around 16 photos each on average. This is probably because that tourists from other places are limited by the time constraints of their trips, whereas local residents have a longer time to explore, which results in more photos being taken. *** Please Insert Table 3 here***5.2 Tourist interest identification
The entire photo collection was used in this experiment. Textual metadata attached to the photos that were processed using the method discussed earlier (Section 3.3.1). Some photos did not have tags, title or description as users did not tag or provide a description when uploading. These were treated as missing data.
Using MATLAB as the computing environment, we first evaluated the performance of the textual processing technique with different support thresholds 𝛽, ranging from 0 to 0.1. The number of interest candidates for different 𝛽 values is shown in Fig. 3a. The numbers of interest candidates drop
Page #19
words such as “Melbourne”, ”Victoria”, ”Australia”, which have no meaning in the context of
Melbourne-specific tourist interests. In addition, if descriptive words were synonyms (e.g. “sunset” and “nightfall”), only the word with the highest support was kept. The refined list of tourist interest candidates consisting of 17 items ranked from the highest to lowest support (Fig. 3b).
*** Please Insert Figure 3 here***The results indicated that Melbourne visitors are interested in built infrastructure such as street, bridge, tower, house, station and architecture (It is notable that Melbourne has significant Victorian era architecture, as well as the more modern Federation Square at its central area around Flinders Street and Swanston Street). Natural scenes also received substantial attention and that included sunset, river, tree, beach and sky. Other attractions of interest included art, park, garden, people, car (possibly tramcar) and shop.
5.3 Location of interest
From the list in Fig. 3a, relevant photos for each interest candidate were extracted. Each photo collection was then input into the geographical data clustering process as presented in Section 3.3.2. The
neighbourhood radius 𝑟 is set to 0.002, which is equivalent to approximately 150 m. The minimum owner 𝛼 is set to a value of 10% of the total number of tourists in each photo collection. An advantage of our
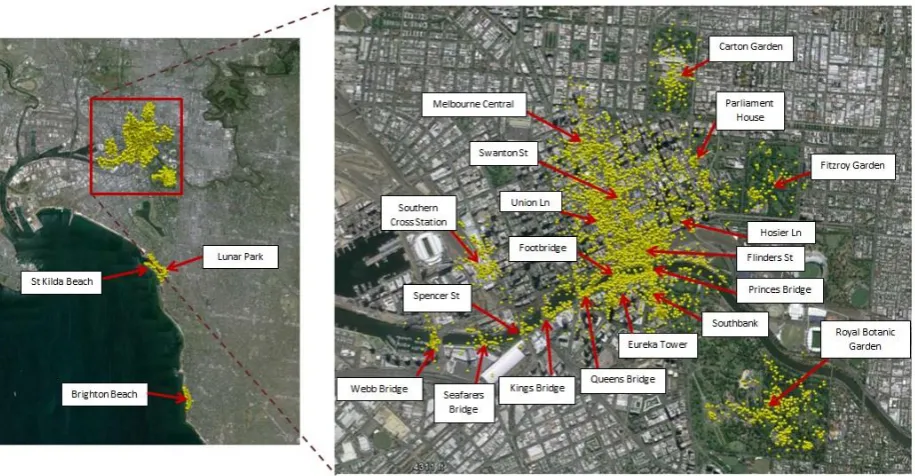
approach is the ability to integrate geographical data into GIS services such as Google Maps. The resulting clusters were inspected to determine the locations and geographical extent of the interests. Figure 4 shows the clusters for tourists’ interests in Melbourne. The clusters are represented by the coloured dots on the satellite images. The clusters for different interests are visualised with the same colour to make it convenient for cluster location identification purpose, and then an interest profile is constructed based on the identified locations.
Page #20
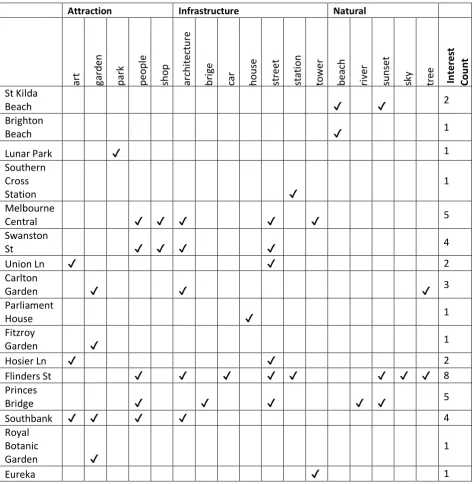
We inspected the clusters for each interest separately to identify their specific locations. Table 4 summarises the locations of interests. The columns indicate the interests, while the rows indicate the specific locations. A tick means that tourists have a specific interest at that specific location. We can see that some locations have multiple interests such as Melbourne Central, Flinders Street and Princes Bridge, as shown with the high values (5 or more) for interest count. These are in fact verifiably the most iconic locations for tourists when visiting Melbourne. On the other hand, some locations have unique interests such as Brighton Beach, Southern Cross Station, Parliament House, Fitzroy Garden, Royal Botanic Garden and the bridges (Kings, Seafarers, Webb). In addition, some interests are found at different locations. For example, the art interest can be found at Union Lane, Hosier Lane and South Bank. *** Please Insert Table 4 here***5.4 Representative photo analysis
To discover tourists’ personal experience of specific interests, the system can identify the representative photos using the visual content processing approach, as introduced in Section 3.3.3. Photo visual content is extracted using Maximally Stable Extremal Regions detectors [52] and SURF [3] descriptors. The vocabulary’s size was set to 𝑘 = 400 words, generated from around 200,000 local regions from a set of random images in the photo collection. A small number of sample images and visual words have been shown to be sufficient for visual word construction [17], whereas higher numbers of visual words do not have a significant influence on performance [55]. A bag of visual word features was generated for each photo. Those photos relevant to each interest at a specific location were grouped together as a collection of photos, from which representative photos were identified.
The MDS technique was applied to each collection of photos to reduce the dimensionality of data points to 𝑑 = 3, which is sufficient for Kernel Density Estimation. The probability densities for the photos are estimated using the kernel (e.g. normal distribution) with default smoothing parameters as suggested in Bowman and Azzalini [7]. Top photos with highest probability densities are returned as representative photos.
Page #21
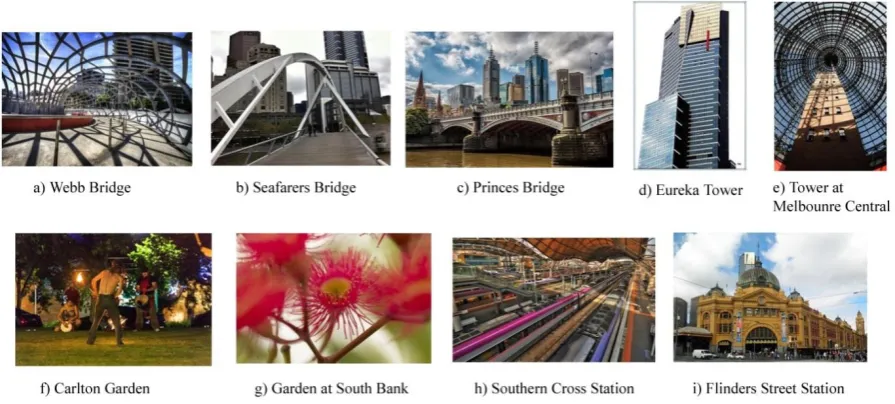
*** Please Insert Figure 5 here***We examined the representative photos for the other interests at different locations, such as people, street, car, architecture, tree, river and sky. These show general scenes, which we do not report in this paper. However, some scene clusters were found for other interests, as shown in Fig. 6. Findings of interest include the following observations:
● Tourists are interested in taking photos of the design and structure of the Webb Bridge and the Seafarers Bridge, as shown in Fig. 6a and 6b. The photo taking position is usually on the bridges. On the other hand, tourists usually take photos of Princes Bridge with river scene at a far distance (Fig. 6c).
● Photos at Eureka tower are usually taken from outside with the sky in the background (Fig. 6d). In contrast, tower photos at Melbourne Central are taken inside, with the ceiling in the background (Fig. 6e).
● Photos, which are taken at the gardens in Melbourne, usually focus on nature scenes of trees and flowers, especially from a close distance as in Fig. 6f for Carlton Garden. However, garden scenes at South Bank focus more on human activities such as the ‘fire’ attraction shown in Fig 6g. ● Contrasting scenes were found for photos of stations. Tourists are interested in the internal area of
Southern Cross Station (Fig. 6h). Photos at Flinders Street Station, a major landmark and heritage building, focus on the external area of the station (Fig. 6i).
*** Please Insert Figure 6 here***5.5 Tourism demand forecasting
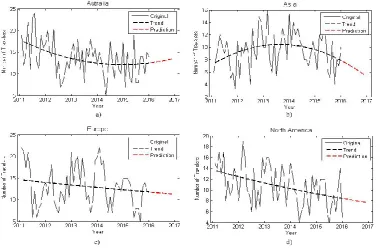
This section describes the building of time series models for predicting future tourism demand for Melbourne. The monthly arrivals of tourists for Australia, Asia, Europe and North America groups were counted for 2011–2015. Parametric fitting models were applied to the time series data for trend
Page #22
lower error. The linear model is the best for the North America data; however, the performance of all three models was relatively close.
*** Please Insert Table 5 here***On the basis of the above evaluation, we used the quadratic model to estimate and predict the trend for the Australia and Asia groups, the exponential model for the Europe group and the linear model for the North America group. Figure 7 shows the original data and the
estimated trend. There was a slight decrease in the trend of the Australia group from 2011 to 2014, which then remained stable in 2015 and may increase in 2016 (Fig. 7a). For the Asia group (Fig. 7b), there was an increasing trend until 2013 with more visitors to Melbourne, but then a decrease from 2014. The number of visitors is projected to continue to decrease gradually in 2016. Slight decreases in tourism demand were found for the Europe and North America groups (Fig. 7c and Fig. 7d), and these were estimated to continue reducing in 2016. It should be noted that the predictions only estimate the future trend of tourist demand, not the actual number of tourist arrival, as the model was not built on the true statistics of tourist arrivals. However, the method provides a fine-grained analysis to complement and qualify the estimates from aggregated figures projected from general surveys and official statistics. Besides identifying trends, tourism managers need to know the seasonal patterns of tourist arrivals for strategic planning and decision-making. Seasonal mean models for the 5-year data set were computed using the time series decomposition method described in Section 3. No clear seasonal pattern was found for the Australia group, as shown by the fact that mean values are relatively close to 0 (Fig. 8a). Asian tourists are more likely to visit Melbourne in February, and least likely in June (Fig. 8b). This historical pattern has been independently established for Chinese visitors to Australia (China is Australia’s largest inbound market by expenditure and visitor nights) [65], and helps validate the utility of our analysis. Similarly, a clear pattern was found for the Europe group (Fig. 8c): they are more likely to visit
Melbourne from December to March, but less in the middle of the year. A slightly different pattern was found for the North America group (Fig. 8d): the high peak time for this group is from January to March and in November; the low peak time is from April to September.
*** Please Insert Figure 7 here*** *** Please Insert Figure 8 here***
Page #23
In this paper, we have described a method for analysing social media big data for strategic decision support by DMOs. To manage a TD effectively, DMOs need to have a comprehensive understanding of tourists’ interests, visited locations, tourists’ personal experience and be able to predict future tourism demand [75]. Data generated by social media provide details of individuals’ experiences and expression with time-stamped, demographic and evidence-based insights that contribute to the DMO’s understanding of market perceptions and behaviour.
Traditional analytics methods and specialised techniques are inadequate for analysing the huge and unstructured social media datasets that hold diversified data formats, and the growth of this data is massive. Previous studies have developed analytics solutions for automatically detecting tourists’ behaviour and city preferences (e.g. [77]) but have not been designed for visual photo content and
metadata processing to capture tourists’ experiences. In addition, they are incapable of making predictions necessary for a DMO’s fine-grained strategic decision-making needs. Our approach performs tourism demand prediction based on temporal information extracted from social media data, rather than using data from surveys and questionnaires as in traditional approaches (e.g. [1; 44]). Equally location-based analytics are just beginning to emerge in GIS design theories to explain and contextualise spatial analyses and our research contributes to nascent design theory here too.
By adopting the established principles of DSR as one of the eminent information systems design methodologies, we have gone beyond existing big data analytics methods in automatically detecting tourist’s interest in objects, particular spots and clusters, along with detailed insights on collective behavioural and nationality profiles. Our study has developed an IT artefact in the form of a general method for generating meaningful information and predictive insights from geotagged photos. Results show that our solution method (as IT artefact) can detect key patterns and trends for a representative major tourist destination with the details relevant to strategic DMO decision-making.
Page #24
accurately reflect tourists’ interests and enrich their travel experience, for example, by suggesting tourists visit St Kilda Beach for a sunset experience and associated photographs.
The representative photos provide insight into tourists’ perspectives and perceptions. DMOs could show photos of bridge structures when designing websites or marketing material for the Webb Bridge and Seafarers Bridge (which have intrinsic architectural interest), whereas a river scene could be shown for the, more traditional, Princes Bridge. There is an increasing trend for domestic tourists to visit Melbourne, and they also have a wide range of interests. DMOs could develop differentiated travel packages that suit the demands of local and interstate markets through insights emerging from the application of the method. Parts of the method previously have been detailed to academic audiences (e.g. through academic
workshops), and the complete artefact has also been informally outlined to both academic and industry audiences, and this helped to improve the design iteratively and to ensure the relevance to the actual decision-making processes of DMOs. In addition, we have successfully tested the artefact using a number of experiments (although only the results for Melbourne have been presented in this paper for the
Page #25
The limitations of the study largely concern the completeness of the collected data. Social media contains other sources of valuable, but unstructured data, such as tweets and videos. These can also potentially be mined to discern tourists’ sentiments and interests. A second limitation is the profile of those posting photos: they may be assumed to be younger and tech-savvy. In time though, it is anticipated that older tourists will increasingly take photos and upload them to social media. A third limitation is that a single site, Flickr, was used as the data source. Sites such as Instagram, Snapchat, Facebook, Twitter and other blog hosts all support photo uploads, of which many are publicly accessible. However, some of these social media sites strip the metadata, or limit the time for which a photo is available, which restricts the use of the method for data from these sources.
7. Conclusion
We have presented a method to extract, rank, locate and identify meaningful tourist information from unstructured big data sets for supporting the DMO strategic decision-making. By analysing geotagged photos along with other related details, our method is applicable to different destinations and generated useful results, as illustrated for the case of Melbourne, Australia. We followed the established theory and methodological guidelines of DSR for the design, development and dissemination of the generated artefact; a method, one of the four types of design artefact recognised in the DSR literature in information systems. We utilised MATLAB, a numerical computing environment, together with Google maps, a desktop web mapping service, as the technical platform/environment to develop and evaluate the solution method.
Page #26
Page #27 References
[1] Akin, M. (2015). A novel approach to model selection in tourism demand modelling. Tourism Management, 48, 64-72.
[2] Bao, J., Zheng, Y., Wilkie, D., & Mokbel, M. (2015). Recommendations in location-based social networks: A survey. Geoinformatica, 19, 525-565.
[3] Bay, H., Ess, A., Tuytelaars, T., & Gool, L.V. (2008). Speeded-up robust features. Computer Vision and Image Understanding, 110 (3), 346-359.
[4] Bello-Orgaza, G., Jung, J. J., & Camacho, D. (2016). Social big data: Recent achievements and new challenges. Information Fusion, 28, 45–59.
[5] Blázquez, J. J., Molina, A. & Esteban, A. (2012). Key quality attributes according to the tourist product. European Journal of Tourism Research, 5(2), 166–170.
[6] Borg, I. & Groenen, P.J.F. (2005). Modern multidimensional scaling: theory and applications (2nd ed.). New York: Springer-Verlag.
[7] Bowman, A. W. & Azzalini, A. (1997). Applied smoothing techniques for data analysis: The kernel approach with S-Plus illustrations, New York, USA: Oxford University Press.
[8] Chancellor, H.C. (2012). Applying Travel Pattern Data to Destination Development and Marketing Decisions, Tourism Planning & Development, 9:3, 321-332
[9] Cheng, M. & Edwards, D. (2015). Social Media in Tourism: A Visual Analytic Approach, Current Issues in Tourism, 18(11), 1080-1087.
[10] Chua, A., Servillo, L., Marcheggiani, E., & Moere, A.V. (2016). Mapping Cilento: Using geotagged social media data to characterize tourist flows in southern Italy, Tourism Management 57, 295-310 [11] Conway, D. & Klabjan, D. (2012). Innovation Patterns and Big Data. In J. Liebowitz, (eds), Big Data
and Business Analytics, CRC Press Book.
[12] Cooray, T. M. J. A. (2008). Applied Time Series: Analysis and Forecasting. Alpha Science Intl Ltd. Oxford, UK.
Page #28
[14] Couldry, N. (2012). Media, Society, World: Social Theory and Digital Media Practice, Polity. [15] Demirkan, H. & Delen, D. (2013). Leveraging the capabilities of service oriented decision support
systems: putting analytics and big data in cloud. Decision Support Systems, 55(1), 412–421. [16] De Mauro, A., Greco, M., & Grimaldi, M. (2016). A formal definition of Big Data based on its
essential features, Library Review, 65(3), 122-135
[17] Fergus, R., Li, F.F., Perona, P., & Zisserman, A. (2010). Learning object categories from internet image searches. Proceedings of the IEEE, 98(8), 1453-1466.
[18] Fuchs, M., Höpken, W., & Lexhagen, M. (2014). Big data analytics for knowledge generation in tourism destinations – A case from Sweden. Journal of Destination Marketing & Management, 3, 198– 209.
[19] Fyall, A., Garrod, B. & Wang,Y. (2012). Destination collaboration: A critical review of theoretical approaches to a multi-dimensional phenomenon. Journal of Destination Marketing and Management, 1(1-2), 10-26.
[20] Gallinucci, E. Golfarelli, M., & Rizzi, S. (2015). Advanced topic modelling for social business intelligence. Information Systems 53, 87–106.
[21] GATE (2016). General Architecture for Text Engineering, http://gate.ac.uk/, Accessed 10.10.2016 [22] Gandomi, A. & Haider, M. (2015). Beyond the hype: Big data concepts, methods, and analytics.
International Journal of Information Management, 35, 137–144.
[23] Gregor, S. & Hevner, A.R. (2013). Positioning and presenting design science research for maximum impact, MIS Quarterly, 37 (2), 337-355.
[24] He, W., Wu, H., Yan, G., Akula, V., & Shen, J. (2015). A novel social media competitive analytics framework with sentiment benchmarks. Information & Management, 52, 801–812
[25] Hevner, A., March, S., Park, J., & Ram, S. (2004). Design Science in Information Systems Research, MIS Quarterly 28 (1), 75-105.
[26] Hidalgo, M.C., Sicilia, M., & Ruiz, S. (2014).The effect of user-generated content on tourist behavior: The mediating role of destination image, Tourism &Management Studies, 10, 158–164. [27] IBM (2015). Big data and analytics,
Page #29
[28] Infographic (2014).The Data Explosion in Minute by Minute. http://aci.info/2014/07/12/the-data-explosion-in-2014-minute-by-minute-infographic, Accessed 10.06.2016
[29] Jalilvand, M.R., Samiei, N., Dini, B., & Manzari, P.Y. (2012). Examining the structural relationships of electronic word of mouth, destination image, tourist attitude toward destination and travel intention: An integrated approach, Journal of Destination Marketing & Management, 1(1–2), 134–143.
[30] Jiang, S., Chen, H., Nunamaker, J.F., & Zimbra, D. (2014). Analyzing firm-specific social media and market: A stakeholder-based event analysis framework, Decision Support Systems, 67, 30–39
[31] Khan, N., Yaqoob, I.A.T., Hashem, I., Inayat, Z., Ali, W.K.M., Alam, M., Shiraz, M., & Gani, A. (2014). Big data: survey, technologies, opportunities, and challenges. The Science World Journal, 1– 18.
[32] Khotimah, H., Djatna, T., & Nurhadryani, Y. (2014). Tourism recommendation based on vector space model using composite social media extraction, In the Proceedings of the International
Conference on Advanced Computer Science and Information Systems (ICACSIS), Jakarta, p. 303-308. [33] Kisilevich, S., Keim, D., & Rokach, L. (2013). A GIS-based decision support system for hotel room
estimation and temporal price prediction: the hotel brokers’ context. Decision Support Systems, 54(2), 1119-1133.
[34] Kisilevich, S., Mansmann, F., & Keim, D. (2010). P-DBSCAN: A density based clustering algorithm for exploration and analysis of attractive areas using collections of geo-tagged photos. In the
Proceedings of the First international conference and exhibition on computing for geospatial research & application. Paper. 38.
[35] Koltringer, C. & Dickinger, A. (2015).Analyzing destination branding and image from online sources: A web content mining approach. Journal of Business Research, 68(9), 1836–1843. [36] Kurashima, T., Iwata, T., Irie, G., & Fujimura, K. (2013). Travel route recommendation using
geotagged photos. Knowledge and Information Systems, 37 (1), 37-60.
Page #30
[38] Lee, I., Cai, G. & Lee, K. (2013). Points-of-Interest Mining from People’s Photo-Taking Behavior, In Proceedings of the 46th Hawaii International Conference on System Sciences, 3127- 3134.
[39] Li, F-F. & Perona, P. (2005). A Bayesian hierarchical model for learning natural scene categories. In the Proceedings of the IEEE Computer Society Conference on Computer Vision and Pattern
Recognition (CVPR). San Diego, CA, USA, p. 524 - 531.
[40] Li, F-F., Fergus, R., & Torralba, A. (2007). Recognizing and learning object categories. http://people.csail.mit.edu/torralba/shortCourseRLOC/index.html, Accessed 13.06.2016
[41] Li, Y., Xiao, L., Ye, Y., Xu, W., & Law, A. (2016). Understanding tourist space at a historic site through space syntax analysis: The case of Gulangyu, China. Tourism Management, 52, 30-43 [42] Lu, W. & Stepchenkova, S. (2015).User-generated content as a research mode in tourism and
hospitality applications: Topics, methods, and software, Journal of Hospitality Marketing & Management, 24(2), 119–154.
[43] Lue, C.C., Crompton, J.L. & Fesenmaier, D.R. (1993) Conceptualization of Multi-destination Pleasure Trips, Annals of Tourism Research, 20(2), 289–301.
[44] Ma, E., Liu, Y., Li, J., & Chen, S. (2016). Anticipating Chinese tourists arrivals in Australia: A time series analysis. Tourism Management Perspectives, 17, 50-58.
[45] Majid, A., Chen, L., Chen, G., Mirza, H.T., Hussain, I., & Woodward, J. (2013). A context-aware personalized travel recommendation system based on geotagged social media data mining, International Journal of Geographical Information Science, 27(4), 662-684
[46] March, S. & Smith, G. (1995). Design and Natural Science Research on Information Technology. Decision Support Systems, 15, 251-266.
[47] Marine-Roig, E. & Clavé, S.A. (2015). Tourism analytics with massive user-generated content: A case study of Barcelona, Journal of Destination Marketing & Management, 4, 162–172.
[48] Mehmetoglu, M. (2007). Nature-based Tourists: The relationship between their trip expenditures and activities. Journal of Sustainable Tourism, 15(2), 200–215.
Page #31
[50] Musto, C., Semeraro, G., Lops, P., & Gemmis, M. (2015). CrowdPulse: A framework for real-time semantic analysis of social streams. Information Systems, 54, 27–146.
[51] Nagler, T. & Czado, C. (2015). Evading the curse of dimensionality in multivariate kernel density estimation with simplified vines, technical paper, Cornell University. http://arxiv.org/abs/1503.03305, Accessed 13.06.2016
[52] Nister, D. & Stewenius, H. (2008). Linear time maximally stable external regions. In Proceedings of the 10th European Conference on Computer Vision. Marseille, France, p. 183-196.
[53] Oku, K., Hattori, F. & Kawagoe, K. (2015). Tweet-mapping method for tourist spots based on now-tweets and spot-photos, Procedia Computer Science, 60, 1318 – 1327
[54] Orellana, D., Bregt, A.K., Ligtenberg, A., & Wachowicz, M. (2012). Exploring visitor movement patterns in natural recreational areas, Tourism Management, 33, 672-682
[55] Olaode, A., Naghdy, G., & Todd, C. (2014). Unsupervised image classification by probabilistic latent semantic analysis for the annotation of images. In Proceedings of the International conference on digital image computing: Techniques and applications (DICTA). Wollongong, NSW, Australia, p. 1-8.
[56] Phillips-Wren, G. & Hoskisson, A. (2015). An analytical journey towards big data. Journal of Decision Systems, 24, 87–102.
[57] Power, D.J. (2015). ‘Big Data’ Decision Making Use Cases, Springer International Publishing Switzerland.link.springer.com/content/pdf/10.1007%2F978-3-319-18533-0_1.pdf, Accessed 13.05.2016.
[58] Qiu, J., Wu, Q., Ding, G., Xu, Y., & Feng, S. (2016). A survey of machine learning for big data processing. EURASIP Journal on Advances in Signal Processing. 1-16, DOI: 10.1186/s13634-016-0355-x
[59] Schoder, D., Gloor, P.A., & Metaxas, P.T. (2013). Social Media and Collective Intelligence: Ongoing and Future Research Streams. Künstliche Intelligenz, 27 (1), 9-15.
Page #32
[61] Supak, S., Brothers, G., Bohnenstiehl, D.W., & Devine, H. (2015). Geospatial analytics for federally managed tourism destinations and their demand markets. Journal of Destination Marketing &
Management, 4 (3), 173-186.
[62] Surugiu, M.R. & Surugiu, C. (2015). Heritage tourism entrepreneurship and social media: opportunities and challenges. Procedia - Social and Behavioral Sciences, 188, 74-81
[63] Terrell, G. R., & Scott, D. W. (1992). Variable kernel density estimation. The Annals of Statistics, 20(3), 1236-1265.
[64] The App Garden (2016). https://www.flickr.com/services/api/, Accessed 13.06.2016. [65] Tourism Australia (2014).
http://www.tourism.australia.com/documents/Markets/MarketProfile_China_May14.pdf, Accessed 13.06.2016.
[66] Tourism Victoria (2016). Tourism in Victoria Summary year ending June 2016, http://www.tourism.vic.gov.au/research/, Accessed 13.06.2016
[67] Tsai, C. W., Lai, C.F., Chao, H.C., & Vasilakos, A. V. (2015). Big data analytics: a survey. Journal of Big Data, 2(21), 1-32.
[68] Tilly, R., Fischbach, K., & Schoder, D. (2013). Assessing the potential of social media to reflect global tourism. In Proceedings of the European Conference on Information Systems (ECIS), p. 17. [69] Vailaya, A., Figueiredo, M. A., Jain, A. K., & Zhang, H.-J. (2001). Image classification for
content-based indexing. IEEE Transactions on Image, 10(1), 117-130.
[70] Vogel, J. & Schiele, B. (2004). A semantic typicality measure for natural scene categorization. In Proceedings of the 26th DAGM symposium, Tubingen, Germany, p. 195-203.
[71] Wang, Y. (2011). Destination Marketing and Management: Scope, Definition and Structures. In Y. Wang & A. Pizam (Eds.), Destination marketing and management: theories and applications, CABI, Wallingford, Oxford.
[72] Wang, D., Li, X. & Li, Y. (2015). China's “smart tourism destination” initiative: A taste of the service-dominant logic, Journal of Destination Marketing & Management, 2 (2), 59–61
Page #33
[74] Xiang, Z., Schwartz, Z., Gerdes, J. H., & Uysal, M. (2015). What can big data and text analytics tell us about hotel guest experience and satisfaction?. International Journal of Hospitality Management, 44,120–130.
[75] Yang, X., Pan, B., Evans, J. A., & Benfu, L. (2015). Forecasting Chinese tourist volume with search engine data. Tourism Management, 46, 386 - 397
[76] Zbuchea, A. (2012). Cultural interests while on holidays: An exploratory investigation. Journal of Tourism Challenges & Trends, 5(2), 53–70.
[77] Zhou, X., Xu, C., & Kimmons, B. (2015). Detecting tourism destinations using scalable geospatial analysis based on cloud computing platform. Computers, Environment and Urban Systems, 54, 144-153.
Page #34
(a) Trend (b) Seasonal Means
Figure 1: Time Series Decomposition Example
Page #35
a) Number of Candidates with different 𝛽 b) Identified Candidates with 𝛽 = 0.05 Figure 3: Tourist Interest Candidates
Page #36
a) Art b) Sunset
Figure 5: Representative photos for Art and Sunset Interests
Page #37 Figure 7: Trend Estimation
Page #38 Table 1: Key studies: Analytics Solutions for TD Management
Sources Solution
methods
Key theories Types of big data TD purposes
Chua et al. [10]
Method of flow analytics
Trajectory mining technique to process the tweet data
Geotagged twitter data Tourist flow and temporal details of destinations Chancellor [8] Method of
extracting travel pattern
LCF (Lue, Crompton and Fesenmaier) five-pattern model [43] of recreational travel pattern analysis Mobile interviewer collected data from visitors’ stops Travel pattern data for destination development
Fuchs et al. [18] Business intelligence OLAP (Online Analytical Processing) and ETL (Extract, Transform, Load) Facebook, Youtube, and other e-reviews
Generate tourist-based knowledge in Sweden
Leung et al. [37]
Method of social media analysis
Traditional technique of trip diary
Tourist generated social media data (from six social media sites) Identifying tourist movement in destinations (pre, during and post-Beijing Olympic games), Li et al. [41] Space syntax
analytics
Space Syntax analysis following time series
GPS and location-based sensors (high-resolution video and picture)
Understanding of tourist space in China
Orellana et al. [54]
Method of data analytics
Page #39 suspension and generalized sequential patterns Oku et al. [53] Method of
identifying tourism spot
DBSCAN clustering and Support Vector Machine techniques are used to train and extract the spots
Geotagged twitter data Identifying about spot (destinations) in regions
Supak et al. [61]
Geospatial big data analytics
GIS and open source
web-mapping application
Federal and enterprise records of visitors data
For creating tourist demand model and market profiling Zhou et al.
[77] Cloud-based analytics Image clustering, cluster representation, cluster refinement and tracking, spatial analysis using cloud computing
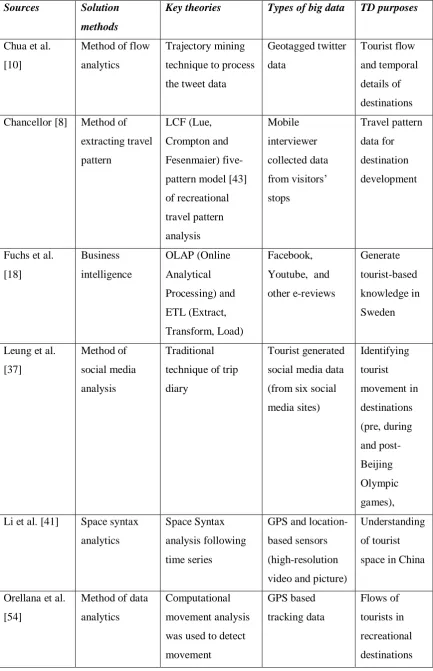
Page #40 Table 2: DSR study phases and guidelines [25, p. 83]
Our project phases
Utilised DSR Guidelines
Our artefact design
identifying business problems and artefact types Guideline 1: Design as an Artefact. Guideline 2: Problem Relevance
The study has produced a big data analytics method designed to generate key decision support information for TD operational and strategic planning purposes.
DMOs worldwide must make strategic predictions. Most current DSSs are incapable of handling largely unstructured social media data, and the supporting processes (methods) for this purpose have also not been adequately detailed in the previous research. This is the essence of the research gap addressed by our DSR study. artefact creation and evaluation Guideline 3: Design Evaluation. Guideline 5: Research Rigor. Guideline 6: Design as a Search Process.
To demonstrate artefact utility, experiments have been conducted, coupled with a case scenario analysis using test datasets. Iterative development in consultation with representative stakeholders ensured ongoing evaluation and relevance.
The big data analytics artefact was constructed using proven mathematical modelling techniques and evaluated using
fundamental and commonly accepted research methods (experiment and case study).
Mathematical modelling methods employed in other domains were adapted for use in this study. The design process was iterative to cope with much of the uncertainty inherent in the problem space (e.g. with TD management requirements) and to allow progressive and incremental development and evaluation.
Research
contribution
s of the
artefact and
communicati
on of results
Guideline 4: Research Contributions.
Guideline 7: Communicatio n of Research.
The algorithms and techniques produce clear and testable results. The sequence of complementary techniques produces a valuable analysis of big data directly relevant to strategic decision support. The experimental outcomes and case analysis have shown clear benefits and new approach to the target decision makers.
Page #41
Table 3: Data Collections by Travel Groups
Group No. of Tourist No. of Photos Photos Per
Tourist
Local 895 41,675 46.56
Australia 422 6,558 15.54
Asia 338 5,189 15.35
Europe 481 7,831 16.28
North America 414 6,990 16.88
Total 2550 68,243
Table 4: Tourist Interests by Specific Locations
Attraction Infrastructure Natural
art gard
en
p
ark peop
le sho p arc h it ec tu re b ri ge
car ho
u se st reet st at io n to we r b eac h ri ver sun set
sky tree Inter
es t C o u n t St Kilda
Beach ✔ ✔ 2
Brighton
Beach ✔ 1
Lunar Park ✔ 1 Southern
Cross
Station ✔ 1
Melbourne
Central ✔ ✔ ✔ ✔ ✔ 5 Swanston
St ✔ ✔ ✔ ✔ 4
Union Ln ✔ ✔ 2 Carlton
Garden ✔ ✔ ✔ 3
Parliament
House ✔ 1
Fitzroy
Garden ✔ 1
Hosier Ln ✔ ✔ 2 Flinders St ✔ ✔ ✔ ✔ ✔ ✔ ✔ ✔ 8 Princes
Bridge ✔ ✔ ✔ ✔ ✔ 5 Southbank ✔ ✔ ✔ ✔ 4 Royal
Botanic
Garden ✔
1
Page #42 Tower
Footbridge ✔ ✔ 2 Queens
Bridge ✔ ✔ 2 Kings
Bridge ✔ 1
Spencer St ✔ 1 Seafarers
Bridge ✔ 1
Webb
Bridge ✔ 1
Location
Count 3 4 1 5 2 5 5 1 1 6 2 2 2 5 2 1 2
Table 5: Mean Absolute Errors for different Travel Groups by fitting model
Model Group
Australia Asia Europe North
America
Linear
3.527 2.901 2.917 2.800 Exponential
3.510 2.915 2.916 2.817 Quadratic
![Table 2: DSR study phases and guidelines [25, p. 83]](https://thumb-us.123doks.com/thumbv2/123dok_us/7998693.1328421/41.595.78.526.94.757/table-dsr-study-phases-guidelines-p.webp)