4(35): 5657-5666, 2014
SCIENCEDOMAIN international www.sciencedomain.org
Comparison of Health Students’ Perceptions
and Expectations of Their Educational
Environment
Mandana Shirazi
1, Teamur Aghamolaei
2*, Ideh Dadgaran
3and Amin Ghanbarnejad
41
Educational Development Center, Virtual school and Medical School, Tehran University of Medical Sciences, Tehran, Iran. 2
Department of Public Health, Health School, Hormozgan University of Medical Sciences, Bandar Abbas, Iran. 3
Centre for Educational Research in Medical Sciences, Education Development Center, Guilan University of Medical Sciences, Rasht, Iran. 4
Department of Public Health, Health School, Hormozgan University of Medical Sciences, Bandar Abbas, Iran.
Authors’ contributions
This work was carried out in collaboration between all authors. All authors read and approved the final manuscript.
Received 27th November 2013 Accepted 23rd January 2014 Published 16th August 2014
ABSTRACT
Aims: Understanding the strengths and weaknesses of educational environment can help managers to improve the educational system. The aim of this study was determining the gap between students’ perceptions and expectations of the educational environment at Health School of Hormozgan University of Medical Sciences in Iran.
Methodology: In this cross-sectional study a total of 250 health students were studied. To determine the students’ perceptions and expectations they filled out a questionnaire included 56 pairs of five point likert scaled items with six domains including school atmosphere, teaching and learning, teachers, students’ self perception, educational facilities and equipments and the physical environment. Descriptive statistics and paired t-test were used to evaluate and analyze the data by SPSS ver.19.
the educational environment were significantly higher than their perceptions (p<0.001). The gaps between the students’ perceptions and their expectations in school atmosphere, teaching and learning, teachers, students’ self-perception, educational facilities and equipments and physical environment domains were 1.42, 1.00, 1.03, .49, 1.53, and -1.16 respectively.
Conclusion: Students’ expectations have not been fulfilled and to achieve the ideal level, proper planning and effective efforts with emphasis on facilities and equipment and school atmosphere domains should be implemented.
Keywords: Educational environment; student; perception; expectation.
1. INTRODUCTION
Service quality can be assessed by comparing customers’ perceptions and expectations of the service they receive [1]. Higher education is a service. Higher education institutes differentiate themselves from one another by fulfilling customers’ expectations [2]. Teaching is a service that is directly affected by the providers. As the universities are becoming more student-centered, students’ perceptions’ of higher education facilities will be more important. Thus, it is clear that the universities should continually assess students’ expectations and perceptions of the educational services quality [3].
Understanding and measuring customers’ perceptions and expectations is an essential component that can be used to enhance the quality of service provider organizations [4]. As higher education institutes are in competition and try to enhance the quality of educational services, evaluation of service quality in order to provide feedback on the effectiveness of training programs and their implementation is essential [5].
Recently, there have been dramatic changes in medical education world-wide [6], developing a need for students’ perceptions of their educational environment to receive special attention [7]. Educational environment is one of the important determinants of student learning behavior and its domains correlate positively with academic success and satisfaction of educational programs [8-12].
Students’ perceptions of the educational environment can be the basis for reforms and improving the quality of the educational environment. To evaluate and change the educational environment, it is necessary to use appropriate methods to assess the educational environment [6]. One of the methods for evaluating educational environment is assessment of students’ perceptions of the educational environment. Since the students’ perceptions of the educational environment may be affected by the diversity of the student population, students’ different expectations, and facilities and special conditions of the university [7], determining students’ perceptions of educational environment and collecting basic information in order to reform and improve educational program in each university is inevitable.
strengths and weaknesses of the educational system. Understanding the strengths and weaknesses of the educational system and specifying priorities for change, are the basic steps to improve and enhance the educational system. The aim of this study was determining the gap between health students’ perceptions and expectations of the educational environment at Health School of Hormozgan University of Medical Sciences in Iran, which can be a basis to implement modifications for optimizing the educational environment.
2. MATERIALS AND METHODS
2.1 Participants
This cross-sectional study was conducted at Health School of Hormozgan University of Medical Sciences in Bandar Abbas, in the south of Iran, in 2013. The target population included students studying health education, public health, environmental health, occupational health and medical entomology at the Health School. All of students, who had passed at least one semester of their course, were included in the study. The questionnaires were distributed to 250 health students and all of them filled out the questionnaires completely (response rate=100%).
2.2 Instrument
To assess the students’ perceptions and expectations of the educational environment a questionnaire was designed based on SERVQUAL model. This model represents service quality as the discrepancy between a customer's expectations for a service offering and the customer's perceptions of the service received, requiring respondents to answer questions about both their expectations and their perceptions [13]. To design the questionnaire, using a theoretical sampling method, eight students from different courses were selected and interviewed and 81 items related to educational environment extracted. These items were classified in six domains including school atmosphere, teaching and learning, teachers, students’ self perception, educational facilities and equipments, and the physical environment. Expert panels and item impact method were used to determine face validity of the tool. Content validity ratio and content validity index were also used to determine content validity of the tool. In addition, construct validity of the tool was determined by applying confirmatory factor analysis. Due to expert panel results and calculating item impact, content validity ratio and content validity index, the tool items decreased from 81 to 56. The results of confirmatory factor analysis showed that all of factor loadings are significant in 0.05 levels. To determine the reliability of the tool, Cronbach’s Alpha and Intraclass correlation coefficient were calculated. Cronbach’s Alpha for total items was 0.94 and for six domains ranged from 0.65 to 0.85.Moreover, Intraclass correlation coefficient for total items was 0.94. The final designed tool included 56 pairs of five point likert scaled items with six domains including school atmosphere (9 items), teaching and learning (10 items), teachers (10 items), students’ self perception (9 items), educational facilities and equipments (10 items), and the physical environment (8 items).
item ranging from very important to the least important. Each item was scored from 1 to 5, so that 1 represents very poor/least important and 5 represents very good/very important. In each domain, the scores of items were added up and the result was divided by the number of its items. So, the scores of perceptions and expectations of students in each domain range from 1 to 5.
The difference between students’ perceptions and expectations (P-E) represents the gap of the educational environment. Where the educational environment gap score is negative, the students’ expectations are more than their perceptions, and where it is positive, the students’ expectations are less than their perceptions.
2.3 Data Analysis
Descriptive statistics and paired t-test were used to evaluate and analyze the data by SPSS ver.19.
3. RESULTS
The mean age of the students was 22.4 (SD=3.7) years, ranging from 18 to 35. Twenty two percent of them were male and 78% were female. 44.4% were studying public health, 28.8% environmental health, 18.4% occupational health, 4% health education, and 4.4% medical entomology. Forty four percent of students were in first year, 46.4% in second year and 9.6% in third year of their course.
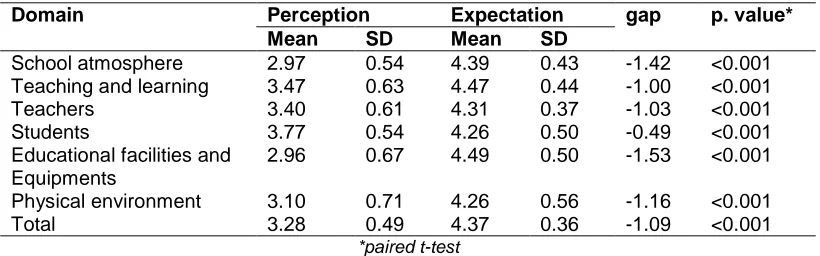
In terms of the students’ perceptions of the experienced educational environment, the students’ self perception and teaching and learning domains received higher scores; whereas facilities and equipments and school atmosphere domains received lower scores. Regarding the students’ expectations of the ideal educational environment, facilities and equipments and teaching and learning domains received higher scores; whereas physical environment domain received the lowest score Table 1.
Table 1. Comparison of students’ perceptions and expectations in educational environment domains
p. value* gap
Expectation Perception
Domain
SD Mean SD
Mean
<0.001 -1.42
0.43 4.39
0.54 2.97
School atmosphere
<0.001 -1.00
0.44 4.47
0.63 3.47
Teaching and learning
<0.001 -1.03
0.37 4.31
0.61 3.40
Teachers
<0.001 -0.49
0.50 4.26
0.54 3.77
Students
<0.001 -1.53
0.50 4.49
0.67 2.96
Educational facilities and Equipments
<0.001 -1.16
0.56 4.26
0.71 3.10
Physical environment
<0.001 -1.09
0.36 4.37
0.49 3.28
Total
*paired t-test
equipment domain (-1.53), and the least negative gap was in students’ self perception domain (-0.49). The differences between the students’ perceptions and their expectations (gaps) in all of six educational environment domains were significant (p<0.001).
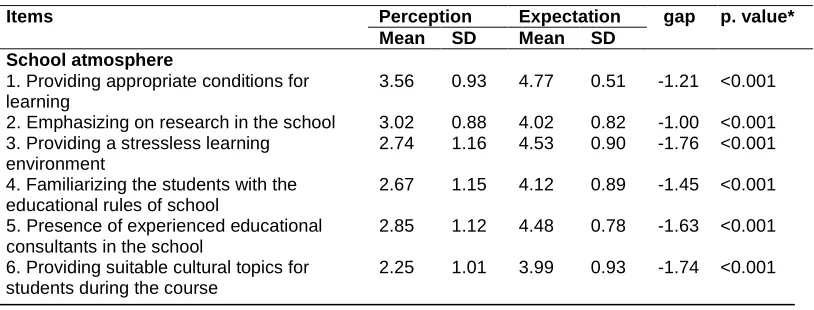
The results showed that in all of the items of the educational environment domains, students’ expectations were higher than their perceptions. In another word, in all of items of educational environment domains the gaps between students’ perceptions and their expectations were negative Table 2. The differences between students’ perceptions and their expectations (gaps) in all of the items of six educational environment domains (except one item) were significant (p<0.001).
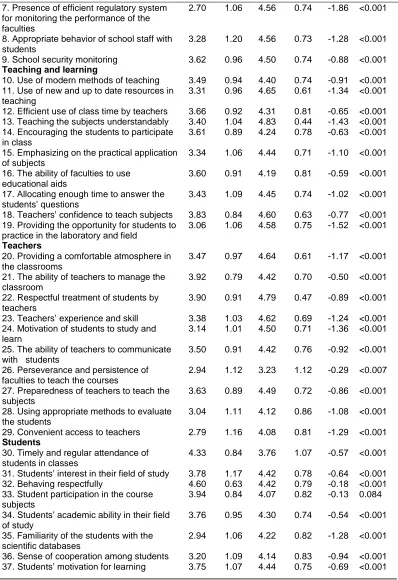
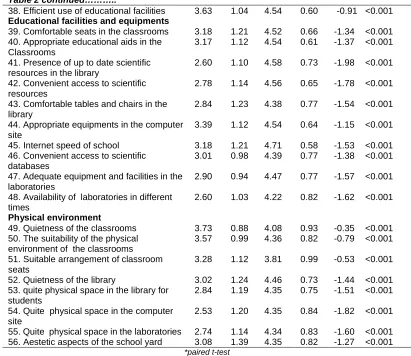
Regarding school atmosphere items, the most negative gap was related to “efficient regulatory system for monitoring the performance of the faculties” item (-1.86) and the least negative gap was related to “school security monitoring” item (-0.88). Considering teaching and learning items, the most negative gap was related to “Providing the opportunity for students to practice in the laboratory and field” item (-1.52) and the least negative gap was related to “the ability of faculties to use educational aids” item (-0.59).Concerning the teachers domain items, the most negative gap was related to “motivation of students to study and learn” item (-1.36) and the least negative gap was related to “Perseverance and persistence of faculties to teach courses” item (-0.29).About the students’ self perception domain items, the most negative gap was related to “familiarity of the students with the scientific databases” item (-1.28) and the least negative gap was related to “student participation in the course subjects” item (-0.13).Regarding the educational facilities and equipments domain items, the most negative gap was related to “presence of up to date scientific resources in the library” item (-1.98) and the least negative gap was related to “appropriate equipments in the computer site” item (-1.15).Concerning physical environment domain items, the most negative gap was related to “appropriateness of the physical space of the computer site regarding the number of computer users” item (-1.82) and the least negative gap was related to “quietness of the classrooms” item (-0.35) Table 2.
There was no correlation between age and students’ perceptions (r=0.06, p=0.39) and expectations (r=0.04, p=0.53) of the educational environment. Moreover, there was no difference between male and female students’ perceptions (t= 0.55, p=0.58) and expectations (t=-0.56, p=0.57) of the educational environment).
Table 2. Comparison of students’ perceptions and expectations in all of items of educational environment
p. value*
gap
Expectation
Perception
Items
SD
Mean
SD
Mean
School atmosphere
<0.001 -1.21 0.51
4.77 0.93 3.56 1. Providing appropriate conditions for learning
<0.001 -1.00
0.82 4.02 0.88 3.02 2. Emphasizing on research in the school
<0.001 -1.76 0.90
4.53 1.16 2.74 3. Providing a stressless learning
environment
<0.001 -1.45
0.89 4.12 1.15 2.67 4. Familiarizing the students with the
educational rules of school
<0.001 -1.63 0.78
4.48 1.12 2.85 5. Presence of experienced educational consultants in the school
<0.001 -1.74
Table 2 continued……….. <0.001 -1.86 0.74 4.56 1.06 2.70 7. Presence of efficient regulatory system for monitoring the performance of the faculties <0.001 -1.28 0.73 4.56 1.20 3.28 8. Appropriate behavior of school staff with students <0.001 -0.88 0.74 4.50 0.96 3.62 9. School security monitoring
Teaching and learning <0.001 -0.91 0.74 4.40 0.94 3.49 10. Use of modern methods of teaching
<0.001 -1.34 0.61 4.65 0.96 3.31 11. Use of new and up to date resources in teaching <0.001 -0.65 0.81 4.31 0.92 3.66 12. Efficient use of class time by teachers <0.001 -1.43 0.44 4.83 1.04 3.40 13. Teaching the subjects understandably
<0.001 -0.63 0.78 4.24 0.89 3.61 14. Encouraging the students to participate in class <0.001 -1.10 0.71 4.44 1.06 3.34 15. Emphasizing on the practical application of subjects <0.001 -0.59 0.81 4.19 0.91 3.60 16. The ability of faculties to use
educational aids <0.001 -1.02 0.74 4.45 1.09 3.43 17. Allocating enough time to answer the students’ questions <0.001 -0.77 0.63 4.60 0.84 3.83 18. Teachers’ confidence to teach subjects <0.001 -1.52 0.75 4.58 1.06 3.06 19. Providing the opportunity for students to practice in the laboratory and field
Teachers <0.001 -1.17 0.61 4.64 0.97 3.47 20. Providing a comfortable atmosphere in the classrooms <0.001 -0.50 0.70 4.42 0.79 3.92 21. The ability of teachers to manage the classroom <0.001 -0.89 0.47 4.79 0.91 3.90 22. Respectful treatment of students by teachers <0.001 -1.24 0.69 4.62 1.03 3.38 23. Teachers’ experience and skill
<0.001 -1.36 0.71 4.50 1.01 3.14 24. Motivation of students to study and learn <0.001 -0.92 0.76 4.42 0.91 3.50 25. The ability of teachers to communicate with students
<0.007 -0.29 1.12 3.23 1.12 2.94 26. Perseverance and persistence of
faculties to teach the courses
<0.001 -0.86 0.72 4.49 0.89 3.63 27. Preparedness of teachers to teach the subjects <0.001 -1.08 0.86 4.12 1.11 3.04 28. Using appropriate methods to evaluate the students <0.001 -1.29 0.81 4.08 1.16 2.79 29. Convenient access to teachers
Students <0.001 -0.57 1.07 3.76 0.84 4.33 30. Timely and regular attendance of
students in classes <0.001 -0.64 0.78 4.42 1.17 3.78 31. Students’ interest in their field of study <0.001 -0.18 0.79 4.42 0.63 4.60 32. Behaving respectfully
0.084 -0.13 0.82 4.07 0.84 3.94 33. Student participation in the course subjects <0.001 -0.54 0.74 4.30 0.95 3.76 34. Students’ academic ability in their field of study <0.001 -1.28 0.82 4.22 1.06 2.94 35. Familiarity of the students with the scientific databases <0.001 -0.94 0.83 4.14 1.09 3.20 36. Sense of cooperation among students <0.001 -0.69 0.75 4.44 1.07 3.75 37. Students’ motivation for learning
Table 2 continued……….. <0.001 -0.91 0.60 4.54 1.04 3.63 38. Efficient use of educational facilities
Educational facilities and equipments <0.001 -1.34 0.66 4.52 1.21 3.18 39. Comfortable seats in the classrooms <0.001 -1.37 0.61 4.54 1.12 3.17 40. Appropriate educational aids in the Classrooms <0.001 -1.98 0.73 4.58 1.10 2.60 41. Presence of up to date scientific
resources in the library <0.001 -1.78 0.65 4.56 1.14 2.78 42. Convenient access to scientific
resources <0.001 -1.54 0.77 4.38 1.23 2.84 43. Comfortable tables and chairs in the library <0.001 -1.15 0.64 4.54 1.12 3.39 44. Appropriate equipments in the computer site <0.001 -1.53 0.58 4.71 1.21 3.18 45. Internet speed of school
<0.001 -1.38 0.77 4.39 0.98 3.01 46. Convenient access to scientific
databases <0.001 -1.57 0.77 4.47 0.94 2.90 47. Adequate equipment and facilities in the laboratories <0.001 -1.62 0.82 4.22 1.03 2.60 48. Availability of laboratories in different times Physical environment <0.001 -0.35 0.93 4.08 0.88 3.73 49. Quietness of the classrooms
<0.001 -0.79 0.82 4.36 0.99 3.57 50. The suitability of the physical
environment of the classrooms <0.001 -0.53 0.99 3.81 1.12 3.28 51. Suitable arrangement of classroom seats <0.001 -1.44 0.73 4.46 1.24 3.02 52. Quietness of the library
<0.001 -1.51 0.75 4.35 1.19 2.84 53. quite physical space in the library for students <0.001 -1.82 0.84 4.35 1.20 2.53 54. Quite physical space in the computer site <0.001 -1.60 0.83 4.34 1.14 2.74 55. Quite physical space in the laboratories <0.001 -1.27 0.82 4.35 1.39 3.08 56. Aestetic aspects of the school yard
*paired t-test
4. DISCUSSION
Also the results showed that students’ expectations of the educational environment were high. In this regard, students’ expectations of facilities and equipments and teaching and learning domains received higher scores; whereas students’ self-perception and physical environment domains received lower scores. A study by Miles and Leinster [7] showed that students’ expectations of the educational environment are high, that is in line with the results of the current study.
As the results showed, in all of domains of educational environment students’ expectations of the educational environment were higher than their perceptions and the gaps between students’ perceptions and their expectations were negative, meaning that students’ expectations have not been fulfilled. These results are comparable to Barnes [4] and Chua [19] studies which reported that in all of domains of services there were negative gaps.
Moreover, the results showed that in all of items of educational environment domains the gaps between the students’ perceptions and their expectations were negative. These results are largely consistent with the results of Miles and Leinster study [7]. The negative gaps indicate that students’ expectations of the educational environment are higher than their perceptions.
Quality is defined as “the demands of customers” and customers’ perceptions and expectations are the main elements of quality [20,21]. Hence, responding the students’ expectations has an important role in improving the quality of educational environment, increasing the satisfaction of students and enhancing the quality of learning.
The used questionnaire in this study was designed and constructed by the authors according to the interviews to be a context based questionnaire. In addition, this study is the first one which has been conducted in an educational environment in Iran using SERVQUAL model.
One of the limitations of this study is that only five disciplines were studied and for generalization of the results more disciplines should be included in the study.
5. CONCLUSION
In all of the domains of educational environment, the students’ expectations of the educational environment were significantly higher than their perceptions. These results indicate that the school has many problems and to achieve the ideal level, proper planning and effective efforts should be implemented.
CONSENT
All authors declare that written informed consent was obtained from the participants for publication the results of this research.
ETHICAL APPROVAL
Not applicable.
COMPETING INTERESTS
Authors have declared that no competing interests exist.
REFERENCES
1. Chin KS, Pun KF. A proposed framework for implementing TQM in Chinese organizations. International Journal of Quality & Reliability Management. 2002;19(3):272-94.
2. Slade P, Harker M, Harker D. Why do they leave, why do they stay? Perceptions of service quality at a new university. ANZMAC 2000 Smith SW, (Eds). 1993 successfully completing the dissertation. Two Reflections on the Process Remedial and Special Education. 2000;14(3):53-60.
3. Anci D. How satisfied are our students. Quality management unit office for institutional effectiveness university of Johannesburg. Johannesburg, South Africa; 2006.
4. Barnes BR. Analysing service quality: The case of post-graduate Chinese students. Total Quality Management & Business Excellence. 2007;18(3):313-31.
5. Tan KC, Kek SW. Service quality in higher education using an enhanced SERVQUAL approach. Quality in Higher Education. 2004;10(1):17-24.
6. Roff S, McAleer S, Harden RM, Al-Qahtani M, Ahmed AU, Deza H, et al. Development and validation of the Dundee ready education environment measure (DREEM). Medical Teacher. 1997;19(4):295-9.
7. Miles S, Leinster SJ. Medical students' perceptions of their educational environment. Expected versus actual perceptions. Medical Education. 2007;41(3):265-72.
9. Plucker JA. The relationship between school climate conditions and student aspirations. The Journal of Educational Research. 1998;91(4):240-6.
10. Lizzio A, Wilson K, Simons R. University students' perceptions of the learning environment and academic outcomes: Implications for theory and practice. Studies in Higher Education. 2002;27(1):27-52.
11. Mayya S, Roff S. Students' perceptions of educational environment: A comparison of academic achievers and under-achievers at Kasturba Medical College, India. Education for health-Abingdon-Carfax publishing Limited. 2004;17:280-91.
12. Veerapen K, McAleer S. Students' perception of the learning environment in a distributed medical programme. Medical Education Online. 2010;15.
13. Parasuraman A, Zeithaml VA, Berry LL. Servqual. Journal of Retailing. 1988;64(1):12-40.
14. Aghamolaei T, Fazel I. Medical students' perceptions of the educational environment at an Iranian medical sciences university. BMC Medical Education. 2010;10(1):87. 15. Bassaw B, Roff S, McAleer S, Roopnarinesingh S, De Lisle J, Teelucksingh S, et al.
Students' perspectives on the educational environment, faculty of medical sciences, Trinidad. Medical Teacher. 2003;25(5):522-6.
16. Al-hazimi A, Al-hyiani A, Roff S. Perceptions of the educational environment of the medical school in King Abdul Aziz University, Saudi Arabia. Medical Teacher. 2004;26(6):570-3.
17. Dunne F, McAleer S, Roff S. Assessment of the undergraduate medical education environment in a large UK medical school. Health Education Journal. 2006;65(2):149-58.
18. Varma R, Tiyagi E, Gupta JK. Determining the quality of educational climate across multiple undergraduate teaching sites using the DREEM inventory. BMC Medical Education. 2005;5(1):8.
19. Chua C, editor. Perception of quality in higher education. Proceedings of the Australian Universities Quality Forum; 2004. Citeseer.
20. West E. Management matters: The link between hospital organisation and quality of patient care. Quality in Health Care. 2001;10(1):40-8.
21. Sharma B, Gadenne D. An investigation of the perceived importance and effectiveness of quality management approaches. The TQM Magazine. 2001;13(6):433-45.
_________________________________________________________________________ © 2014 Shirazi et al.; This is an Open Access article distributed under the terms of the Creative Commons Attribution License (http://creativecommons.org/licenses/by/3.0), which permits unrestricted use, distribution, and reproduction in any medium, provided the original work is properly cited.
Peer-review history: