Canopy
Structure
of a
Tall-grass
Prairie
SHEILA CONANT AND PAUL G. RISSER
Highlight: Several characteristics of vegetation structure, including height, basal cover, cover repetition, leaf area, and distribution of aboveground biomass, were examined in grazed and ungrazed treatments of native Oklahoma tall-grass prairie. Selected structural parameters were evaluated to determine their value as reliable predictors of biomass dynamics. Cover repetition and leaf area showed good correlation with above- ground biomass. Studies of vegetation structure may provide an additional basis for understanding grazing response in grass- land communities, and may serve as a basic tool for clarifying the roles of water, light and nutrients, and their effects on grassland production.
Vegetation structure affects the flow of energy, water, and nutrients through an ecosystem. Energy flux may be modified by vegetation structure in a number of ways. The interception and penetration of incoming solar radiation is determined in part by the structure of the plant canopy (Warren-Wilson, 1965). Vegetation intercepts heat energy that might otherwise reach the soil, and this in turn affects soil temperature and moisture (Steiger, 1933), and the evaporation of water from the soil (Forsling, 193 1). Because the plant canopy may cause air stagnation, heat storage, and transfer are affected (Van Wijk and Goedkoop, 1963), which may permit temperature (Van Wijk and Goedkoop, 1963) and ‘CO, (Knight, 1969) gradients to develop.
Vegetation structure may control water and nutrient movement directly, or indirectly by modifying energy flux. Amounts and rates of rainfall interception, evaporation, infiltration (Knight, 1969), and runoff (Forsling, 1931) of water may all be influenced by the structure of the plant community. Although nutrient flux in ecosystems is probably modified at least indirectly by vegetation structure, the nature and importance of such modifications is not well documented at present.
Land use by man invariably involves manipulation of vegetation structure. For this reason it is important to understand the relationship between structure and function in ecosystems in order to assess the probable effects of structural manipulation on the plant community.
The principal objective of this study was to describe several characteristics of vegetation structure, including height, basal cover, and the vertical characteristics of cover repetition, leaf
Authors are at the Department of Biological Sciences, California Polytechnic State University, San Luis Obispo, and the Department of Botany and Microbiology, University of Oklahoma, Norman.
This study received partial support from the National Science Foundation Grants BG-7824, GB-13096, and GB-31862X to the Grass- lands Biome, U.S. International Biological Program, for “Analysis of Structure, Function, and Utilization of Grassland Ecosystems.” The authors also acknowledge support from the University of Oklahoma Faculty Research Committee.
Manuscript received September 13, 1973.
area index, and distribution of aboveground biomass. A secondary objective was to determine which parameters of structure might be reliable predictors of aboveground biomass.
Methods
The study area, which includes grazed and ungrazed treatments of tall-grass prairie, is on the Adams Ranch in Osage County, Okla. This same area is one of the Comprehen- sive Network Sites (OSAGE Site) in the International Biologi- cal Grassland Biome. Neither treatment has been plowed, and the ungrazed treatment has not been grazed for about 15 years, although it may have been mowed as recently as 6 years prior to the study. The grazed treatment receives light to moderate grazing, primarily during the non-growing season, but grazing was excluded during the study period.
The average January temperature is 2.7”C, and the average July temperature is 27.7OC. Rainfall averages 83.0 cm per year, 63.5 cm falling during the warm season (April to September). The growing season is 205 days long. Weather Bureau data are from Pawhuska, Okla., which is about 20 miles southeast of the site.
Study area soils are dark with clayey subsoils developed on shale, sandstone, and limestone parent materials. The soil is classified as a Brunizem of the Labette-Summit-Sogan Associa- tion.
Vegetation height was determined by taking 100 random samples in each treatment. An additional 20 random height samples per treatment were taken for each of five major species of grasses - little bluestem (Andropogon scoparius), big bluestem (Andropogon gerardi), switchgrass (Panicurn virgatum), Indiangrass (Sorghastrum nutans), and tall dropseed (Sporobolus asper). It should be noted that height measure- ments of the individual species were taken during the 1972 growing season, 1 year after all other data had been collected.
Several indicators of vegetation structure were measured by means of a point frame (Fig. 1). The type of basal cover (bare soil, litter or mulch, basal cover) under the tip of each pin was recorded. Cover repetition (CR), the number of hits per pin, was determined in 15-cm increments for the five major species of grasses and three other categories, namely miscellaneous grasses, forbs, and sedges. In this paper, only the data for little bluestem, tall dropseed, the 15-cm and 30 to 45-cm levels, and totals for all species will be discussed. Little bluestem was chosen because it accounts for the greatest percent biomass composition of any species in both treatments (Risser, 197 la). Tall dropseed increases in importance with grazing (Risser, 197 1 a) and occurs in relatively large amounts, so it represents a satisfactory species to differentiate treatments. The 0 to
15-cm level contains most of the biomass, and the 30 to 45-cm level typifies the behavior of canopy levels before 15 cm.
vertical point frame (CR) inclined point frame (LAI) height-clipping (AGBM)
12 quadrat samples * l---W 4 ALA samples (1 per replicate)
I
I
lwe dead leaves leaves
1
1
IlW stems
1
dead stemsc I
determine actual leaf area
4
4 bdry and weigh
Fig. 1. hocedure for processing samples. (CR = cover repetition; LAI = leaf area index; AGBM = aboveground biomass; ALA =actual leaf area.)
by a coefficient of 0.8 to obtain LAI. This coefficient was calculated specifically for data recorded with the point frame inclined at 21S”. The method for calculating the coefficient has been described by Warren-Wilson (1963a). To correct for errors resulting from the diameter of pins, the average width and length of leaves of each species or category was deter- mined and used to calculate a correction factor (Warren-Wilson 1963b) for LA1 and cover repetition values. As a check on the accuracy of estimation of leaf area by the LA1 method, the actual leaf area (ALA) of a small part of each sample was measured with a photoelectric planimeter (Model AAM-5, Hayashi Denko Co., Ltd.). Cover repetition, LAI, and actual leaf area were determined for both live and standing dead plant material.
The vertical distribution of abovegrotmd biomass (AGBM) was assessed by height-clipping each quadrat in 15-cm incre- ments. Live plant material was separated from standing dead material, dried at 100°C for 48 hours, and then weighed. Because quadrats were height-clipped, leaving plant material in
Table 1. Average cover (%) of bare ground, litter, and basal cover as determined during the sample period.
Treatment
Type Ungrazed Grazed
Bare ground 62 22
Litter 23 71
Basal cover 12 9
small unidentifiable pieces, the total biomass of all species was combined.
One sample was taken monthly, May through October, 197 1. On each sampling date, six quadrats (three per each of two replicates) in the ungrazed treatment and ten quadrats (five per each of two replicates) in the grazed treatment were clipped. Before height-clipping the quadrats, both a vertical and an inclined point frame with ten pins per frame were read. Figure 1 illustrates how each sample was processed. Actual leaf area measurements were made from portions of the plant material clipped from one quadrat per replicate per treatment.
Data from each sample were subjected to two types of statistical analysis. The t-tests were performed to detect differ- ences within (between replicates) and between the two treatments. Correlation coefficients were calculated to deter- mine the degree of correlation of each of three variables (cover repetition, LAI, actual leaf area) with aboveground biomass (AGBM). In addition, correlation coefficients were calculated to determine the degree of correlation of LA1 with actual leaf area.
Height Results and Discussion
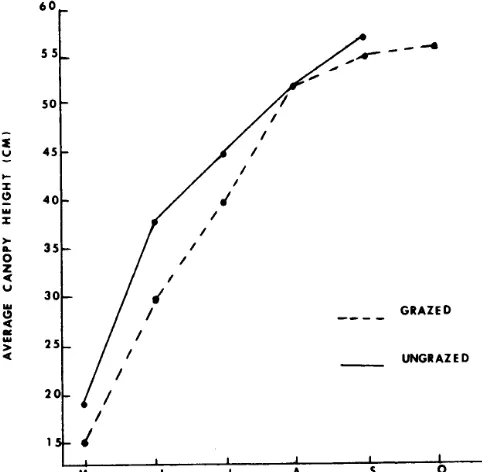
Average canopy height increased most rapidly during the interval between May and June (Fig. 2). The ungrazed treatment was significantly taller than the grazed treatment on the May, June, and July sampling dates. The similarity in height of both treatments observed in the latter part of the growing season may have been due to flowering. The average heights of the five major species of grasses generally followed the same pattern as the vegetation as a whole.
Basal Cover
,
Average percent ground covered by litter during the sample period was significantly higher in the grazed treatment, while percent bare ground was significantly higher in the ungrazed treatment (Table 1). Basal cover was not significantly higher in the ungrazed treatment. Consistently higher values for percent cover of litter in the grazed treatment may be due to trampling
Table 2. Aboveground biomass (g/m2 dry weight) throughout the sample period.’
Biomass O-15 cm interval 30-45 cm interval
Month status Ungrazed Grazed Ungrazed Grazed
Total
Ungrazed Grazed
May
June July August September October
Live Dead Live Dead Live Dead Live Dead Live Dead Live Dead
79.3 78.9
422.5 122.3**
194.5 120.7*
278.6 142.9**
100.2 131.5**
392.2 184.2**
114.0 166.8
325.4 147.3**
94.1 107.7
418.0 191.9**
61.6 126.6**
366.2 234.2*
0.8 0.0
8.4
o.o*
31.7 25.4
5.4 3.3
64.5 48.1
11.2 9.0
23.3 16.6
14.0 4.0
24.1 32.3
21.4 8.9*
16.5 21.4
21.6* 6.9*
85.3 86.6
484.1 143.5**
310.7 208.4*
307.6 173.2**
271.7 277.0
452.1 239.9**
226.2 244.9
403.3 175.0**
190.9 207.8
517.6 265.3**
125.4 187.2**
477.0 277.6**
‘Significant difference between treatments: ** = P < 0.01, * = P < 0.05.
z
z 25.20
GRAZED -_- _
UNGRAZED
MONTH
Fig. 2. Average canopy height throughout thegrowing season. (Signifi- cnnt difference between treatments ** = P < 0.01.)
or the residual effects of previous grazing. Higher percent bare ground in the ungrazed treatment is probably the result of larger individual plants which canopies more extended than those found in the grazed treatment and by the occurrence of proportionately more bunch grasses and fewer annual grasses and forbs in the ungrazed treatment.
Biomass
Total live aboveground biomass (AGBM) (Table 2) in the ungrazed treatment increased from May until June, when peak standing crop was reached. Peak standing crop of live AGBM on the grazed treatment occurred in July. Ungrazed live AGBM was significantly higher than grazed live AGBM in June, when the ungrazed treatment had reached peak standing crop. However, live AGBM was usually lower in the ungrazed treatment, especially in October, when the difference may have been accentuated by the renewed growth of cool season grasses such as Japanese brome grass (Bromus japonicus) and Kentucky bluegrass (Poa pratensis).
Total dead AGBM in the ungrazed treatment decreased between May and June, but from June to October there was a net increase. In the grazed treatment total dead AGBM showed
a net increase from May until October. Total dead AGBM was
always significantly lower in the grazed treatment, presumably
due to the higher rate of transfer of standing dead plant material to litter or mulch and consumption of plant material by cattle.
With respect to biomass dynamics, the 0 to 15cm level of the canopy differed very little from the canopy as a whole (Table 2). AGBM in the 0 to 15-cm level constituted an average (for the growing season) of 43% of total live and 83% of total dead ungrazed biomass, and 60% of total live and 89% of total dead grazed biomass.
Live material in the 30 to 40-cm level of the canopy developed rapidly from May to July, when it peaked in both treatments (Table 2). There were no significant differences between treatments in the amount of live material in the 30 to 45-cm level. Unlike the 0 to 15cm level and the whole canopy, amounts of dead material in the 30 to 45-cm level were never as high as amounts of live material in either
treatment during the sample period. The amount of standing dead in the 30 to 45-cm level was significantly higher in the ungrazed treatment in May, August, September, and October. The average percentages of biomass during the growing season, contained in the 30 to 45-cm level were low: ungrazed live, 0.013%; ungrazed dead, 0.004%; grazed live, 0.011%; grazed dead, 0.003%.
Cover repetition
From May to June there was a rapid increase in live cover repetition (CR) of all categories in both treatments (Table 3). Cover repetition values for little bluestem, tall dropseed, the 0.15~cm and 30 to 45-cm levels, and totals are listed separately and values given for little bluestem and tall dropseed include only totals for those species, while values for the 0 to 15-cm and 30 to 45-cm intervals and totals include totals for all species in those categories. Ungrazed live cover repetition of little bluestem and the 30 to 45-cm level began to decrease after July, 1 month before other categories began to decrease. Grazed live cover repetition increased from June until Septem- ber in the 0 to 15-cm and 30 to 45-cm levels, as well as in the total, but decreased in little bluestem and tall dropseed.
Differences between treatments in cover repetition of live
Table 3. Average cover repetition (hits/pin) of little bluestem, tall dropseed, and total canopy throughout the sample period.’
Biomass Little bluestem Tall dropseed O-15 cm 30-45 cm Total
Month status Ungrazed Grazed Ungrazed Grazed Ungrazed Grazed Ungrazed Grazed Ungrazed Grazed
May Live 0.2 0.2 0.0 0.1 0.3 0.7** 0.0 0.0 2.0 3.4*
Dead 4.2 1.1* 0.0 0.0 3.7 1.5** 0.4 o.o* 11.9 5.4
June Live 3.0 1.8* 0.0 1.0* 0.5 1.0** 1.41 1.1 10.8 8.5
Dead 5.3 1.4** 0.0 0.3” 3.6 2.0* 0.1 0.1 29.6 7.7**
July Live 3.65 2.3** 0.0 1.3** 0.5 0.7 1.4 1.4 10.9 9.8
Dead 7.5 4.2** 0.2 1.3 5.4 3.7 0.6 0.6 35.7 15.0**
August Live 3.2 1.5** 0.5 1.2 0.6 1.0 1.1 0.7 11.5 24.2
Dead 7.3 2.9** 0.6 1.1 4.8 2.9** 1.3 1.0 8.5 14.8
September Live 2.0 1.4 0.3 1.7 0.5 1.5 0.9 0.7 6.9 10.1
Dead 8.0 2.8** 0.2 2.4 4.5 3.9 1.4 1.2 23.7 18.1
October Live 0.7 0.9 0.1 0.6 0.2 1.5** 0.4 0.3 3.7 6.7*
Dead 11.4 2.9** 0.4 1.4 5.6 3.8** 1.7 1.0* 34.6 17.2*
’ Significant difference between treatments: ** = P < 0.01, * = P < 0.05.
Table 4. Correlation coefficients of aboveground biomass with cover repetition (CR), Leaf Area Index (LAI), and actual leaf area (ALA).’
Ungrazed live Ungrazed dead Grazed live Grazed dead
Biomass CR LA1 ALA CR LA1 ALA CR LA1 ALA CR LA1 ALA
Total 0.84** 0.60** 0.69”” 0.3” 0.10 0.60* 0.83** 0.36** 0.78** 0.75 ** 0.49** 0.64*
O-15 cm 0.34* 0.03 0.20 0.26 0.14 0.06 0.06 0.10 0.39 0.35 * 0.43** 0.52”
30-45 cm 0.69”” 0.50** 0.87** 0.61** 0.54** 0.72** 0.63** 0.41** 0.83** 0.31** 0.30** 0.30 Little bluestem 0.61** 0.58” - 0.16 0.13 - 0.49** 0.33** - 0.48** 0.44” -
Tall dropseed 0.05 0.60** - 0.06 0.10 0.49** 0.36** - 0.29* 0.49* -
’ Levels of significance: ** = P < 0.01, * = P < 0.05.
material were most obvious in the 0 to 15-cm level, where there was always higher cover repetition in the grazed treatment. Little bluestem and tall dropseed differed signifi- cantly between treatments in June, July, and August samples, with cover repetition of little bluestem being higher in the grazed treatment.
Decreases in cover repetition of dead material during the growing season indicated transfers of material from the standing dead to the litter, caused by death and subsequent rain or wind storms. In the grazed treatment cover repetition of dead material increased in all categories until July, probably due in part to the death of cool-season grasses which are in greater abundance in the grazed treatment. All categories showed a net increase in cover repetition from July until October.
Because cover repetition is an indication of relative foliage density, it should be of some predictive value for AGBM. Calculation of correlation coefficients (Table 4) reveals this to be true in some cases. Both total cover repetition and 30 to 45cm cover repetition and total and 30 to 45-cm AGBM were significantly correlated in both live and standing dead com- ponents in both treatments. Although the 0 to 15cm level contained most of the biomass, there was significant correla- tion of 0 to 15-cm cover repetition and biomass values only for ungrazed live and grazed dead material. The number of contacts per pin, especially of dead material, in the O-15 cm level was usually quite high, making contacts difficult to count accurately. Sampling error was undoubtedly greater in this height increment, and may be related to the lack of correlation between cover repetition and biomass in the O-15 cm level and the lack of correlation between little bluestem dead cover repetition and total biomass (biomass was not evaluated for each species in this study) in the ungrazed treatment.
However, cover repetition of little bluestem, the most impor- tant species in percent composition of biomass (Risser, l971a), correlated well with total ungrazed live, grazed dead, and grazed live biomass. Tall dropseed cover repetition was significantly correlated with total live and dead biomass in the grazed treatment, but not in the ungrazed treatment. Although tall dropseed was not the most important grazed treatment species by percent biomass composition, it was far more important in the grazed treatment than in the ungrazed treatment (Risser, 1971a). It seems possible then, that cover repetition would give a reasonably good prediction of biomass dynamics in selected cases (Table 4).
Leaf Area Index
In both treatments total live leaf area index (LAI) (Table 5) peaked in June and showed a net increase from May through August. Between June and July live LA1 in the ungrazed treatment began to decrease and continued to do so until October, whereas in the grazed treatment, live LA1 changed little until it decreased between September and October samples. Live LA1 was higher in the grazed treatment in May and October, but in June, July, and August live LA1 was higher in the ungrazed treatment.
Knight (1971) found that ungrazed live LA1 on a shortgrass prairie in Colorado peaked in June at about 0.55, and then decreased to about 0.25 in August. Knight’s LA1 values were considerably lower than those of the tall-grass prairie, but biomass values were also higher in the tall-grass prairie than in the short-grass prairie (Sims and Singh, 1971). LA1 in the short-grass prairie decreased by half (0.55 to 0.26) from June to August, while in this study there was a decrease of only about 7% (3.09 to 2.88) from June to August, indicating that the rate of browning was higher in ungrazed short-grass prairie
Table 5. Leaf Area Index (cm’ /cm2) of little bluestem, tall dropseed, and total canopy throughout the sample period.’
Month
Biomass status
Little bluestem Tall dropseed
Ungrazed Grazed Ungrazed Grazed
O-15 cm
Ungrazed Grazed
30-45 cm
Ungrazed Grazed
Total
Ungrazed Grazed
May
June
July
August
September
October
Live
Dead
Live Dead
Live Dead
Live Dead
Live Dead
Live Dead
0.18 0.2 3.3 0.8**
3.0 1.8* 4.6 1.2””
2.8 1.6* 5.0 3.0**
2.1 1.4** 4.7 2.3*
1.7 1 .o* 6.0 2.2**
0.7 0.6 7.7 2.6”
0.0 0.0
0.0 0.0
0.1 0.2
0.3 0.4
0.2 0.3
0.1 0.4
0.1 0.3 0.7** 0.0 0.0 0.4 0.9**
0.1 2.1 1.1 0.1 0.0” 3.7 1.4””
0.9”” 0.4 0.9** 1.1 1.0 3.1 2.9
0.2” 3.9 1.7** 0.1 0.0 4.7 2.1**
0.7”” 0.2 0.5 ** 1.1 0.8 2.9 2.6
0.8 3.5 2.8 0.5 0.3 5.1 4.1
1 .o* 0.4 0.8” 0.9 0.5 2.9 2.8
1.1” 4.1 2.3** 0.8 0.7 6.8 4.8*
0.7* 0.4 1.9” 0.5 0.5 2.2 2.8
1.1 3.5 3.1 1.0 0.9 6.7 5.4
0.5 0.2 1.2”” 0.3 0.3 1.1 2.1”
1.2 4.6 3.3** 1.1 0.8 8.4 5.8**
’ Significant difference between treatments: ** = P < 0.01, * = P < 0.05.
than in ungrazed tall-grass prairie. The same generalizations may be made about grazed treatments.
Dead LA1 showed a continuous net increase from May to October in both treatments (Table 5) and dead LA1 was always higher in the ungrazed treatment. Knight (1971) found that dead LA1 of blue grama (Bouteloua gracilis), the most important species by percent composition of biomass, showed a continuous increase in both ungrazed and grazed (light, moderate, and heavy) treatments of short-grass prairie, but the rate of transfer of material to litter in grazed treatments exceeded browning between June and July samples. At the end of the sampling period, dead blue grama LA1 was highest in the heavily grazed treatment, but ungrazed dead LA1 was higher than both moderately and lightly grazed treatments.
between June and August, actual leaf area changed very little. In the grazed treatment 0 to 15-cm live leaf area increased from May to July, dropped until September, and increased in October. Although the values fluctuated over the growing season, 0 to 15-cm live leaf area, as measured by both methods, did not increase much, if at all, over the level it reached during the most rapid period of growth, that is, from May to June. After this initial period of growth, live leaf area in the lowest part of the canopy remained fairly stable, decreasing slightly in the ungrazed treatment and increasing slightly in the grazed treatment at the end of the growing season.
The behavior of LA1 in the 0 to 15-cm level (Table 5) was similar to the behavior of LA1 in the entire canopy, except that live LA1 in the 0 to 15-cm level was always significantly higher in the grazed treatment. Total live LA1 was higher in the grazed treatment.
Little bluestem live LA1 peaked in June, and then decreased continuously until October in both treatments. Except in May little bluestem live LA1 was higher in the ungrazed treatment. Dead LA1 of little bluestem showed a net increase over the growing season in both treatments.
Both live and dead tall dropseed LA1 were higher in the grazed treatment on all sampling dates. Except for this difference, patterns of peaking and fluctuation of tall dropseed LA1 were the same as those of total LA1 and LA1 in the 0 to 1 S-cm level.
In the 30 to 45cm level LA1 and AGBM were significantly correlated in ungrazed live, ungrazed dead, grazed live, and grazed dead categories (Table 4). Total LA1 and LA1 of little bluestem and tall dropseed were significantly correlated with total AGBM in the ungrazed live, grazed live, and grazed dead categories, but not in ungrazed dead. The 0 to 15-cm level correlated significantly with 0 to 15-cm AGBM only for grazed live material. LA1 is a good predictor of AGBM, but, like cover repetition, it also must be selectively used as an indicator of biomass dynamics (Table 4).
The two methods (LA1 and actual leaf area) used to obtain leaf area did not correspond well with respect to the actual numbers obtained (Tables 5 and 6). Values obtained with the LA1 method, particularly those for dead LAI, were higher than those obtained with the photoelectric planimeter. However, leaf area, measured by either method, tended to exhibit the same trends of peaking and increase or decrease. At present it is unclear exactly why the numerical vaues for LA1 and actual leaf area were not more similar, but there are some possible explanations. In using the photoelectric planimeter to deter- mine leaf area, leaf angle does not influence the values obtained, as it does in the LA1 method. Coefficients of correlation between LA1 and actual leaf area were calculated to determine the degree of similarity between values obtained by both methods. Correlation between total values and values in the 0 to 15-cm level was negative or very poor. Because the LA1 method is more efficient in terms of time and effort, it would probably be the most expedient way to evaluate the dynamics of total live area in both treatments and total leaf area in the grazed treatment, where correlation with AGBM was good, but not of dead leaf area in the ungrazed treatment (Table 4).
Actual live leaf area in the entire canopy of the ungrazed treatment peaked in August, whereas, in the grazed treatment, the peak occurred in July (Table 6). Total dead actual leaf area in the ungrazed treatment showed a net increase during the growing season until September, and then decreased in October.
Actual live leaf area in the ungrazed 0 to 15-cm level increased from May to June (Table 6). After some fluctuation
Actual leaf area showed reasonably good correlation with AGBM in all the categories considered. Total actual leaf area was the best predictor of ungrazed dead biomass. Like cover repetition and LA1 in the 0 to 15-cm level, actual leaf area in this part of the canaopy did not correlate well with AGBM in the ungrazed treatment. However, there was significant cor- relation between both live and dead grazed AGBM, while cover repetition in the 0 to 15-cm level showed significant correla- tion only with grazed dead AGBM. In the 30 to 45-cm level, correlation of actual leaf area and AGBM was good except in the grazed dead material. In this respect cover repetition and LA1 were better predictors of AGBM because they correlated
Table 6. Actual leaf area (cm’ /cm2 ) as measured from samples collected throughout the sample period.
Month
May
June
July
August
September
October
Biomass status
Live Dead
Live Dead
Live Dead
Live Dead
Live Dead
Live Dead
O-15 cm 30-45 cm Total canopy
Ungrazed Grazed Ungrazed Grazed Ungrazed Grazed
0.2 0.4 0.0 0.0 0.2 0.5
1.0 0.3 0.0 0.0 1.1 0.5
0.4 0.5 0.1 0.2 1.2 1.3
1.2 0.5 0.0 0.0 1.3 0.6
0.2 0.5 0.3 0.4 0.9 1.4
0.9 0.6 0.1 0.0 1.3 0.8
0.4 0.4 0.3 0.2 1.3 1.0
1.1 0.4 0.2 0.0 1.7 0.6
0.4 0.3 0.2 0.1 0.9 0.7
0.9 0.7 0.1 0.0 1.6 1.0
0.5 0.5 0.1 0.0 0.8 0.7
1.1 0.6 0.2 0.0 1.8 0.7
well with 30 to 45-cm live and dead AGBM in both treatments (Table 4).
Conclusions
In this study vegetation structure in a tall-grass prairie is described and some measures of structure (i.e., cover repeti- tion and leaf area) were shown to be good predictors of biomass dynamics in the entire canopy, as well as in selected canopy levels or individual species.
Although the effects of vegetation structure on ecosystem function are not thoroughly understood, it is clear from this work and previous studies (Knight, 1969; Risser, 1971 b) that structure is an important flux modifier in the ecosystem. LA1 in particular was shown to be an important determinant of productivity in crops and pastures (Watson, 1958) because of its influence on light interception and, consequently, photo- synthesis (Warren-Wilson, 1965). In ‘addition, periodic measurements of LA1 during the growing season provide, in themselves, a measure of productivity, in that they indicate the rate of leaf growth and leaf area over the ground surface. Studies of vegetation structure should provide an additional basis for understanding the different adaptation strategies of grassland communities and their response to manipulations such as grazing.
Literature Cited
Forsling, C. L. 1931. A study of the influence of herbaceous plant cover on surface runoff and soil erosion in relation to grazing on the Wasatch Plateau in Utah. U. S. Dep. Agr. Tech. Bull. 220 71~.
Greig-Smith, P. 1964. Quantitative plant ecology. Butterworth and Co., London. 256~.
Knight, D. H. 1969. Some influences of vegetation structure on energy and nutrient flux in grassland ecosystems p. 197 to 220, In: R. L.
Dix and R. G. Beidleman (ed.) The grassland ecosystem: A.
preliminary synthesis. Range Sci. Dep. Sci. Ser. No. 2. Colorado State Univ., Fort Collins.
Knight, D. H. 1971. Some measurements of vegetation structure on the Pawnee Grassland, 1970. US IBP Grassland Biome Tech. Rep. No. 72. Colorado State Univ., Fort Collins.
Risser, P . G. 1971a. OSAGE Site, 1970 report, primary production. U.S. IBP Grassland Biome Tech. Rep. No. 70 Colorado State Univ., Fort Collins.
Risser, P. G. 1971b. Plant community structure, p. 41 to 58, In: N. R. French (ed.) Preliminary analysis of structure and function in grasslands. Range. Sci. Dep. Ser. No. 10. Colorado State Univ., Fort Collins.
Sims, P. L., and J. S. Sin& 1971. Herbage dynamics and net primary
production in certain ungrazed and grazed grasslands in North
America, p. 59 to 124, In: N. R. French (ed.) Preliminary analysis of structure and function in grasslands. Range Sci. Dep. Sci. Ser. No. 10 Colorado State Univ., Fort Collins.
Steiger, T. L. 1930. Structure of prairie vegetation. Ecology
11:170-217.
Van Wijk, W. R., and J. Goedkoop. 1963. Turbulent heat exchange in the air in a vegetative cover. Soil Sci. 96:99-104.
Warren-Wilson, J. 1963a. Estimation of foliage denseness and foliage angle by inclined point quadrats. Aust. J. Bot. 11:95-105.
Warren-Wilson, J. 1963b. Errors resulting from thickness of point
quadrats. Aust. J. Bot. 11: 178-188.
Warren-Wilson, J. 1965. Stand structure and light interception. I.
Analysis of point quadrats. J. Appl. Ecol. 2:383-390.
Watson, D. J. 1968. The dependence of net assimilation rate on leaf area index. Ann bot., London (N.S.) 22:37-54.
Infiltration for
Three
Rangeland
Soil-Vegetation
Complexes
J. M. TROMBLE, K. G. RENARD, AND A. P. THATCHER
Highlight: A rotating disk rainfall simulator was used to examine infiltration-runoff
relations from selected rangeland sites as influenced by a soil-vegetation complex. The
simulator assisted in quantifying infiltration rates for different management practices Morin (1967, 1970) was used to examine on different soil types. Infiltration was greater for brush dominated plots than for infiltration-runoff relations as influenced either grazed plots or grass plots without grazing. Antecedent soil moisture decreased by the soil-vegetation complex of three infiltration rates. Crown cover was approximately twice as much on brush plots as on rangeland sites (typical) of southeastern
grass plots and significantly influenced infiltration. Arizona.
Authors are hydrologist and research hy-
draulic engineer, Southwest Watershed Research Center, Tucson, Arizona, and range conserva- tionist, Soil Conservation Service, Phoenix, Arizona.
The paper was presented at the 25th Annual Meeting of the Society for Range Management, February 4-l 1, 1972, Washington, D.C.
The study is a contribution of the Agricul- tural Research Service, Soil, Water, and Air Sciences, Western Region, and the Soil Conserv.
Serv., Arizona Section, U.S. Department of
Agriculture, in cooperation with the Arizona Agricultural Experiment Station, Tucson.
The authors express their appreciation for the active interest and participation of C. B. England, soil scientist, Hydrograph Laboratory, Agr. Res. Serv., U.S. Dep. Agr.; and of Vern Hugie, soil scientist, R. E. Rallison, chief, Hy-
drology Branch, and Milo James, state soil
scientist, Soil Conserv. Serv.
Manuscript received February 2 8, 197 3.
318
Soils and vegetation are important parameters in hydrologic models when determining runoff produced by a given rainfall event. However, numerical values of the parameters necessary to quantify the role of the soil and vegetation are difficult to obtain from watershed input- output data because of spatial variability. The watershed response to a given precip- itation may be estimated by examining microunits within the watershed. Use of infiltrometers and simulated rainfall on microunits is one of the most convenient methods to evaluate these parameters.
A rainfall simulator developed by
Studv Area and Procedure
Three soil-vegetation complexes com- mon to the semiarid Southwest were selected on the Walnut Gulch Experi- mental Watershed in southeastern Ari- zona, first, to quantify differences in infiltration and runoff encountered on three major rangeland soils with brush, grass, or no vegetation, and second, to examine infiltration variability en- countered on different hydrologic soil groups in the Soil Conservation Service runoff model (Soil Conserv. Serv., 1969). The hydrologic soil groups represented were characterized as having final con- stant infiltration rates (f,) of (Musgrave,
1955):