Beam and target optimization for energy production
in accelerator driven systems
MihaelaParaipan1,2,∗,Anton A.Baldin1,3,Elina G.Baldina1,3, andSerguey I.Tyutyunikov1
1Joint Institute of Nuclear Research, Dubna, Russia 2Institute of Space Science, Bucharest-Magurele, Romania 3Institute for Advanced Studies "OMEGA", Dubna, Russia
Abstract.The new concept of light nuclear beams instead of proton beams for ADS is substantiated. The influence of the target structure on the energy ef-ficiency of 0.5-4 GeV proton beams and 0.25 – 0.5 AGeV light ion beams is studied. The target consists of rods with different composition (metal, oxide, carbide) and different levels of enrichment in order to implement the target with a criticality coefficient of 0.96 -0.97, which ensures safe operation. The cool-ing with different metals (lead, lead-bismuth eutectic - LBE, and sodium) is compared. The use of converters from very light materials (lithium, beryllium, carbon) and their influence on the neutron spectrum and energy released are analysed.
1 Introduction
An accelerator driven system (ADS) presents some advantages in comparison with a classical nuclear reactor such as safer exploitation, higher level of burning of minor actinides, and the transmutation of long lived isotopes. The design of an ADS must retain these advantages and maximize the energy efficiency. In the previous works the authors demonstrated that light ion beams have a superior energy efficiency for ADS as compared to protons [1, 2]. These conclusions were obtained in quasi-infinite natural and enriched uranium targets. In the present paper targets with more realistic structure are analysed.
2 Method
The energy efficiency of a beam is characterized by the gain factor G defined as the ratio of the electrical power produced in the irradiated targetPprod to the power spent to accelerate
the beamPspent.
The power produced depends on the energy released in the target per incident projectile Edep, beam intensityIbeam, and conversion coefficient from thermal to electrical powerηel:
Pprod= Edep·Ibeam·ηel. (1)
The energy released in the target was calculated via simulation with the code Geant4 [3]. The reliability of the predictions obtained with Geant4 was verified using experimental data
on neutron yield from thin and thick metallic targets [4], and the conclusion was made that one can relay on the results of the simulations within 25%. Standard electromagnetic models were used to model the electromagnetic interaction. The inelastic interaction was simulated with the cascade models (Bertini cascade for hadrons and pions, binary cascade for ions). For neutrons with an energy below 20 MeV high precision neutron models, based on a detailed implementation of the experimental data from ENDF library were used. A value of 0.4 was used forηel.
The interaction of proton beams with an energy 0.5-4 GeV, and light ion beams (7Li,9Be, 12C) with an energy of 0.25 – 1 AGeV was simulated in targets with various geometries and
composition. The target is an assembly of fuel rods in a bath of coolant. Different types of uranium and thorium fuel were analysed: metallic alloy with Zr, oxide and carbide. The following parameters were varied: the radius r of the fuel rods (between 0.5-1 cm), the length L of the rods (between 100-150 cm), the distance d between rods (between 1-5 cm), the total radius R of the fuel assembly (between 70-90 cm). In each case the level of enrichment was properly chosen in order to implement a target with criticality coefficientke f f=0.96 -0.97.
Metals Pb, Pb-Bi eutectic (LBE) and Na were used as coolant. The influence of the target geometry and composition on the neutron spectrum and on the ratio between the energy released by different ions was studied.
The power spent to accelerate the beam was calculated with the method presented in detail in [2]. Here we make only a short description. Pspentincludes the power transmitted to the
beamPbeam(which depends on the ion mass number A, the final energy per nucleon E, and
the beam intensity) and the power necessary to maintain the functioning of the accelerator Pacc. For a linear accelerator this last term depends on the accelerator length and scales as
A·E/Z where Z is the atomic number of the ion. In this way ifPspent0and the accelerator efficiencyη0 for a reference particle (atomic numberZ0, mass numberA0, final energy per nucleonE0) are known one can calculate the power spent for another particle. Assuming the same beam intensity the one gets:
Pspent= Pbeam+ Pacc=A·E0·Ibeam+
A·Z0·E A0·Z·E0
Pspent0(1−η0). (2)
Proton with energy 1.5 GeV (energy at which protons accelerated in a linac have the maximum energetic efficiency [1]) was used as reference particle. A value of 0.18 for the total accelerator efficiency for the reference particle was considered. Such high value is not achieved yet, still is planned to be realized at European Spallation Source (ESS) project. The value used for the beam intensity was 1.25·1016.
3 Results and discussion
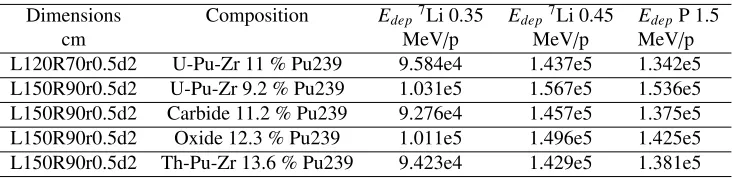
The variations in the target geometry and fuel composition do not modify the shape of the neutron spectrum and preserve the ratio between the energy deposited by different ions. Some values for the energy deposited per incident particle for beams of7Li with energy 0.35 and 0.45 AGeV, and protons with energy 1.5 GeV are presented in Tab. 1.
The metallic coolant does not modify the shape of the neutron spectrum either. The energy released obtained with 0.35 AGeV7Li and 1.5 GeV proton beams in U target cooled with Pb, LBE, and Na are given in Tab. 2. The ratio between the energy released realized with 7Li and proton is preserved. It should be pointed out that Pb or LBE act as better reflectors for
Table 1.The energy released per incident projectile for different target geometries and compositions. The projectile energy is given in AGeV
Dimensions Composition Edep7Li 0.35 Edep7Li 0.45 EdepP 1.5
cm MeV/p MeV/p MeV/p
L120R70r0.5d2 U-Pu-Zr 11 % Pu239 9.584e4 1.437e5 1.342e5
L150R90r0.5d2 U-Pu-Zr 9.2 % Pu239 1.031e5 1.567e5 1.536e5 L150R90r0.5d2 Carbide 11.2 % Pu239 9.276e4 1.457e5 1.375e5
L150R90r0.5d2 Oxide 12.3 % Pu239 1.011e5 1.496e5 1.425e5
L150R90r0.5d2 Th-Pu-Zr 13.6 % Pu239 9.423e4 1.429e5 1.381e5
Table 2.The energy released per incident projectile in U target 14.7% U235 irradiated with 0.35
AGeV7Li and 1.5 GeV proton beams for Pb, LBE and Na coolants
Projectile LBE Pb Na Na+20.5% U235
7Li 1.212e5 1.179e5 2.728e4 1.2289e5
proton 1.948e5 1.848e5 4.561e4 1.814e5
Table 3.The net power production and the energy gain for proton and light ion beams in U target with
ke f f0.97 and converters from LBE and Be
LBE Be
Projectile Energy Net power G Net power G
AGeV MW MW
p 1.5 127 8.1 193.3 11.7
7Li 0.3 62.2 6.5 174.3 16.6
0.35 87.2 7.7 227.6 18.4
0.4 113.8 8.6 295 20.7
9Be 0.3 51.4 5.3 175.7 15.5
0.35 77 6.4 241 18
0.4 105.1 7.5 306.1 19.9
12C 0.75 389.7 12.8 847.2 26.7
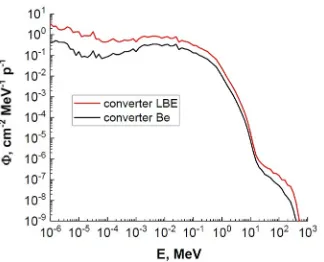
The shape of the neutron spectrum is influenced by the material used for the converter. Converters from light materials as Li, Be,or C are useful especially when the target is irra-diated with light ion beams with low energy. The energy released increases 1.4 - 3 times. The best results are obtained with Be converter. Two effects contribute to the increase of the energy deposited in the target. On the one hand, materials with low mass number slow the neutrons and determine an increase of the low energy tail in the neutron spectrum. This effect appears for all projectiles and explains the growth of the deposited energy even with proton beams. The effect is more pronounced in targets with high level of enrichment. On the other hand the use of low Z materials produces a significant increase of the range for low energy light ions. As a consequence, the probability to interact inelastically at higher energies increases, and the result is an increased yield of high energy neutrons. The effect of converters on the neutron spectrum is exemplified in Fig. 1. The neutron spectra in targets with converters from LBE and Be irradiated with a beam of7Li with energy 0.35 AGeV are presented.
The comparison between the net power production and the energy gain realized with protons and light ion beams in U target withke f f=0.97 is given in Tab. 3. The results are
Figure 1.The neutron spectrum in enriched U-Pu target with LBE and Be converters irradiated with 0.35 AGeV7Li beam
GeV. In the case of a target with converter LBE irradiated with beams of7Li or9Be with an energy of 0.4 AGeV one gets almost the same net power production as with 1.5 GeV proton beam, but with significantly higher energy gain G. For Be converter7Li or9Be beams with an energy of 0.35 AGeV become equivalent to 1.5 GeV proton beams from the point of view of the net power produced. Another important factor is that the acceleration of7Li or9Be at energies 0.35-0.4 AGeV requires accelerators with lower dimensions. We note also, that a 12C beam with an energy of 0.75 AGeV requires an accelerator with the same length as 1.5
GeV protons, but produces 3-4 times higher net power.
One has apparently a large liberty in the choice of the target material and geometry. The choice of the optimal configuration, however, must preserve the main advantages of ADS: safe exploitation and deep level of burning of minor actinides. A safe exploitation is ensured ifke f f is maintained below 0.99 during the irradiation. The evolution in time of the number
of fissions after stopping the beam is presented in the right side of the Fig. 2 for three values ofke f f 0.95,0.97, and 0.986. Forke f f below 0.99, the number of fissions decreases by more
than 10 times in the first 100 ns from the moment at which the beam is stopped. Such quick response eliminates the risk of an accident. Until now, only the situation at the beginning of the irradiation was analysed. During the irradiation the target composition andke f f change.
For the study of the evolution, the target was divided in zones with more or less equal fluence and the change in its composition was calculated for each zone. A schematic representation of the target divided in zones is shown in the left-hand side of Fig. 2. The evolution of the composition depends on the initial level of enrichment. We exemplify for two U-Pu targets with initial value ofke f f=0.97. The first target with lower dimensions has the initial level of
enrichment 11%239Pu. The second has higher dimensions and an enrichment of 9.2%239Pu. The time dependence of the concentration of238U and239Pu in the central part of the target (zone0 in Fig. 2) is presented in Fig. 3. The central part was chosen because there the largest variations are registered. At refuelling time, rods from this zone must be replaced. We choose the moment when the energy released in the target decreases with 30% from the initial value as the criterion for refuelling . These moments are shown by vertical lines in the figure. The target was irradiated with a beam of7Li with energy 0.35 AGeV and intensity 1.25·1016.
In the case of the target with enrichment 11%239Pu the concentration of239Pu continu-ously decreases in time. The energy deposited andke f f slowly decrease, also. Such target
does not need control rods during operation. It needs to be refuelled after 900 days. By the moment of refuelling, 7.7% from the initial mass of actinides was burned in the zone 0, and 4% in the zone 3. The concentration of239Pu in the second target has a different evolution: a period of build-up when theke f f rises, followed by a slower decrease. This target needs the
Figure 2.The scheme of the target (left), and the evolution in time of the number of fission when the beam is stopped,in targets with differentke f f(right)
Figure 3. The time dependence of the concentration of238U (left), and239Pu (right) in targets with
enrichment 9.2%239Pu and 11%239Pu irradiated with 0.35AGeV7Li beam with an intensity of 1.25· 1016
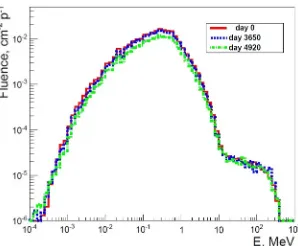
Figure 4.The neutron spectrum in
the central part of the target at different periods of irradiation for a target with 9.2%239Pu irradiated with 0.35 AGeV7Li beam with an intensity of 1.25·1016
in the Fig. 4 where the neutron fluence in zone 0 is shown at the beginning of the irradia-tion, after 10 years, and in the moment of refuelling. For the second target the refuelling is necessary after∼5000 days. At this moment 23.4% from the initial mass of actinides was burned in zone 0, and 11.2% in zone 3. If a target with 8.9%239Pu is used, the mass of the actinides burned in the central region reaches 30%. It is preferable to use a target with lower enrichment which ensures a higher level of fuel burning. The variation ofke f f in time is slow,
and it does not present any difficulty to control and keep it at safe level.
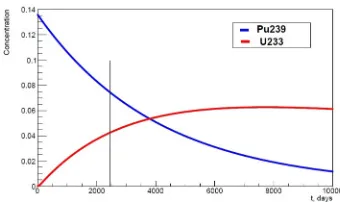
Figure 5.The time dependence of the concentration of239Pu and 233U,in Th-Pu target with
13.6%239Pu, irradiated with a beam of7Li with energy 0.35 AGeV and intensity 1.25·1016
forke f f=0.97 an U-Pu target needs 9.2%239Pu, while a Th-Pu target requires 13.6%239Pu.
During irradiation, the decrease in the239Pu concentration is partially compensated by the accumulation of233U. The difference in the mean values for fission cross section of233U and 239Pu, which are 2.38 b and 1.66 b, respectively,contributes to the compensation. The time
dependence of the concentration for these two isotopes is presented in Fig. 5. The considered beam was7Li with an energy of 0.35 AGeV and an intensity of 1.25·1016. The moment of refuelling is shown by vertical line. We remark that the period is about one half of the corresponding period for U-Pu target.
4 Conclusions
Light ion beams7Li and9Be with energies above 0.3 AGeV, or12C with an energy higher than 0.5 AGeV demonstrate a superior energy efficiency for energy production in ADS, as compared to protons. The effect is present in both U and Th targets. The fuel composition and target geometry do not influence the ratio between the energy released by different ions, keeping unchanged the shape of the neutron spectrum. Converters from very light materials, in particular Be increase the energy released. The effect is more pronounced for light ions with low energy. Targets with higher dimensions and lower enrichment are preferable because they ensure large periods between refuelling and an increased burning of actinides. Thorium targets need higher enrichment, as compared to U targets with the same geometry and the sameke f f. The period for refuelling is shorter for Th targets.
References
[1] A. A. Baldin, A. I. Berlev, M. Paraipan, S. I. Tyutyunikov, Phys. Part. Nucl. Lett.14, 113-119 (2017)
[2] A. A. Baldin, E. G. Baldina, M. Paraipan, S. I. Tyutyunikov, Ann. Nucl. En.110, 973-978 (2017)
[3] S. Agostinelli et al., Nucl. Instrum. Methods A.506, 250–303 (2003)