1
Noise Levels in a Medical Intensive Care Unit
Jinyi He1, Hong Li2, Xiaohuan Chen2, Shuang Jin2, Meirong Chen2, Lan Shi3,Fenghua Su4
1.The Fourth Department of Critical Care Medicine,2.Nursing Department,3.The Second Department of Critical Care Medicine,4.Department of Nursing, Fujian Provincial Hospital, Fuzhou 350001, China
Abstract: This study was undertaken to investigate and analyze noise pollution in a large Chinese governmental hospital’s medical intensive care unit and compare to the WHO guidelines.This cross-sectional study was conducted in a MICU at a public governmental teaching hospital in Fujian province between July and August of 2017. A WENSN® WS1361 Integrated Sound Level Meter (China) was used for continuous every five seconds one week noise levels recording. After this measurement, the decibel meter was used for recording different location of isolation rooms and open bays, including occupied and unoccupied patient, and recording sound events occurs in the ICU to identify sources of noise. Peak and average noise levels were obtained from the meter, and data were downloaded from the WS1361 into a laptop computer. The measured mean equivalent sound pressure levels (L) and standard Aeq deviation over one week period were 66.64
±7.57 dB(A), with acute spikes reaching 119.7 dB(A), the average sound level for a 24 hour period in a work day was 68.03±5.07 dB(A). These are higher than the current daytime environmental noise limit of 40-45 decibels in China and WHO. Mean work day noise was significantly louder than weekend time, there was a significant difference in work days and weekend (t=16.85;P=0.000).There was a statistical difference between the day time and night time shifts (t=34.67;P=0.000). The isolation rooms were significantly quieter than the open-bay rooms(t=46.15; p=0.00), sound levels in the occupied and unoccupied rooms also had significant difference(t=17.26; P=0.000).Two types of noise resources, including twenty kinds sources were identified and measured, mean noise levels ranged from of 61.33 to 79.21 dB(A). This study shows noise levels in intensive care units were exceeded the recommended. The study of the influence of noise on patient and staff is needed, and noise reduction strategies must be conduct in ICU.
1.Introduction
In the past half century, the develop of science and technology have afforded medical
countless new equipment and machines that have allowed patients to undergo medical
procedures with improved outcomes[1,2]. However, these beneficial advances are were
accompanied by the corresponding noises that result from their use[3,4]. In addition, poor
design of hospital acoustic environment also contributes to increased noise[5,6].
Noise, defined as unwanted sounds, could affect people both psychologically and
physiologically[7].Noise also has been defined as an accidental sound wave without any
rhythm or harmony which can interfere with hearing[8]. To quantify sound levels, the decibel,
an arithmetically non-dimensional linear scale, defines measured sound pressure[9,10], in
which sound is measured as the force per unit area that sound waves produce. For sound
pressure measurement that closely resembles the normal curve for loudness frequency of the
human ear, the internationally agreed ‘A’ weighted filter is used[11].
A hospital intensive care unit (ICU) is designed to treat critically ill patients who need
special care and treatment, sometimes at nearly the same extreme level required in an
operating room[12,13]. ICUs contain many sources of noise, such as aspirators, monitors,
mechanical ventilators, computers, printers, air conditioning vents, and others[14]. The
adverse effects of elevated noise in hospitals have been documented in many researches, high
noise levels interfere with communication, leads to attention loss, irritability, fatigue,
headache, muscle contractures, increased heart rate and blood pressure, in addition to
worsened quality of sleep both in the healthcare professionals’ team and patients[15-19].
The improvement of technology has increased noise levels in Intensive Care Units, many
hospitals fail to meet the limits of noise guidelines recommend by the World Health
Organization. The assessment of noise and the impact of noise pollution have been
extensively studied in the developed countries, but there were not many studies about this in
China.
Noise generated in ICUs has increased in recent decades due to a substantial increase in
the number of devices with acoustic alarms, and background noise by actions and speaking of
healthcare professionals[14,20,21]. Many researches show that noise levels measured in ICU
60–70 dB (A), with peaks rising up to 80–120 dB (A)[2,20-27]. The World Health
Organization has drawn up guidelines for community noise management, the recommended
noise levels in hospital should be 35-40 dB(A) in the daytime and 30-40 dB(A) in the
evening[1,20,28,29]. According to the Emission Standard for Community Noise of China, the
background noise limit for a medical institution is 40-45 dB at daytime and 30-35 dB at
nighttime.
Due to the importance of noise pollution level in the ICU, the purpose of this study was
to measure noise level in an MICU, compare the results to recommended levels, identify
some sources of noise and to develop effective noise reduction strategies in the future.
2. Materials and Methods
2.1 Ethical
The hospital ethics committee approved the study. The patients and MICU staff were
informed about this study, no individuals were recruited for participation in the study and
patient care was not affected during the collection of data.
2.2 Study Design and Setting
This was a cross-sectional study. It is a quantitative, descriptive and exploratory study
using data collected in a MICU at a public governmental teaching hospital in Fujian province
between July and August of 2017. The hospital is located on the crossroads of main road in
the heart of Fuzhou municipal (province capital, 7,115,370 inhabitants), MICU is on the
hospital’s sixth floor and has a rectangular shape, including 15 open-bay rooms and 5 isolate
rooms, five of the rooms are contact isolation rooms with 3 walls and a automatic door,
whereas the other patient care bays are open bays with 2 walls and a curtain.
2.3 Instrument
The equipment used in this study included a portable computer equipped with the Sound
Level Meter software (provided with the device) and a sound level meter with a tripod.
The variable noise was measured using a WENSN ® WS1361 Integrated Sound Level
Meter (WENSN, Shenzhen, Guangdong) with scale A and scale C, and fast and slow two
channels, the readings are in Decibel, A-weighted (dBA) units representing the sound level
measured with the A-weighting network on the sound level meter. Officers from the Aural
WS1361. the WS1361 provided a direct reading of sound over the ranges of 30–130 dB(A),
with accuracy of±0.5 dB(A) at 25 degree centigrade. with an accuracy of less than ±1 dB(A)
over temperature ranges 0-50 C.
Scales A and C under fast mode were used to register the data because that speed makes
it possible to measure kinds of noise that do not oscillate rapidly. Scale A (dBA), is the
filtering method that simulates the receptive characteristics of the human ear and it is
recommended to capture continuous noise, mostly used for measuring environmental noise. A
common method used in the discussion of noise pollution is the equivalent continuous noise
level (Leq) expressed in dB(A), the other variables obtained were percentile level LN, such as
the L10and L90, the maximum and minimum noise levels recorded at the same measurement
period
2.4 Data Collection
The data were collected during 2015, according to the Emission standard for community
noise (China, 2008), the WS1361 equipment was placed at approximately a distance of 1 m
from the sound sources or 0.5 m from reflector, set up on a tripod and 1.2 m from the floor.
Utilizing this distance from the floor, the equipment was placed in the middle of the nursing
station and patient room and so on. The device was calibrated according to the manufacturer’s
instructions for standardization purposes before starting each measuring task.
Measurements were made in 4 phases, the noise level measurements did not, at any time,
interfere with the work of the staff. A major concern during the data-collection procedure was
to ensure that no bias existed while the measurements were being taken.
Phase 1 Implement pilot measurement to confirm the reliability and validity of the data
collected. With prior authorization from the hospital and department management, first day
was explained the purples of the research and where the measuring was taking place to the
staff including physician, nurse and other person in MICU. After that, the WS1361 equipment
with a tripod was continually placed in the middle of the nursing station started to pilot
measurement. Because of the direct measurement of noise levels within a clinical
environment meant there was the potential for staff influence the noise levels primarily
through the ‘Hawthorn effect’ inasmuch that individuals who are aware of their participation
reduce the possible influence hospital staff may have had on the noise levels being recorded
in their respective areas[14]. This phase constants one week, the data was discarded.
After one week pilot measurement, the staffs were familiar with the equipment and
researchers to continue with their routine activity. In phase 2, the ambient noise in the MICU
was measured. The sound levels meter placed at the same position of phase 1, without the
knowledge of the staffs when the measuring was started, the researcher who collected data
was in there sporadically as before. This phase constants one week, from Monday to Sunday,
the day shift (8:00 a.m. to 8:00 p.m.), versus night shift (8:00 p.m. to 8:00 a.m.) and work
days (Monday to Friday) versus weekend days (Saturday and Sunday) were considered in the
analysis.
Phase 3 was to make measurement in both occupied and unoccupied patient rooms in
different location of the unit.
In phase 4, measurements of different events or routine activities to identify sources of
noise in MICU were taken. Any specific events that were thought to contribute to excessive
noise were also to be measurement and documented.
Phase 3 and phase 4 were took place in day time (8 a.m. to 12 a.m. and 2 p.m. to 6 p.m.)
which recommend by the Emission standard for community noise (China, 2008). During the
measurement, at 24 hours intervals the device was connected to a computer with the Sound
Level Meter software that stored and read the data specifics. When the collection was
complete, the data were transferred to SPSS, for analysis.
2.5 Statistical Analysis
Descriptive results were given in frequencies and percentages. Continuous variables
were compared using the Student t test. If more than 2 variables were compared, a 1-way
analysis of variance (ANOVA) was used. Statistical significance was defined as a P
value<0.05. Data are shown as mean±SEM. All data analysis was performed using the
Statistical Package for the Social Sciences for Windows 19.0 (SPSS Inc., Chicago, IL, USA).
3 Result
During the study, the beds occupation rate in the MICU was 98%, similar to the same
period of last two years 99% and 97%, staffs present as usual and without any construction
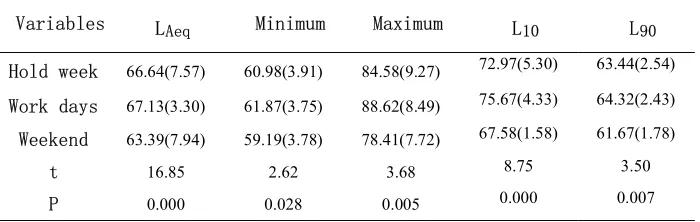
The measured mean equivalent sound pressure levels (L) and standard Aeq deviation
over one week period were 66.64±7.57 dB(A), with acute spikes reaching 119.7 dB(A), Mean
work day noise was significantly louder than weekend time, there was a difference in work
days and weekend(Table 1).
Table 1- Noise levels recorded by week time in MICU
Variables LAeq Minimum Maximum L10 L90
Hold week 66.64(7.57) 60.98(3.91) 84.58(9.27) 72.97(5.30) 63.44(2.54) Work days 67.13(3.30) 61.87(3.75) 88.62(8.49) 75.67(4.33) 64.32(2.43) Weekend 63.39(7.94) 59.19(3.78) 78.41(7.72) 67.58(1.58) 61.67(1.78)
t 16.85 2.62 3.68 8.75 3.50
P 0.000 0.028 0.005 0.000 0.007
Result express as mean(standard deviation)
The average overall sound level for a 24 hour period obtained in a work day during the
continuous weekly measurement was 68.03±5.07 dB(A).When comparisons were made
between nursing shifts (day and night), mean noise levels reported (t=34.67;P=0.000) were
found to be statistically significant differences(Table 2).
Table 2- Noise levels recorded by nursing shift in MICU
Variables LAeq Minimum Maximum L10 L90
Hold day 68.03(5.07) 61.99(2.35) 81.96(9.11) 72.96(5.51) 66.23(3.55) Day 70.25(4.91) 62.59(2.52) 88.66(4.02) 76.74(3.28) 67.83(3.19) Night 65.80(4.16) 61.39(2.04) 75.60(8.45) 69.19(4.63) 64.62(3.20)
t 34.67 2.55 7.60 6.98 4.17
P 0.000 0.018 0.000 0.000 0.000
Result express as mean(standard deviation)
Noise levels were variety in different location of the department, dataset recorded in
bedside showed that room near nursing station had higher mean noise levels than those far
from it, the distribution of the noise levels measured in different location are given on Table 3.
Mean noise levels in isolation rooms was significantly different(t=46.15; p=0.00) with the
open-bay layout rooms(Table 4), the results also showed that the sound levels in the occupied
and unoccupied rooms had significant difference(t=17.26; P=0.000).
To determine the dominant noise sources, the magnitude and frequency of noise sources
alarm and human vocalization (Table 5).
Table 3- Noise levels in different locations of MICU
Locations Mean SD Minimum Maximum Confidence limit (99%)
Bed 1 67.30 4.70 59.1 83.7 66.44-68.16 Bed 2 64.01 3.56 58 82.9 63.35-64.66 Bed 3 63.03 4.13 56.1 89.1 62.27-63.79 Bed 4 69.25 4.89 60.5 87.3 68.35-70.15 Bed 5 66.73 3.52 60.9 91.1 66.09-67.38 Bed 6 67.11 3.54 60.7 79.6 66.46-67.77 Bed 7 66.24 6.26 59.2 90.9 65.09-67.39 Bed 8 64.74 3.70 58.8 76.2 64.06-65.42 Bed 9 65.94 3.82 60.1 87.6 65.23-66.64 Bed 10 66.19 5.57 58.4 92.1 65.17-67.22 Bed 11 61.31 3.46 56.5 86.9 60.67-61.94 Bed 12 66.23 5.01 58.3 90.2 65.30-67.15 Bed 13 64.51 3.52 58.6 89.6 63.86-65.15 Bed 14 66.19 3.90 59.7 82.9 65.48-66.91 Bed 15 69.36 3.87 62.5 87.8 68.65-70.07 Bed 16 58.76 2.14 55.2 66.3 58.34-59.16 Bed 17 63.49 2.68 58 78.8 63.00-63.99 Bed 18 57.69 3.64 51.8 66.4 57.01-58.35 Bed 19 58.07 6.74 51.7 97.8 56.65-59.49 Bed 20 56.33 2.96 53.2 77.1 55.78-56.87
Table 4 Noise levels recorded by room type and occupation
Locations Mean(SD) t P
Room type(Unoccupied)
Open bay 63.94(3.29) 46.15 0.000 Isolated 51.83(2.00)
Occupation(Isolated room)
Unoccupied 51.83(2.00) 17.26 0.000 Occupied 56.33(2.96)
Table 5- Noise sources and levels recorded in the MICU
Events Mean Standard
Deviation Mechanical noise
Ventilator 70.20 3.06 Vacuum extractor 72.12 5.73 Infusion pump 71.34 4.20 Atomization device 64.54 6.05
Oxygen 64.58 3.99
Medical cart 73.04 9.76
Radiology 73.61 8.14
Printer 72.57 7.13
Telephone ring 74.12 6.15 Human vocalization
Nursing intervention 70.64 8.13 Medical treatment 71.41 4.69 Replacing beds 73.42 5.18 Patient admitting 74.02 7.09 Centralize visiting 73.20 4.43 Conversation 75.51 6.99 Bedside endorsement 79.21 5.49
Conference 61.33 6.28
Footsteps 64.76 3.43
Cleaning or sweeping 74.35 5.09
4 Discussion
The results of our study showed that the constant measurement of mean sound level
during a week and a work day were 66.64 dB(A) and 68.03 dB(A), respectively, with
maximum level reach 119.7 dB(A). Consistent with and correlate well with previous studies
in ICU throughout the different countries with average sound level measurements between 60
to 80 dB and peaks reaching over 110 dB[2,18,20-22,24-27,29,32,33]. Those results were far
beyond the standards recommended by WHO and the Emission Standard for Community
Noise of China for hospitals and ICU. However, a recent literature review reported that no
study found that the noise level in the ICU was within the recommended levels by the WHO
and/or the EPA[14,19,20,26].
The distribution of mean noise levels measured for 24 hours in a work day vary
systematically over the day, and the data recorded evidenced a higher level in the day shift.
This finding similar to the results of some studies in which sound levels in the ICU were
lower at night than during the day[2,8-10,12,14,20,24,26,33-35]. The mean noise levels
measured at each location differ statistically,the wards located close to nurses’ station were
emergency unit, our study found mean noise levels was significant different in work day and
weekend, work days were shown to be more noisy, this was perhaps there were different work
routines and different number of staff present between work day and weekend.
It can be seen from the results that the level of noise in different locations of department
and the mean minimum noise level during one week measurement period did not drop below
50 dB(A), this can be explained by the very nature of the environment, the ambient
environment of the MICU is filled with high noise levels. Noise in a public hospital is
unavoidable but at the same time, long-term noise exposure is regarded as a health hazard[36],
and numerous previous studies had showed that high noise level has deleterious physical and
psychological effects on both patient and staff, such as hypertension, altered heart rates and
muscle tone, headaches, hearing loss, mental confusion, low attention span and
irritability[4,15-19,25,31,34,37-42].
According to Emission standard for industrial enterprise noise at boundary (China,2008),
8 hours of continuous exposure to a noise level of 85 dB is permissible daily. Although the
mean noise levels during constant measurement period no values above 85 dB in this study,
the mean maximum noise level was close to it, and the work day had exceeded it
(88.62±8.49). Typically, the maximum noise level events did not continuously over an 8-hour
per day, most were intermittently about 30 seconds. This value may indicate the risk of
developing negative effects solely from the exposure. However, the longer noise exposure, the
higher risk obtained, and patients and healthcare staff may be affected alike. Ways and means
of reducing the levels of noise in preclinical should be taken into consideration because these
noise levels have a potential to cause damage over a prolonged exposure.
Previous literature show that, since the 1960s, the average noise levels inside hospitals
have increased by an average of 0.38 dBA (day) and 0.42 dBA (night) per year[43]. As noise
in a workplace may originate from several sources, noise levels increased in ICUs maybe due
to a substantial increase in the number of devices with acoustic alarms, and background noise
by actions and speaking of healthcare professionals[14].
familiar in ICU were identified, and most of those noise sources’ mean levels are higher than average level of the day (Table 5), thus, those noise sources may the main events related to increased noise levels in ICU.
The exact source of excessive noise pollution within the ICU is multi-factorial, some researchers suggested that the majority of noise created in their ICU was created by mechanical alarms[25,32], while other discovered that medical and more so nursing staff were just as responsible for noise production in the ICU[11,24,44]. Obviously, it difficult to attributing blames which source is responsible.
Our study found there was significant different between occupied wards and unoccupied wards which without equipment operated, and there was statistically significant differences in work day and less staff present’s weekend, It makes clear that both mechanical noise and human vocalization contribute to make our MICU a noisy environment. Furthermore, the potentially poor acoustical design in the ICU may be integrated together to increased noise levels.
As noted by Konkani and Oakley[12] reduction of sound levels in hospital ICUs to the recommended level of 45 dB(A) is clearly an important goal, there is a great deal of work remains to be done to make significant progress in this area. A calm and pleasant healing environment may benefit both patients and health care staff alike[3,5,27,29,37,42,45,46].
There were a few limitations to our study. Although there was a pilot measurement to confirm the reliability and validity of the data collected, the potential for the Hawthorne effect still cannot be ruled out. Without implement long-term constantly measurements, the nursing staff may have been more cautious about their behaviour and intentionally decreased the noise level. Because there were so many noise sources at a time in MICU, it was difficult to identify the noise sources separately and measure noise levels in different location at the same time. We did not measure the spectral content of the sound, neither. In addition, we made no measurements of the perception in both health care staff and patient, and the influence of noise on them.
5 Conclusion
The findings of this study validate those of other studies conducted in MICU, it showed
that MICU is indeed a noisy environment, the excessive sound levels that do not meet
Chinese or WHO’s standards and recommendations for hospital and ICU. The MICU noise
levels were found to be high especially during day time and work days. The distribution of
noise levels in different locations and different room style were differed significantly, and
there is still need to elucidate the exact sources of noise. In conclusion, this study makes it
Acknowledgement
The authors thank the Fujian Province Health and Family Planning Commission's Youth
Research Foundation (2014-1-8) for the support.
References
1. Basner, M.; McGuire, S. Who environmental noise guidelines for the european region: A systematic review on environmental noise and effects on sleep. Int J Environ Res Public Health 2018, 15.
2. White, B.L.; Zomorodi, M. Perceived and actual noise levels in critical care units. Intensive Crit Care Nurs 2017, 38, 18-23.
3. Cunha, M.; Silva, N. Hospital noise and patients’ wellbeing. Procedia - Social and Behavioral Sciences 2015, 171, 246-251.
4. Brown, B.; Rutherford, P.; Crawford, P. The role of noise in clinical environments with particular reference to mental health care: A narrative review. Int J Nurs Stud 2015, 52, 1514-1524.
5. Bartley, J.; Streifel, A.J. Design of the environment of care for safety of patients and personnel: Does form follow function or vice versa in the intensive care unit? Crit Care Med 2010, 38, S388-398.
6. Bartley, J.M.; Olmsted, R.N.; Haas, J. Current views of health care design and construction: Practical implications for safer, cleaner environments. Am J Infect Control 2010, 38, S1-12. 7. Kang, J. Urban sound environment. CRC Press: 2006.
8. Khademi, G.; Roudi, M.; Farhat, A.S.; Shahabian, M. Noise pollution in intensive care units and emergency wards. Iranian journal of otorhinolaryngology 2011, 23, 141.
9. Bentley, S.; Murphy, F.; Dudley, H. Perceived noise in surgical wards and an intensive care area: An objective analysis. Br Med J 1977, 2, 1503-1506.
10. Seidlitz, P. Excessive noise levels detrimental to patients, staff. Hospital progress 1981, 62, 54-56, 64.
11. Kam, P.; Kam, A.; Thompson, J. Noise pollution in the anaesthetic and intensive care environment. Anaesthesia 1994, 49, 982-986.
12. Konkani, A.; Oakley, B. Noise in hospital intensive care units—a critical review of a critical topic. Journal of critical care 2012, 27, 522. e521-522. e529.
13. Medicine, S.o.C.C. Guidelines for intensive care unit design guidelines. Practice Parameters Committee of American College of Critical Care Medicine: 1995.
14. Christensen, M. Noise levels in a general surgical ward: A descriptive study. Journal of clinical nursing 2005, 14, 156-164.
15. Bosma, K.J.; Ranieri, V.M. Filtering out the noise: Evaluating the impact of noise and sound reduction strategies on sleep quality for icu patients. Crit Care 2009, 13, 151.
16. Meyer, T.J.; Eveloff, S.E.; Bauer, M.S.; Schwartz, W.A.; Hill, N.S.; Millman, R.P. Adverse environmental conditions in the respiratory and medical icu settings. CHEST Journal 1994, 105, 1211-1216.
17. Morrison, W.E.; Haas, E.C.; Shaffner, D.H.; Garrett, E.S.; Fackler, J.C. Noise, stress, and annoyance in a pediatric intensive care unit. Critical care medicine 2003, 31, 113-119. 18. Stanchina, M.L.; Abu-Hijleh, M.; Chaudhry, B.K.; Carlisle, C.C.; Millman, R.P. The influence
of white noise on sleep in subjects exposed to icu noise. Sleep medicine 2005, 6, 423-428. 19. Xie, H.; Kang, J.; Mills, G.H. Clinical review: The impact of noise on patients' sleep and the
effectiveness of noise reduction strategies in intensive care units. Critical Care 2009, 13, 208. 20. Tainter, C.R.; Levine, A.R.; Quraishi, S.A.; Butterly, A.D.; Stahl, D.L.; Eikermann, M.;
standards. Crit Care Med 2016, 44, 147-152.
21. Kramer, B.; Joshi, P.; Heard, C. Noise pollution levels in the pediatric intensive care unit. J Crit Care 2016, 36, 111-115.
22. Munro, N. Sleep deprivation in critically ill patients. Advance for Nurses 2002, 3, 13-16. 23. Lawson, N.; Thompson, K.; Saunders, G.; Saiz, J.; Richardson, J.; Brown, D.; Ince, N.;
Caldwell, M.; Pope, D. Sound intensity and noise evaluation in a critical care unit. American Journal of Critical Care 2010, 19, e88-e98.
24. Hilton, B. Noise in acute patient care areas. Research in nursing & health 1985, 8, 283-291. 25. Falk, S.A.; Woods, N.F. Hospital noise—levels and potential health hazards. New England
Journal of Medicine 1973, 289, 774-781.
26. Tegnestedt, C.; Gunther, A.; Reichard, A.; Bjurstrom, R.; Alvarsson, J.; Martling, C.R.; Sackey, P. Levels and sources of sound in the intensive care unit - an observational study of three room types. Acta Anaesthesiol Scand 2013, 57, 1041-1050.
27. Johansson, L.; Knutsson, S.; Bergbom, I.; Lindahl, B. Noise in the icu patient room - staff knowledge and clinical improvements. Intensive Crit Care Nurs 2016, 35, 1-9.
28. Seaman, C.H. Research methods: Principles, practice, and theory for nursing. Appleton & Lange: 1987.
29. Konkani, A.; Oakley, B. Noise in hospital intensive care units--a critical review of a critical topic. J Crit Care 2012, 27, 522 e521-529.
30. Polit, D.F.; Beck, C.T. Nursing research: Principles and methods. Lippincott Williams & Wilkins: 2004.
31. Polgar, S.; Thomas, S.A. Introduction to research in the health sciences. Elsevier Health Sciences: 2013.
32. Balogh, D.; Kittinger, E.; Benzer, A.; Hackl, J. Noise in the icu. Intensive care medicine 1993, 19, 343-346.
33. Tsiou, C.; Eftymiatos, D.; Theodossopoulou, E.; Notis, P.; Kiriakou, K. Noise sources and levels in the evgenidion hospital intensive care unit. Intensive care medicine 1998, 24, 845-847.
34. Sampaio Neto, R.d.A.; Mesquita, F.O.d.S.; Junior, P.; Siqueira, M.D.; Ramos, F.F.; Andrade, F.M.D.d.; Junior, C.; de Valois, M.A. Noise in the intensive care unit: Quantification and perception by healthcare professionals. Revista Brasileira de terapia intensiva 2010, 22, 369-374.
35. Darbyshire, J.L.; Young, J.D. An investigation of sound levels on intensive care units with reference to the who guidelines. Critical Care 2013, 17, R187.
36. Ising, H.; Kruppa, B. Health effects caused by noise: Evidence in the literature from the past 25 years. Noise and Health 2004, 6, 5.
37. Bazuin, D.; Cardon, K. Creating healing intensive care unit environments: Physical and psychological considerations in designing critical care areas. Critical Care Nursing Quarterly 2011, 34, 259-267.
38. Bion, V.; Lowe, A.S.; Puthucheary, Z.; Montgomery, H. Reducing sound and light exposure to improve sleep on the adult intensive care unit: An inclusive narrative review. J Intensive Care Soc 2018, 19, 138-146.
40. Locihova, H.; Axmann, K.; Padysakova, H.; Fejfar, J. Effect of the use of earplugs and eye mask on the quality of sleep in intensive care patients: A systematic review. J Sleep Res 2018, 27, e12607.
41. Ma, K.W.; Wong, H.M.; Mak, C.M. A systematic review of human perceptual dimensions of sound: Meta-analysis of semantic differential method applications to indoor and outdoor sounds. Building and Environment 2018, 133, 123-150.
42. Persson Waye, K.; Elmenhorst, E.M.; Croy, I.; Pedersen, E. Improvement of intensive care unit sound environment and analyses of consequences on sleep: An experimental study. Sleep Med 2013, 14, 1334-1340.
43. Busch-Vishniac, I.J.; West, J.E.; Barnhill, C.; Hunter, T.; Orellana, D.; Chivukula, R. Noise levels in johns hopkins hospital. The Journal of the Acoustical Society of America 2005, 118, 3629-3645.
44. Cmiel, C.A.; Karr, D.M.; Gasser, D.M.; Oliphant, L.M.; Neveau, A.J. Noise control: A nursing team’s approach to sleep promotion: Respecting the silence creates a healthier environment for your patients. AJN The American Journal of Nursing 2004, 104, 40-48.
45. Nimlyat, P.S.; Kandar, M.Z. Appraisal of indoor environmental quality (ieq) in healthcare facilities: A literature review. Sustainable Cities and Society 2015, 17, 61-68.