APPLICATION OF STATISTICAL AND NEURAL NETWORK MODEL FOR OIL PALM YIELD STUDY
AZME BIN KHAMIS
Faculty of Science Universiti Teknologi Malaysia
APPLICATION OF STATISTICAL AND NEURAL NETWORK MODEL FOR OIL PALM YIELD STUDY
AZME BIN KHAMIS
A thesis submitted in fulfilment of the requirements for the award of the degree of
Doctor of Philosophy
Faculty of Science Universiti Teknologi Malaysia
ACKNOWLEDGEMENTS
ﻢﻴﺣﺮﻟا
ﻦﻤﺣﺮﻟا
ﷲا
ﻢﺴﺑ
In the name of Allah, the most Beneficent and the most Merciful.
I would like to express my gratitude to my supervisor, Associate Professor Dr. Zuhaimy Hj Ismail for his encouragement, patience, constant guidance,
continuous support and assistance all through out the period. Most of his invaluable comments and suggestion would be preciously valued. His dedication to work and perfectionism will be always be remembered and learnt as a basic necessity of a successful scholar. I am also very grateful to my co-supervisor, Dr. Khalid Haron from Malaysian Oil palm Board (MPOB), Kluang Station for his, comments, suggestions and sincere support during this endeavour. I also would like to thank Haji Ahmad Tarmizi Mohammed from MPOB Bangi for his motivation, fruitful discussion and valuable comments.
I am especially grateful to my beloved wife, Hairani Razali, for her patience, encouragement and constant support she gives. She is my ‘co-pilot’ and this study would not possible without her. To my two lovely sons, Amirul Fikri and Amirul Farhan, and my lovely daughter Amirah Afiqah: you’re daddy’s source of
inspiration. Many thanks go to my beloved parents, who constantly and remotely gave me encouragement and advice.
ABSTRACT
This thesis presents an exploratory study on modelling of oil palm (OP) yield using statistical and artificial neural network approach. Even though Malaysia is one of the largest producers of palm oil, research on modelling of OP yield is still at its infancy. This study began by exploring the commonly used statistical models for plant growth such as nonlinear growth model, multiple linear regression models and robust M regression model. Data used were OP yield growth data, foliar
ABSTRAK
Tesis ini mempersembahkan kajian penerokaan terhadap pemodelan hasil kelapa sawit melalui pendekatan statistik dan rangkaian neural buatan. Malaysia adalah negara pengeluar minyak kelapa sawit terbesar, namun begitu penyelidikan mengenai pemodelan hasil kelapa sawit masih berada diperingkat awal. Kajian ini dimulakan dengan penerokaan terhadap model statistik yang popular untuk
pertumbuhan pokok seperti model pertumbuhan taklinear, analisis regresi linear berganda dan analisis regresi-M teguh. Data hasil kelapa sawit, data kandungan nutrien dalam daun dan data ujikaji pembajaan yang dikumpulkan daripada tujuh buah stesen di kawasan pedalaman dan tujuh buah stesen di kawasan tanah lanar pantai telah disediakan oleh Lembaga Minyak Sawit Malaysia (MPOB). Dua belas model pertumbuhan taklinear telah dipertimbangkan. Kajian awal menunjukkan model pertumbuhan taklinear logistik adalah yang terbaik untuk memodelkan pertumbuhan hasil kelapa sawit. Kajian ini diteruskan dengan menerokai hubungan di antara hasil kelapa sawit dengan kandungan nutrien dalam daun dan nisbah keseimbangan nutrien. Bagi mempertingkatkan keupayaan model, kajian ini
menerokai penggunaan rangkaian neural. Kajian ini juga mengkaji kesan rekabentuk rangkaian neural seperti gabungan fungsi penggiat, kadar pembelajaran, bilangan nod tersembunyi, kadar momentum, bilangan larian dan data lampau terhadap prestasi rangkaian neural. Kajian perbandingan di antara beberapa model yang dikaji telah dilakukan. Analisis satah sambutan telah digunakan untuk menentukan nisbah baja yang paling optimum bagi menghasilkan hasil kelapa sawit yang maksimum. Masalah titik pelana berlaku di dalam analisis dan analisis permatang telah digunakan untuk mengatasi masalah tersebut dengan ia menyediakan beberapa pilihan kombinasi baja yang boleh dipertimbangkan. Akhir sekali, analisis
TABLE OF CONTENTS
CHAPTER TITLE PAGE
1
TITLE
DECLARATION
ACKNOWLEDGEMENTS ABSTRACT
ABSTRAK
TABLE OF CONTENTS LIST OF FIGURES LIST OF TABLES LIST OF SYMBOLS LIST OF APPENDICES
INTRODUCTION
1.1 Introduction
1.2 Research Background
1.3 Brief History of Oil Palm Industry in Malaysia 1.4 Problem Descriptions
1.5 Research Objectives 1.6 Scope of The Study 1.6.1 Data Scope 1.6.2 Model Scope
1.6.3 Statistical Testing Scope 1.7 Data Gathering
1.8 Leaf Analysis
1.9 Research Importance
1.10 Research Contribution
1.11 Thesis Organisation
i ii iii iv v vi xii xvii
xxi xxv
2 REVIEW OF THE LITERATURE
2.1 Introduction
2.2 Oil Palm Yield Modelling 2.3 Nonlinear Growth Model
2.4 Application of Neural Network Modelling
2.4.1 Neural Network in Science and Technology 2.4.2 Neural Network in Economy
2.4.3 Neural Network in Environmental and Health
2.4.4 Neural Network in Agriculture 2.5 Response Surface Analysis
2.6 Summary
21 21 27 30 31 32 34 35 37 38
3 RESEARCH METHODOLOGY
3.1 Introduction 3.2 Data Analysis 3.3 Modelling
3.3.1 Nonlinear Growth Models 3.3.1.1 Nonlinear Methodology 3.3.2 Regression Analysis
3.3.2.1 Least Squares Method 3.3.3 Robust M-Regression
3.3.4 Neural Networks Model
3.3.4.1 Introduction to Neural Network 3.3.4.2 Fundamentals of Neural Network 3.3.4.3 Processing Unit
3.3.4.4 Combination Function 3.3.4.5 Activation Function 3.3.4.6 Network Topologies
3.3.4.7 Network Learning 3.3.4.8 Objective Function
3.3.4.9 Basic Architecture of Feed-Forward Neural Network
3.3.5 Response Surface Analysis 3.3.5.1 Introduction
3.3.5.2 Response Surface: First Order 3.3.5.3 Response Surface: Second Order 3.3.5.4 Stationary Point
3.3.5.5 Ridge Analysis
3.3.5.6 Estimate the standard error of predicted response
3.4 Summary
64 65
66 72 73 73 76 77 79
80 81
4 MODELLING OIL PALM YIELD GROWTH
USING NONLINEAR GROWTH MODEL
4.1 Introduction
4.2 The Nonlinear Model 4.3 The Method of Estimation
4.4 Partial Derivatives for The Nonlinear Models 4.5 Results and Discussion
4.6 Conclusion
82 84 85 87 93 104
5 MODELLING OIL PALM YIELD USING MULTIPLE LINEAR REGRESSION AND ROBUST M-REGRESSION
5.2 Model Development
5.3 Results and Discussion
5.3.1 Multiple Linear Regression 5.3.2 Residual Analysis for MLR
5.3.3 Robust M-Regression 5.3.4 Residual Analysis for RMR 5.4 Conclusion 105 105 107 107 110 115 116 119
6 NEURAL NETWORK MODEL FOR OIL PALM
YIELD
6.1 Introduction
6.2 Neural Network Procedure 6.2.1 Data Preparation
6.2.2 Calculating Degree of Freedom
6.3 Computer Application
6.4 Experimental Design for Neural Network 6.4.1 Experiment 1
6.4.2 Experiment 2 6.4.3 Experiment 3 6.5 Results and Discussion 6.5.1 Statistical Analysis
6.5.2 Neural Network Performance 6.5.3 Residual Analysis
6.5.4 Results of Experiment 1 6.5.5 Results of Experiment 2 6.5.6 Results of Experiment 3
6.6 Comparative Study on Oil Palm Yield Modelling
6.7 Conclusion
7 THE APPLICATION OF RESPONSE SURFACE ANALYSIS IN MODELLING OIL PALM YIELD
7.1 Introduction
7.2 Response Surface Analysis 7.3 Data Analysis
7.4 Numerical Analysis
7.4.1 Canonical Analysis for Fertilizer Treatments 7.4.2 Ridge Analysis for Fertilizer Treatments 7.5 Economic Analysis
7.5.1 Profit Analysis 7.6 Conclusion
169 169 172 173 174 179 186 187 195
8 SUMMARY AND CONCLUSION
8.1 Introduction
8.2 Results and Discussion
8.2.1 Initial Exploratory Study
8.2.2 Modelling Using Neural Network
8.2.3 Modelling Using Response Surface Analysis 8.3 Conclusion
8.4 Areas for Further Research
REFERENCES
Appendices A - U
196 196 197 201 208 211 211
214
LIST OF TABLES
TABLE NO. TITLE PAGE
1.1 The optimum value of nutrient balance ratio, NBR for
foliar analysis 17
2.1 The summary of the literature reviews in this study 39
3.1 Nonlinear mathematical models considered in the study 50
3.2 Summary of the data set types and research approaches
considers in this study 81
4.1 Partial derivatives of the Logistic and Gompertz and von
Bertalanffy growth models 87
4.2 Partial derivatives of the Negative exponential,
Monomolecular, log-logistic and Richard’s growth models 88
4.3 Partial derivatives of the Weibull, Schnute and
Morgan-Mercer-Flodin growth models 89
4.4 Partial derivatives of the Champan-Richard and Stannard growth models
90
4.5 Parameter estimates of the logistic, Gompertz, negative exponential, monomolecular, log-logistic, Richard’s and
4.6 Parameter estimates of the MMF, von Bertalanffy, Chapman-Richard and Stannard growth models for
yield-age relationship 95
4.7 Asymptotic correlation for each nonlinear growth models
fitted 96
4.8 The actual and predicted values of FFB yield, the
associated measurement error and correlation coefficient between the actual and predicted values for Logistic , Gompertz, von Bertalanffy, negative exponential, mono
molecular and log-logistic growth models 98
4.9 The actual and predicted values of FFB yield, the
associated measurement error and correlation coefficient between the actual and predicted values for Richard’s , Weibull, MMF, Chapman-Richard, Chapman-Richard*
(with initial) and Stannard growth models 99
4.10 The parameter estimates an asymptotic correlation for von Bertalanffy and Chapman-Richard when an initial growth
response data point is added 103
4.11 The number of iteration and the root mean squares error for
nonlinear growth models consider in this study 104
5.1 The regression equations and R2 values for the inland and
coastal areas 119
5.2 The regression equation for the inland and coastal station
using MNC and NBR as independent variables 114
inland and coastal areas 116
6.1 The F statistics value for ANOVA for different activation
functions used for inland area 134
6.2 The F statistics value for ANOVA for different activation
functions used for the coastal area 135
6.3 The Chi-Square value of MSE testing for the inland and
coastal areas 136
6.4 Duncan test for the average of MSE for homogeneous
subsets for the inland and coastal areas 137
6.5 Mean squares error for training, validation, testing and
average of the neural networks model in the inland area 138
6.6 Mean squares error for training, validation, testing and
average of the neural networks model in the coastal area 139
6.7 The correlation coefficient of the neural network model 140
6.8 The MAPE values of the neural network model 141
6.9 The t-statistic values in the training data 152
6.10 The t-statistic values for the test data 155
6.11 The MSE, RMSE, MAE and MAPE for MLR, MMR and
neural networks performance for inland 157
6.12 The MSE, RMSE, MAE and MAPE for MLR, MMR and
6.13 The correlation changes from the MLR and MMR models
to neural network model 163
6.14 The performance changes of the MAPE from the MLR and
MMR to the neural network model 164
7.1 The average of FFB yield, MSE, RMSE and R2 values for
inland area 174
7.2 The average of FFB yield, MSE, RMSE and R2 values for
coastal area 175
7.3 The eigenvalues and predicted FFB yield at stationary
point for each critical fertilizer level in inland area 176
7.4 The eigenvalues, the predicted FFB yield at the stationary points and critical values of fertiliser level for CLD1 and
CLD2 stations 177
7.5 The eigenvalues, the predicted FFB yield at the stationary points and critical values of fertiliser level for CLD3,
CLD4, CLD5, CLD6 and CLD7 178
7.6 The estimated FFB yield and fertiliser level at certain
radius for stations ILD3 and ILD4 in the inland area 180
7.7 The estimated FFB yield and fertiliser level at certain
radius for stations ILD5 and ILD6 in the inland area 181
7.8 The estimated FFB yield and fertiliser level at certain radii
for station ILD7 182
for stations CLD1 and CLD2 in the coastal area 183
7.10 The estimated FFB yield and fertiliser level at the certain
radii for stations CLD4 and CLD5 in the coastal area 184
7.11 The estimated FFB yield and fertiliser level at the certain
radii for stations CLD5 and CLD6 in the coastal area 185
7.12 The estimated FFB yield and fertiliser level at the certain
radii for station CLD7 in the coastal area 186
7.13 The fertiliser level, average estimated of FFB yield and
total profit for the inland and coastal areas 189
7.14 The estimated FFB yield and the foliar nutrient
composition levels in (%) for inland area 192
7.15 The estimated FFB yield and the foliar nutrient
composition levels in (%) for the coastal area 193
8.1 The adequacy of fit measurement used for the nonlinear
growth models 198
8.2 The RMSE, MAPE and R2 values for the MLR and MMR
modeling for the inland and coastal areas 199 8.3 The RMSE, MAPE and R2 values for the MLR and MMR
modeling for the coastal area
200 8.4 The F values of the analysis of variance for different
activation functions for the inland and coastal areas 202
8.5 The MAPE values and the correlation of the neural
8.6 The F value of analysis of variance for Experiment 1, 2 and
3 204
8.7 The comparison of the MAPE values and the correlation values among the MLR, MMR and NN models for inland
and coastal areas 205
8.8 The accuracy of the MLR, MMR, NN models and the
accuracy changes for the inland area 207
8.9 The accuracy of the MLR, MMR, NN models and the
accuracy changes for the coastal area 207
8.10 The fertiliser level, average estimated of FFB yield and
total profit for the inland area 209
8.11 The fertiliser level, average estimated of FFB yield and
total profit for the coastal area 209
8.12 The average estimated of the FFB yield and the foliar
LIST OF FIGURES
FIGURE NO. TITLE PAGE
1.1 Annual production of crude palm oil (1975-2003)
including Peninsular Malaysia, Sabah and Sarawak 4
1.2 Oil palm planted area: 1975 – 2003 (hectare) including
Peninsular Malaysia, Sabah and Sarawak 5
1.3 Annual export of palm oil: 1975 – 2003 (in tonnes) 5
1.4 World major producers of palm oil (‘000 tonnes) 6
1.5 World major exporter of palm oil and including
re-exporting country (*) 6
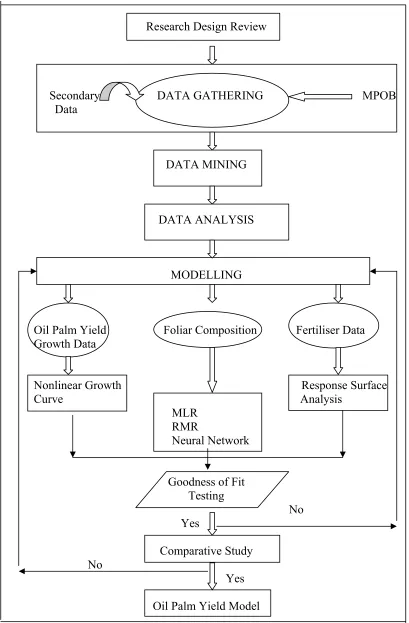
1.6 Summary of research framework and research
methodology used in this study 10
3.1 Data analysis procedure used in this study 44
3.2 FFB yield growth versus time (year of harvest) 46
3.3 Processing unit 58
3.4 Identity function 60
3.6 Sigmoid function 61
3.7 Bipolar sigmoid function 61
3.8 Feed-forward neural network 62
3.9 Recurrent neural network 63
3.10 Supervised learning model 65
3.11 Backward propagation 70
3.12 The descent vs. learning rate and momentum 72
4.1 Residual plot for Logistic, Gompertz, von Bertalanffy, Negative exponential, Monomolecular and Log logistic
growth models 100
4.2 Residual plot for Richard’s, Weibull, Morgan-Mercer-Flodin, Chapman-Richard, Chapman-Richard* and
Stannard growth models 101
5.1 The error distribution plots of MLR model in coastal
stations 111
5.2 The error distribution plots of MLR model in inland
stations 112
5.3 The error distribution plots of RMR model in inland
stations 117
5.4 The error distribution plots of RMR model in coastal
stations 118
5.6 The R2 value for each model proposed for coastal area 120
6.1 Three layers fully connected neural networks with five
input nodes and one output node 125
6.2 The early stopping procedure for feed-forward neural
network 128
6.3 The mean squares error for training, validation and
testing 128
6.4 The correlation coefficient between the actual and
predicted value 129
6.5 The three layers fully connected neural networks with
nine input nodes and one output node 130
6.6 The actual and predicted FFB yield for ILD1, ILD2 and
ILD3 stations using the NN model 142
6.7 The actual and predicted FFB yield for ILD4, ILD5,
ILD6 and ILD7 stations using the NN model 143
6.8 The actual and predicted FFB yield for ILDT, CLD1,
CLD2 and CLD3 stations using the NN model 144
6.9 The actual and predicted FFB yield for CLD4, CLD5,
CLD6 and CLD7 using the NN model 145
6.10 The actual and predicted FFB yield for CLDT using the
6.11 The error distribution plot of neural network model for
the inland stations 147
6.12 The error distribution plots of neural network model for
the coastal stations 148
6.13 The MSE values for different levels of the
percentage-outliers in the training data 150
6.14 The MSE values for different levels of the
magnitude-outliers in the training data 151
6.15 The MSE values for different levels of the
percentage-outliers in the test data 153
6.16 The MSE values for different levels of the
magnitude-outliers in the test data 153
6.17 The correlation coefficient from the MLR, MMR and
NN models for inland area 159
6.18 The correlation coefficient from the MLR, MMR and
NN models for coastal area 160
6.19 Comparison of the MAPE values between MLR, MMR
and NN for inland area 160
6.20 Comparison of the MAPE values between MLR, MMR
and NN for coastal area 161
6.21 Comparison of the accuracy of models for inland area 165
6.23 The percentage changes of the model accuracy for
inland area 166
6.24 The percentage changes of the models accuracy for
coastal area 166
7.1 The response surface plots for fertiliser treatments in ILD1 and ILD2 stations in inland and CLD2 and CLD7
stations in coastal area 171
7.2 Data analysis procedure in obtaining the optimum level
of fertiliser level and foliar nutrient composition 172
7.3 The fertiliser levels for each station in the inland area 190
7.4 The fertiliser levels for each station in the coastal area 191
7.5 The foliar nutrient composition levels for each station
in the inland area 192
7.6 The foliar nutrient composition levels for each station
in the coastal area 194
7.7 Comparison between the N and K fertiliser level needs
by oil palm for the coastal and inland areas 194
LIST OF SYMBOLS
FFB - Fresh Fruit Bunches
FELDA - Federal Land Development Authority
RISDA - Rubber Industry Smallholders Development Authority SADC - State Agriculture Development Corporations
FELCRA - Federal Land Consolidation and Rehabilitation Authority LSU - Leaf Sampling Unit
NN - Neural Network
MLR - Multiple Linear Regression
RMR - Robust M-Regression
RSA - Response Surface Analysis MSE - Mean Square Error
RMSE - Root Mean Square Error
MAPE - Mean Absolute Percentage Error N - Nitrogen
P - Phosphorus K - Potassium
Ca - Calcium
Mg - Magnesium
TLB - Total Leaf Basis NBR - Nutrient Balance Ratio
CLP - Critical Leaf Phosphorus Concentration MNC - Major Nutrient Component
AS - Ammonium Sulphate
CIRP - Christmas Island Rock Phosphate
LIST OF APPENDICES
APPENDIX TITLE
PAGE
A The list of oil palm experimental stations 231
B The rate and actual value of fertiliser (kg/palm/year) 232
C Summary of macro nutrients needed by plants 234
D The list of paper published from 2001 until Now 236
E The ridge analysis 239
F Nonlinear least squares iterative phase, nonlinear least squares summary statistics and normal
probability plot for the nonlinear growth models 240
G The parameters estimate using multiple linear regression for MNC as independent variables for inland area
255
H The parameters estimate using multiple linear regression for MNC as independent variables for coastal area
256
I Normal probability plot of multiple linear regression
for the inland area 257
J Normal probability plot of multiple linear regression
K The parameters estimate using multiple linear regression using MNC and NBR as independent
variables for the coastal area 259
L The parameters estimate using multiple linear regression using MNC and NBR as independent
variables for the inland area 260
M The Q-Q plot for inland stations 261
N The Q-Q plot for coastal stations 262
O Example of the Matlab programming for neural
network application 263
P Graphical illustration for the best regression line
fitting for inland stations 266
Q Graphical illustration for the best regression line
fitting for coastal stations 270
R The MSE, RMSE, MAE and MAPE values for each
neural network model in the inland area 274
S The MSE, RMSE, MAE and MAPE values for each
neural network model in the coastal area 276
T The calculation of total profit (RM) for the inland
stations according to each radius 278
U The calculation of total profit (RM) for the coastal
CHAPTER 1
INTRODUCTION
1.1 INTRODUCTION
This chapter presents the introduction to this thesis. It begins by describing the overall research background followed by a brief history of the oil palm industry in Malaysia. Research objectives, the scope of this study, research framework and discussion on the research contribution are also given. Finally, the brief of each chapter is outlined.
1.2 RESEARCH BACKGROUND
In the oil palm industry, modelling plays an important role in understanding various issues. It is used in decision making and the advance in computer technology has created new opportunity for the study of modelling. Modelling can be
categorised into statistical and heuristic modelling. Statistical modelling is defined as the analysis of the relationship between multiple measurements made on groups of subjects or objects, and the model usually contains systematic elements and random effects. As a mathematical aspect, statistical modelling can be defined as a set of probability distributions on the sample space. Modelling involves the appropriate application of statistical analysis techniques with certain assumptions on hypothesis testing, data interpretation, and applicable conclusion.
analysis, it is normal to begin with the descriptive statistics, graphs, and relationship plots of the data to evaluate the legitimacy of the data, identify possible outliers and assumption violations, and form preliminary ideas on variable relationships for modelling.
The heuristic approach is defined as pertaining to the use of general knowledge based on experimentation, evaluating possible answers or solutions, or trial-and-error methods relating to solving problems by experience rather than theory. Heuristic is also the problem-solving procedure that involves conceiving a
hypothetical answer to a problem at the outset of an inquiry for purposes of giving guidance or direction to the inquiry. One of the heuristic approaches is the neural network model, which is based on the rules of thumb and widely used in various fields. A very important feature of neural networks is their adaptive nature where ‘learning by example’ replaces ‘programming’ in solving problems. This feature renders these computational models very appealing in application domains, where one has little or incomplete understanding of the problem to be solved, but where training data or examples are available.
Neural networks are viable and very important computational models for a wide variety of problems. These include pattern classification, function
approximation, image processing, clustering, forecasting and prediction. It is common practice to use the trial and error method to find a suitable neural networks architecture for a given problem. A number of neural networks are successfully used and reported in literature (Zuhaimy and Azme, 2001; Zuhaimy and Azme, 2002). Neural network also has been applied in various fields such as in environmental (Corne et al., 1998; Hsieh and Tang, 1998; Navone and Ceccatto, 1994), in economy and management (Boussabaine and Kaka, 1998; Franses and Homelen, 1998; Garcia and Gency, 2000; Indro et al., 1999; Klein and Rossin, 1999b; Tkacz and Hu, 1999; Yao et al., 2000) and in agronomy (Shearer et al., 1994; Drummond
et al., 1995; Liu et al., 2001; Kominakis et al., 2002; Shrestha and Steward, 2002).
networks in application. The most popular architecture, in the class of multiple layer perceptron, is the feedforward neural network.
The developments of models for agriculture are normally divided into three steps. The first step is to develop a preliminary model, which is inadequate. This preliminary model does not have to be a good model but it acts as a basis. This leads to further research, to develop a comprehensive model incorporating all the processes that appear to be important. Such a model is valuable for research, but far too
complex for everyday use. To overcome this, a set of summary models is produced, each containing enough detail to answer limited questions. For example, there might be a summary model to predict the response to fertilisers on different soil types. Another model might be used to predict cyclic variation in yield. Modelling helps to make predictions more accurate. There is no doubt that modelling will maintain its importance in oil palm research as the problems set more complex and difficult. This study proposes the development of statistical model and neural network in modelling oil palm yield.
1.3 BRIEF HISTORY OF OIL PALM INDUSTRY IN MALAYSIA
Oil palm (Eleais guineensis. Jacq.), is a plant of African origin and is grown commercially in Africa. In the early 19th century the oil palm was brought into this country by the British. The oil palm was first planted in 1848 in Bogor-Indonesia and in Malaysia in 1870, at the same time rubber seeds were brought in (Hartley, 1977). Due to lower profitability of oil palm in comparison to rubber, the
plantations and the Federal Land Development Authority (FELDA). In addition, a number of State Agriculture Development Corporations (SADC) became involved in oil palm cultivation after learning about its good prospects. The Rubber Industry Smallholders’ Development Authority (RISDA) and the Federal Land Consolidation and Rehabilitation Authority (FELCRA) were also involved in cultivating abandoned and idle rubber and paddy areas with oil palm (Teoh, 2000).
From year 1975 to year 2000, the worldwide area planted with oil palm (Elaeis guineensis Jacq.) has increased by more than 150 percent. Most of this increase has taken place in Southeast Asia, with a spectacular production increase in Malaysia and Indonesia. The production of crude palm oil (CPO) in 2003 increased markedly, by 12.1 percent or 1.4 million tonnes to 13.35 million tonnes from 11.91 million tonnes in 2002 (Figure 1.1) (Teoh, 2000).
0 500000 1000000 1500000 2000000 2500000 3000000 3500000 4000000
1975 1977 1979 1981 1983 1985 1987 1989 1991 1993 1995 1997 1999 2001 2003
Year
He
c
ta
re
Figure 1.1: Oil palm planted area: 1975 – 2003 (hectares) including Peninsular Malaysia, Sabah and Sarawak
The production of crude palm kernel also rose substantially by 11.6 percent in to 1.6 million tonnes year 2003 from 1.47 million tonnes in year 2002. The increase was mainly attributed to the expansion in the matured area (Figure 1.2), favourable weather conditions and rainfall distribution as well as constant sunshine throughout the year. Exports of palm oil increased by 12.5 percent or 1.36 million tonnes to 12.25 million tonnes from 10.89 million tonnes in 2002 (Figure 1.3) (MPOB, 2003).
0 2000000 4000000 6000000 8000000 10000000 12000000 14000000 16000000
1975 1977 1979 198 1
1983 1985 1987 1989 1991 1993 1995 1997 1999 2001 2003
Year C rude pa lm oi l ( tonne s)
Figure 1.2: Annual production of crude palm oil (1975-2003) including Peninsular Malaysia, Sabah and Sarawak. (Source: Department of Statistics, Malaysia: 1975-1989; MPOB: 1990-2003)
0 2000000 4000000 6000000 8000000 10000000 12000000 14000000 1975 197 7
1979 1981 1983 1985 1987 1989 1991 1993 1995 1997 1999 2001 200 3 Year P a lm o il ( to n n e s)
Malaysia is the major producer and exporter of palm oil in the world (Teoh, 2000). Figure 1.4 shows Malaysian production of palm oil compared to Indonesia and other countries from 1999 to 2003. It shows that Malaysia and Indonesia
recorded an increase in production every year. While Figure 1.5 presents the world’s major palm oil exporters of palm oil from year 1999 to 2003, it also indicates that Malaysia and Indonesia also recorded the higher volume. In 2003, the Malaysian palm oil exporting industry has increased by around 12.5 percent to 12,248 million tonnes, from 10,886 million tones the previous year. Indonesia only recorded a 7.07 percent increase over the same period. The development of the oil palm industry is growing at a fast rate and requires a lot of research. This study took the challenge to contribute our knowledge to the development of the oil palm industry.
0 2000 4000 6000 8000 10000 12000 140 160
Msia Indon Nigeria Colomb
C-d'Ivoeir
PNG Thai Other
World countries
P
roduc
tion (
'000
t
o
n
n
e 00
00
s
1999 2000 2001 2002 2003
Figure 1.4: World major producers of palm oil (‘000 tonnes)
0 2000 4000 6000 8000 10000 12000 14000
Msia Indon PNG
C-d'Ivoeir
Colomb Sing* HK* Other
World countries
E
x
por
t (
'000 t
onnes
)
1999 2000 2001 2002 2003
Figure 1.5: World major exporter of palm oil, including re-exporting country (*)
ing d
r of planting. The yield will then increase at a low increment until the enty-fifth year. From our exploratory study on modelling practices, little work has been re
t
ar Source: Oil World (December 12, 2003), Oil World Annual (1999-2003)
1.4 PROBLEM DESCRIPTIONS
The problem in modelling oil palm yield growth is that it does not follow a linear model. It normally follows a nonlinear growth curve. In modelling a nonlinear curve, the complexity of the problem increases with the increase in the number of independent variables. The function of a growth curve has a sigmoid form, ideally its origin is at (0,0), a point of inflection occurring early in the adolescent stage and either approaching a maximum value, an asymptote or peak and falling in the senescent stage (Philip, 1994). Normally, oil palm can be harveste after three years of planting. The oil palm yield will increase vigorously until the tenth yea
tw
ported on modelling the oil palm yield growth (Corley and Gray, 1976).
regression. This model is used to investigate the causal effect of the independent variables to the dependent variable. The literature shows that the foliar nutr
composition can be used as an indicator to estimate the oil palm yield. Nevertheless the foliar nutrient composition is also dependent on several factors, such as climate, soil nutrients, fertilisers, pest and diseases, but little had been done on modelling these factors. This study explores the possibility of improving the model but in particular, in improving the level of accuracy it can produce. The proposed model should give smaller error values than previous model (Multiple Linear Regression, MLR).
ient
actors e
a lationship between the response variable (oil palm yield) and the four fertiliser us (P), potassium (K) and magnesium (Mg). The expected yield can be described as a continuous function of the applica
r
sers f ried may still be estimated.
whether the solution gives a maximum, minimum or saddle point of the sponse curve. From our exploratory study on the use of response surface analysis,
ther le. This study will propose to use
g
The response surface analysis is the technique used to model the relationship between the response variable (Fresh Fruit Bunch yield, FFB) and treatment f
(fertilisers). The factor variables are sometimes called independent variables and ar subject to the control by the experimenter. In particular, response surface analysis also emphasises on finding a particular treatment combination, which causes the maximum or minimum response. For example, in the oil palm industry there is re
treatments, namely nitrogen (N), phosphor
tion level of fertiliser used. A continuous second-degree-function (N2, P2, K2 or Mg2) is often a sufficient description of the expected yield over the range of facto levels applied (Verdooren, 2003). If the fertiliser application rates are greater or smaller than the optimum application rate it may result in reduced yields. Fertili are wasted if the amount applied is more than the optimum rate. The advantage o this technique is that the effects of treatment combinations that have not been car out in the experiment
The use of response surface analysis is necessary to obtain the optimum level of fertiliser requirements. In response surface analysis, the eigenvalues will
determine re
e is no solution if the stationary point is a sadd
1.5 RESEARCH OBJECTIVES
Even though Malaysia is the largest producer of palm oil in the world, studies
a recent phenomenon for decades. Literature reviews on research onducted in this field are confined to simple models. The oil palm industry is urrently under going a structural change and is becoming more complex due to
chnological advances, agricultural management, product demand and planting
l
We further refine the objectives as follows:-
To study current modelling and estimating practices in the oil palm industry. To explore and propose the best model for oil palm yield growth.
of neural network to model oil palm yield. To optimise fertiliser level which will generate optimum yield.
d
.6 SCOPE OF THE STUDY
s on modelling yields have been very limited. The modelling of Malaysian oil palm yield has been
c c te
areas (Teoh, 2000).
This research is an attempt to present a proper methodology for modelling oi palm yield. The model may then be used for estimating and managing the oil palm industry.
• •
• To explore the use
•
These objectives will be achieved by following the research framework as presente in Figure 1.6.
1
1.6.1 Data Scope
For modelling oil palm yield growth data used in this study is secondary data taken from research done by Foong (1991; 1999). The research was conducted at Serting Hilir in Negeri Sembilan with relatively wet weather. The annual rainfall in this area is between 1600 mm to 1800 mm with two distinct droughts in January to March and June to August. The data used here is the average fresh fruit bunches (tonnes/hectare) from 1979 to year 1997.
The Malaysian Palm Oil Board (MPOB) provided us with a data set taken from several estates in Malaysia. The factors included in the data set were foliar composition, fertiliser treatments and FFB yield. The variables in foliar composition include percentage of nitrogen concentration N, percentage of phosphorus
Research Design Review
Secondary DATA GATHERING MPOB Data
DATA MINING
DATA ANALYSIS
MODELLING
Oil Palm Yield Foliar Composition Fertiliser Data Growth Data
Nonlinear Growth Response Surface Curve Analysis
MLR RMR Neural Network
Goodness of Fit Testing
No
Yes
Comparative Study No
Yes Oil Palm Yield Model
1.6.2 Model Scope
This study will confine the scope of models, namely the nonlinear growth model (NLGM), multiple linear regression (MLR), robust M-regression (RMR), response surface analysis (RSA) and neural network (NN) models. The nonlinear growth model will be used to model the data of oil palm yield growth. Using foliar analysis data we employ the multiple linear regression and robust M-regression to estimate the oil palm yield. In the MLR model the independent variables are N, P, K, Ca and Mg concentration (or as we call it, major nutrient component, MNC) and the dependent variable is fresh fruit bunches (FFB) yield. Aside from MNC
concentration, we also introduce the use of nutrient balance ratio (NBR), critical leaf phosphorus concentration (CLP), total leaf basis (TLB), deficiency of K (defK) and deficiency of Mg as independent variables in the second part in MLR. In MM regression we only consider N, P, K, Ca and Mg concentration as independent variables and FFB yield as the dependent variable.
We propose the use of the neural network to model oil palm yield. The discussion on the selection of neural network architecture and some statistical analysis will be given in Chapter 6. Chapter 7 will describe the use of response surface analysis to obtain the optimum fertiliser rate to produce an optimum FFB yield. Following this is a simple economic analysis to select the best combination of fertilisers input that generates the maximum profit.
1.6.3 Statistical Testing Scope
In this study we considered several statistical tests. They are the error model, sum of squares error (SSE), root mean squares error (RMSE), determination
coefficient (R2), coefficient of correlation (r), t-test, F test and chi-square test. The discrepancy between the predicted value from the model fitted, yˆiand actual value yi
is used to measure the model goodness of fit. The difference between the actual and the estimated value as known as the model error, and can be written as follows;
where ei is the model error in observation i. yi is the actual observation i, and i is
the estimated value at i observation. If the model performance is ‘good’, the model error will be relatively sm
yˆ
all.
)
(ii) Mean Squares Error, MSE =
For the purposes of measuring the accuracy of model fitting, we consider the four measurements commonly used in any research on model fitting. Namely sum squares error, root mean squares error, determination coefficient R2 and correlation coefficient. All formulas are given below;
(i) Sum Squares Error, SSE =
∑
(
, i = 1, 2,…, n= − n 1 i 2 i i yˆ y
(
)
n y y ni∑=1 i− i 2
ˆ
, i = 1, 2,…, n
(
)
n yˆ y n 1 i(iii) Root Mean Squares Error, RMSE =
2 i i
∑
= −2,…, n
(iv) Determination of coefficient, R2 = 1-
, i = 1,
(
)
(
)
2n n 1 i 2 i i yˆ y
∑
= −, i = 1, 2,…, n
1 i i y y
∑
= − and(v) Coefficient of correlation, r =
∑
= i − − n i i y Var x Var y y x x
1 ( ) ( )
) )( (
, i = 1, 2,…, n
where y observed value, yˆ predicted value, n number of observation, xand yare the me
xplain ation coefficient is used to identify the strength of the relationship between any two variables.
In the case of more then two samples, one-way analysis of variance (anova) can be used to test the different between the groups using F-test. The anova F-test is
an of xi observation and yi observation, respectively, var(x) is the variance of X
calculated by dividing an estimate of the variability between the groups by the variability within the groups;
F =
ups ithion gro Variance w
ups etween gro Variance b
A high value of F, therefore, is evidence against the null hypothesis of equality of all population means. If the test shows the mean difference between groups to be
tatistically significant, the Multiple Duncan test can be used to examine which
groups
e-h
The model performance will be measured using sum squares error, mean quares error, mean absolute, root mean squares error, mean absolute percentage
d coefficient of correlation.
n
nts
s te
in
and differs for each experiment. We study urteen experimental stations (including Peninsular Malaysia and East Malaysia), seven s
s
are different to each other (Montgomery, 1991). Another alternative to on way analysis of variance is the Chi-square test, which is a nonparametric test whic can be used when assumption of normality is not needed.
s
error, coefficient of determination an
1.7 DATA GATHERING
The Malaysian Palm Oil Board (MPOB) provided data from the MPOB database of oil palm fertiliser treatments, which have been carried out from fourtee oil palm estates. All the data from each estate has been collected, recorded and compiled by MPOB researchers in the Research Database Center. All treatme were based on a factorial design with at least three levels of N, P and K fertiliser rates. Although different types of fertiliser were used in the treatments, the rate quoted in the final analysis will be equalized to the amounts of ammonium sulpha (AS), muriate of potash (KCI), Christmas Island Rock Phosphate (CIRP) and kieserite (Kies). Cumulative yields obtained over a period of two to five years each trial were analyzed. The data of this study is experimental basic and was collected for a certain period of time
fo
Fresh fruit bunches (FFB) yield data used in this study was measured in tonnes per hectare per year or the average of FFB yield in one year. Foliar analysis was only done once a year and the samples are taken either on March or July every year. For example, if this year foliar analysis conducted in July, the next sample also conducted in July next year, and so on. The type of FFB yield data and foliar
nalysis data is continuous, and a fertiliser input is in coded form (0, 1, 2, and 3). If code data is needed, the coded value will be recoded to the exact value (Appendix
analysis procedure is presented in section 1.8.
and s
) deficiency may be the result of a lack of Mg in the soil or due to ect with excessive K levels or both of these conditions. It also shows hidden
f sampling the appropriate frond is correctly sampled for each leaf sampling unit (LSU). Frond 17 is sampled from the labeled reference LSU palm in
some o ll
a re
B). The detail of the leaf
1.8 LEAF ANALYSIS
The best method of determining the kind and amount of fertiliser to apply to fruit trees is by leaf analyses. It effectively measures macro and micronutrients indicates the need for changes in fertiliser programs (Cline, 1997). Leaf analyse integrate all the factors that might influence nutrient availability and uptake. The essentials of macronutrients to oil palm tree were listed in Appendix C. However, leaf analysis indicates the nutritional status of the crop at the time of sampling (Pushparajah, 1994). It also shows the balance between nutrients for example, magnesium (Mg
antagonistic eff
or incipient deficiencies. Adding N, for example, when K is low may result in a K deficiency because the increased growth requires more K (Fairhurst and Mutert, 1999).
The leaf analysis was conducted to determine the nutritional status of leaflets from frond 9 on immature palms and frond 17 on mature palms (Corley, 1976). This is conducted to assist the preparation of annual fertiliser programmes. In each nominated lea
stages to prevent sample contamination and sampling time between 6.30 am and 12.00 noon.
A frond 17 is identified by counting from the first fully open frond in the center of the crown (frond 1) (and moved three steps downward (frond 1, 9, 17) with the same stack) and removed with a sickle. The frond is cut into approximately thre equal sections (to get the average of the nutrient concentration). The top and ba sections are discarded and placed in the frond stack. Twelve leaflets are selected an
e se
d moved from each frond. Six leaflets are cut from each site at the mid-point of the frond s
e 20-30 cm id-section; it is not necessary to wash the leaves. The mid-rib of each leaflet’s
section re
e
leaflets are placed in a labeled plastic bag. Half of the ample retained as a backup for future reference (stored in a cool, dry place) while
the oth ry are
s. re
ection (Corley, 1976). Ensure that the 12 leaflets comprise of three from the upper rank and three from the lower rank from each side of the rachis. The leaflets samples from each field (or smaller area if required) are put together in a large labeled plastic bag. About 500 leaflets are collected from each field of 30 hectare.
The samples are then sent to the estate laboratory or sample preparation room for further preparation. The leaflets are bundled and trimmed to retain th
m
is removed and discarded. The remaining parts of the leaflet’s (lamina) a then cut into small pieces 2 cm long and placed on aluminium trays to be dried. Th leaflets are dried in a fan-assisted oven for 48 hours (650C) or 24 hours (1050C). The leaf N concentration will be reduced if the temperature exceeds 1050C.
After drying, the s
er is submitted for analysis. The LSU sample results from the laborato then formatted as a spreadsheet and the variability is calculated. Leaf samples are analyzed for N, P, K, Ca and Mg. Other nutrients may be included for palms planted on particular soil types.
Because of the synergism between nitrogen (N) and phosphorus (P) uptake, leaf c
chs, 1981). This is due to the constant ratio between N and P in protein compounds found i
39 oncentration must be assessed in ratio to leaf N concentration (Ollagnier and O
n plant tissue (Fairhurst and Mutert, 1999). A critical curve has been developed where CLCp is defined as;
Critical Leaf P concentration, CLCP = 0.0487 x Leaf N concentration + 0.0
A different approach to determine whether potassium (K) and magnesium (Mg) are deficient taking into account the relative concentrations of the leaf cations
,
00 K Mg and calcium (Ca). First, the total amount of bases in leaf (TLB) is calculated and K and Mg are assessed as a percentage of TLB (Foster 1999). TLB can be derived from equation below;
TLB (cmol/kg) = (% leaf K/39.1 + % leaf Mg/12.14 + % leaf Ca/20.04) x 10
roughly, K and Mg deficiency can then be assessed individually, based on their percentage of TLB. The deficiency of K and Mg can then be obtained
as ⎟x100
⎠ ⎞ ⎜ ⎝ ⎛
TLB X
, where X is partial to TLB of K and Mg. The K and Mg deficiency can be rated into three categories; If the value is below than 25 the rating is
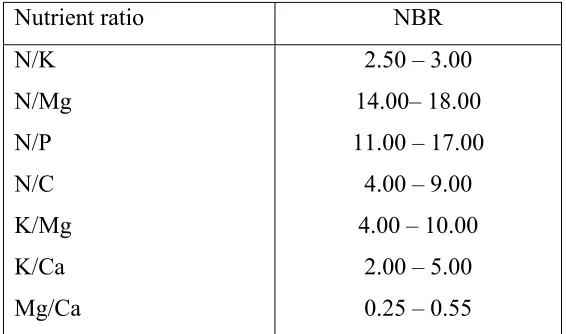
deficient, a low rating is between 25 to 30 d a rating more than 30 is considered sufficient. Nutrient Balance Ratio, NBR is defined as the ratio between the foliar nutrient composition and another foliar nutrient composition. For example, the NBR between N and K in foliar, is defined as the ratio between N and K concentration. The range of the NBR values for oil palm presented in Table 1.1.
Table 1.1: The op value of nutrient balance ratio (NBR) for foliar analysis
nt ratio timum
Nutrie NBR
N/K 2.50 – 3.00
N/Mg N/P N/C
K/Ca
14.00– 18.00 11.00 – 17.00 4.00 – 9.00 4.00 – 10.00
2.00 – 5.00 K/Mg
Mg/Ca 0.25 – 0.55
1.9 RESEARCH IMPORTANCE
The nonlinear growth models are used in modelling the nonlinear
henomenon. Since the nonlinear growth model has not yet been explored in oil palm in
l
ss
the
r the additional relevance of the independent ariable to the model. In these sense, multiple linear regression is rather flexible. Our stu
rly all p
dustry (Foong, 1999 and Ahmad Tarmizi et al., 2004), we proposed the use of the nonlinear growth model in the oil palm yield growth study. Here we wil provide some mathematical basis in parameter estimation for modelling oil palm yield growth. Then from the results and analysis we can study the biological proce of oil palm yield growth.
Multiple linear regression can be used to find the relationship between dependent variable and the independent variable. There can be more than one independent variable, which allows fo
v
To improve the models, there are various new heuristic methods suggested in this literature. We explore the flexibility of the neural network to improve the
timated performance and the model’s accuracy. Previous studies in oil palm topped when the stationary point was saddle (Ahmad Tarmizi, 1986). This caused
id not make allowances for the possibility an incomplete inference from the model aused difficulties in implementing improvements in practice outcomes. This study proposes the use of ridge analysis whe
0
is study. Since it is an area of high
cate
•
• ural networks model to predict the oil palm yield and NN
•
The findings indicated that the combination activation and number
This study investigates the effects of outliers on NN performance. The findings
The response surface analysis when combined with the ridge analysis was used to obtain the optimum level of foliar nutrient composition and fertiliser input to produce optimum oil palm yield.
es s d
than produce inefficient decision. It also c
n the stationary point is saddle to improve data analysis.
1.1 RESEARCH CONTRIBUTION
There are many contributions in th
importance for the sustainability of the oil palm industry, the contributions can be gorized as follows;
• Identifying several nonlinear growth models for oil palm yield growth. The investigation on the relationship between foliar nutrient composition and yield was conducted using MLR and RMR. A practical model and procedure were developed for this purpose.
Development of ne
results more reliable compared with the MLR and RMR models.
This study proposes statistical testing to evaluate the factors that influence NN performance.
of hidden nodes have a significant effect on the NN performance. However, the learning rate, momentum term and number of runs do not give any effect on the NN performance.
•
show that percentage-outliers and magnitude-outliers significantly affect the NN performance.
Several of the contribution demonstrated above has been published in various form as desc
1.11 HESIS ORGANISATION
f description on the usage of the data in this research.
in several fields, such as economic, management and gronomy. A summary is included at the end of the chapter.
e neural networks model. This chapter also proposes e research framework
yield e partial
and
Chapter 5 discusses the development of multiple linear regression and robust M-regression to investigate the relationship between fresh fruit bunch and the nutrien
re ribed in Appendix D
T
This thesis contains eight chapters. Chapter 1 is the introduction. This chapter gives an introduction to the problem’s description, research objectives, research scopes, research importance, research data and a brie
Chapter 2 is the Literature Review. This chapter contains a discussion on the current and past research on oil palm yield. Here we present the application of neural network modelling
a
Four main models used in the thesis are explained in Chapter 3. It discusses the statistical methods such as nonlinear growth models, multiple linear regression, response surface analysis and th
th
In Chapter 4 the use of the nonlinear growth curve to model the oil palm growth is considered. Twelve nonlinear growth models are presented and th derivative for each models are provided. Comparisons among the model is done given at the end of the chapter.
Chapter 6 presents the development of neural network to oil palm yield modell
al ss of fit and model accuracy.
umerical results of the foliar nutrient composition and fertiliser treatments perform
simple economics analysis to generate the optimum rtilisers level in order to maximise the profit.
Chapter 8 concludes the relevant and important findings from this research. ecommendations on areas related to the findings and possible directions for future
search are presented.
ing. The experimental design is conducted to investigate the effect of the number of hidden nodes, the number of runs, momentum terms learning rate and outliers data to the NN performance. The results and conclusion of model selection have been carried out. The results from multiple regression analysis and neur network model are compared in terms of goodne
N
ed by response surface analysis are reported in Chapter 7. The use of ridge analysis is discusses to overcome the ‘saddle point’ problem at the stationary point. This chapter ends with a
fe
ience, 26(2): 165-176. Ahmad Tarm
berkesan. Prosiding Persidangan Kebangsaan Pekebun Kecil Sawit 2002:
Ahmad
. No. 22.
t and validation of PORIM fertilizer
17.
Ahmad at and Ariffin
Ahmad Tarmizi Mohammed, Zin Zawawi Zakaria, Mohd Tayeb Dolmat and Ariffin Darus (2004). Oil palm fertilizer programme: A proposal for higher yield. Presented in Mesyuarat Plan Tindakan MPOB dan RISDA, at Prime City, Kluang.
Ahmad Tarmizi Mohmmed, Zin Zawawi Zakaria, Mohd Tayeb Dolmat, Foster, H. L., Hamdan Abu Bakar and Khalid Haron (1991). Relative efficiency of urea to sulphate of ammonia in oil palm: Yield response and environmental factors. Proceedings of the 1991 PORIM International Palm Oil Conference-
Alder, prediction. Yield Prediction,
vol. 2, FAO Forestry Paper 22/2.
REFERENCES
Adam, J. B. (1999). Predicting pickle harvest using a parametric feedforward neu network, Journal of Applied
ral
Sc
izi Mohammed and Wahid Omar (2002). Pembajaan sawit yang
Strategi Ke Arah Pengukuhan dan Hala Tuju Sektor Pekebun Kecil Sawit. Tarmizi Mohammed, Foster, H. L. Zin Zawawi Zakaria and Chow C. S. (1986). Statistical and economic analysis of oil palm fertilizer trials in Peninsular Malaysia between 1970-1981. PORIM Occasional Paper
Ahmad Tarmizi Mohammed, Hamdan Abu Bakar., Mohd Tayeb Dolmat and Cha K. W. (1999). Dev
n elopmen
recommendation system in Malaysian oil palm cultivation. Proceedings of the 1999 PORIM International Palm Oil Congress (Agriculture). 203-2 Tarmizi Mohammed, Zin Zawawi Zakaria, Mohd Tayeb Dolm
Darus (2004). Oil palm fertilizer programme: A proposal for higher yield.
Presented at Mesyuarat Plan Tindakan MPOB dan RISDA, February, 10 2004, at Kluang.
Agriculture. 340-348.
Amer, F. A. and Williams, W. T. (1957). Leaf area growth in Pelargonium Zonale,
Ann. Biot. 21, 339.
Amstrong, J. S., Brodie, R. J. and McIntyre, S. H. (1987). Forecasting methods for
Anderson, V. L. and McLean, R. A. (1974). Design of Experiments: A Realistic Approach. New York: Marcel Dekker, Inc..
Andrew, D. F. (1974). A robust method for multiple linear regression.
Technometrics, 16: 523-551.
s,
aylor, John
rnal of Science and Technology, 12(1): 1-10.
nen utama dalam menganggar harga minyak sawit mentah.
Azme K ear growth
Azme K
atika, 19(1): 59-70.
Bansal, A, Kauffman, R. and Weitz, R. (1993). Comparing the modeling performance of regression and neural networks as data quality varies: A business value approach. Journal of Management Information System, 10: 11-32.
Barnett, V. and Lewis, T. (1995). Outliers in Statistical Data. England: John Wiley & Sons,
Bass, F. M. (1960). A new product growth model for consumer durables.
Management Science, 15: 215-227.
Bates, D. M. and Watts, D. V. (1988). Nonlinear Regression Analysis and its Applications, New York: John Wiley.
marketing-review of empirical research. International Journal of Forecasting, 3: 355-376.
Angstenberger, J. (1996). Prediction of the S and P 500 Index with Neural Network 43-152, Neural Networks and their Applications, edited by J. G. T
Wiley and Sons, Inc.
Azme Khamis and Mokhtar Abdullah (2004). On robust environmental quality indices. Pertanika Jou
Azme Khamis and Zuhaimy Ismail (2003). Perbandingan di antara regresi berganda dan regresi kompo
Prosiding Seminar Kebangsaan Sains Matematik Ke XI, 22-24 Disember 2003.
hamis and Zuhaimy Ismail. (2004). Comparative study on nonlin curve to tobacco leaf growth data. Journal of Agronomy, 3(2): 147-153.
Becker, R. A., Chambers, J. M. and Wilks, A. R. (1988). The New S Language. Wadsworth, Pacific Grove, CA.
Belanger, G., Walsh, J. R., Richards, J. E., M. P. H. and Ziadi, N. (2000).
nse to
Bewley in
2.
Bishop gnition, Oxford University
Boussabaine, A. H. and Kaka, A. P. (1998). A neural networks approach for cost flow forecasting. Construction Managemant and Economics. 16: 471-479. Box, G. E. P. and Draper, N. R. (1987). Empirical model building and response
surfaces, New York: John Wiley & Sons.
Causton, D. R. and Venus, J. C. (1981). The Biometry of Plant Growth, London: Edward Arnold,
ve es. The Bell
Chan, K an, M. A. and Basiron, Y. (2003). Climate change and
ngs of the 1991 PORIM International Palm Oil Conference-
Chan. K fertilizer management in oil palm.
Chatterjee, S. and Price, B. (1991). Regression Analysis by Example. 2nd Edition. New York: John Wiley and Sons, Inc.
Chin, S. A. (2002). Narrowing the yield gap in oil palm between potential and realization. The Planters, 78(919), 541-544.
Comparison of three statistical models describing potato yield respo nitrogen fertilizer. Agronomy Journal. 92: 902-908.
, R. and Fiebig, D. 1988. Flexible logistic growth model with application telecommunications. International Journal of Forecasting. 4: 177-19 Birkes, D and Dodge, Y. (1993). Alternative Methods of Regression. New York:
John Wiley and Sons, Inc.
, C. M. (1995). Neural Networks for Pattern Reco
Press.
Chaddha, R. L. and Chitgopekar, S. S. (1971). A generalization of the logistic cur and long range forecast (1966-1981) of residence telephon
Journal of Economics and Management Science, 2: 542-560. . W, Wahid, M. B., Ng
its effects on Yield of Oil Palm. Proceedings of International Palm Oil Congress: Agriculture Conference: 237-260.
Chan, K. W., Lim K. C. and Ahmad Alwi (1991). Fertilizer efficiency studies in oil palm. Proceedi
Agriculture. 302-311.
. W. (1999). System approach to
Chow, C. S. (1984). Forecast of Malaysian palm oil production up to year 2000.
Proceedings of Int. Seminar on Market Development for Palm Oil Products
31-47.
.
re: 46-52.
nd Prospects: Agriculture. 46-55.
ger-Verlag.
Connor ,
ent in
Corley
J. and Wood, B. J. (1976). Oil palm research: Development in crop
Corley ., Haron,
nt in crop
Corley otassium
Corne, S. A., Carver, S. J., Kunin, W. E., Lenon, J. J. and van Hees, W. W. S.
grating GIS and
Needs.
Chow, C. S. (1987). The seasonal and rainfall effects on palm oil production in Peninsular Malaysia. Proceedings of 1987 Oil Palm Conference – Agricultu
Chow, C. S. (1988). The seasonal and rainfall effects on palm oil production in Peninsular Malaysia. Proceedings of the 1987 International Oil Palm/Palm Oil Conference: Progress a
Christensen, R. (2001). Advanced Linear Modeling. Multivariate, Time Series and Spatial Data; Nonparametric Regression and Response Surface
Maximization. New York: Sprin
Cline, R. A. (1997). Leaf analyses for fruit crop nutrition. Horticultural Research Institute of Ontario.
, D. (1988). Data transformation explains the basics of neural networks. EDN
33(10): 138-144.
Corley, R. H. V. and Gray, B. S. (1976). Growth and morphology. In Corley, R. H. V., Haron, J. J. and Wood, B. J. (1976). Oil palm research: Developm crop science (1). Elsevier Scientific Publishing Company. 7-21.
, R. H. V. (1976). Photosynthesis and productivity. In Corley, R. H. V., Haron, J.
science (1). Elsevier Scientific Publishing Company. 55-76.
, R.H.V. (1976). Physiological aspect of nutrition. In Corley, R. H. V J. J. and Wood, B. J. (1976). Oil palm research: Developme
science (1). Elsevier Scientific Publishing Company. 157-164. , R.H.V. and Mok, C. K. (1972). Effects of nitrogen, phosphorus, p
and magnesium on growth of oil palm. Expl. Agri. 8: 347-353.
(2000). Using neural network methods to predict forest characteristics in southeast Alaska. 4th International Conference on Inte
Corne, S. Kneale, P., Openshaw, S. and See L. (1998). The use and evaluation of artificial neural networks in flood forecasting.
http://www.ccg.leeds.ac.uk/simon/maff98.htm.
ional classifier for machine vision
Depart of Statistics, Malaysia, 1975 – 1989. Kuala Lumpur, Malaysia.
ta.
Drumm
AE
Drumm ).
ical and neural network methods for site-specific yield prediction. Deck, S. H., Morrow, C. T., Heinemann, P. H. and Sommer, H. J. (1995).
Comparison of a neural network and tradit
inspection of potatoes. Applied Engineering in Agriculture, 11: 319-326. ment
Donaldson, R. G., Kamstra, M., and Kim, H. Y. (1993). Evaluating alternative models for conditional stock volatility: Evidence from international Da
Working Paper, University of British Columbia.
Draper, N. R. and Smith. H. (1981). Applied regression analysis. New York: John Wiley and Sons,
ond, S. T. Sudduth, K. A. and Birrell. (1995). Analysis and correlation methods for spatial data. ASAE Paper No. 95-1335. St. Joseph, Mich.: AS
ond, S. T., Sudduth, K. A., Joshi, A., Birrell, S. J. and Kitchen, N. R. (2002 Statist
http://www.nal.usda.gov/ttic/tektran/data/000013/14/0000131434.html
Epstein w
Farazd and cop yield. Nature, vol.
Fausett Architectures, Algorithms, and
Fekedu timation
Foong, otential evapotranpiration, potential yield and leaching losses
Oil
, E. (1972). Mineral nutrition of plants: principle and perspectives. Ne York: Wiley.
Evan, O. V. D. (1997). Short-term currency forecasting using neural networks. ICL System Journal. 11(2).
Fairhurst, T. H. and Mutert, E. (1999). Interpretation and management of oil palm leaf analysis data. Better Crops International. 13(1): 48-51.
aghi, H. and Harris, P. M. 1968. Plant competition 217: 289-290.
, L. (1994). Fundamentals of Neural Networks: Applications. Prentice-Hall, Inc.
legn, D., Mac Suirtain, M. P. and Colbert, J. J. (1999). Parameter es of nonlinear growth models in forestry, Silva Fennica 33(4): 327-336. F. S. (1991). P
Foong, F. S. (1999). Impact of moisture on potential evapotranspiration, growth and yield of palm oil. Proceedings of the 1999 PORIM International Palm Oil Congress (Agriculture): 265-287.
Foong, S. F. (2000). Faktor yang menentukan pengeluaran hasil dan mempengaruhi potensi hasil sawit. Modul Kursus Pengurusan Ladang untuk Pengurus FELDA.
nd Sustainable
Foster, on system for oil palm.
and
oil
rnational
Foster, H. L. and Chang, K. C. Mohd Tayeb Dolmat, Ahmad Tarmizi Mohammed and Zin Zawawi Zakaria (1985). Oil palm yield responses to N and K
r No. 16. Palm Oil Research Institute of Malaysia Kuala
Foster, . (1987). Foliar
Foster, ngh. (1987). The effect of
ure:
294-ork: John Wiley and Sons. Foster, H. (2003). Assessment of oil palm fertilizer requirements. . In Thomas
Fairhust and Rolf Hardter, Oil Palm Management for Large a Yields. PPI, PPIC and IPI.
H. L. (1995). Experience with fertilizer recommendati
Proceedings of 1993 PORIM International Palm Oil Congress – update vision (Agriculture): 313-328.
Foster, H. L. and Chang, K. C. (1977). The diagnosis of the nutrient status of palms in West Malaysia. In Earp, D. A. and Newall, W. (eds.). Inte
Developments in Oil Palm. Malaysian International Agricultural Oil Palm Conference, Kuala Lumpur. 14-17 June 1976. ISP, 290-312.
fertilizers in different environments in Peninsular Malaysia . PORIM Occasional Pape
Lumpur.
H. L., Ahmad Tarmizi Mohammed and Zin Zawawi Zakaria diagnosis of oil palm in Peninsular Malaysia. Proceedings of 1987 International Palm Oil Conference – Agriculture: 249-261.
H. L., Mohd Tayeb Dolmat and Gurmit Si
fertilizers on oil palm bunch components in Peninsular Malaysia.
Proceedings of 1987 International Palm Oil Conference – Agricult
305.
Franses, P. H. and Homelen, P. V. (1998). On forecasting exchange rate using neural networks. Applied Financial Economics. 8: 589-596.