Scholarship at UWindsor
Scholarship at UWindsor
Electronic Theses and Dissertations
Theses, Dissertations, and Major Papers
5-1-1973
Effect of road noise on certain aspects of driver's performance.
Effect of road noise on certain aspects of driver's performance.
Robert Luiz
University of Windsor
Follow this and additional works at:
https://scholar.uwindsor.ca/etd
Recommended Citation
Recommended Citation
Luiz, Robert, "Effect of road noise on certain aspects of driver's performance." (1973). Electronic Theses
and Dissertations. 6885.
https://scholar.uwindsor.ca/etd/6885
This online database contains the full-text of PhD dissertations and Masters’ theses of University of Windsor students from 1954 forward. These documents are made available for personal study and research purposes only, in accordance with the Canadian Copyright Act and the Creative Commons license—CC BY-NC-ND (Attribution, Non-Commercial, No Derivative Works). Under this license, works must always be attributed to the copyright holder (original author), cannot be used for any commercial purposes, and may not be altered. Any other use would require the permission of the copyright holder. Students may inquire about withdrawing their dissertation and/or thesis from this database. For additional inquiries, please contact the repository administrator via email
I ’'•*
1
" N a t io n a l
LIBRARY
O T T A W A
BIBLIOTH^QUE NATION ALE
O T T A W A
NAME OF AUTHOR...
^ Z
.\
. ^ e r t
'...^ ...
TITLE OF THESIS
Effect of road noise on certain aspects
of driver’s performance.
UN
i v e r s i t y.qf .Wipdsw, .Wiud^Qf, .Qutsrio___
d e g r e e f o r w h i c h t h e s i s w a s p r e s e n t e d
th Jh ? <r*...
'YEAR THIS DEGREE GRANTED... ^ 7 3 ...
4 Permission, is hereby granted to THE NATIONAL LIBRARY
OF CANADA to microfilm this thesis and to lend or sell copies
of the film.
The author
r e s e r v e sother publication rights, and
neither the thesis nor extensive extracts from it may be
r ' •
,
printed or otherwise reproduced without the author’s
written permission.
DATED.
NL-91 (10-68)
(Signed).
PERMANENT ADDRESS:
. . . 5 * . . . & # . . .
...
iVrVor?'.
S M
.
__
..1973
ON
CERTAIN ASPECTS OF DRIVER'S PERFORMANCE
' A THESIS
Presented in Partial Fulfilment of the Requirements for the Degree of
Master of Applied Science
at the
University of Windsor
by
ROBERT LUIZ
Faculty of Applied Science University of Windsor
May, 1973.
>
/
4
3
73
72
■* « I
I I
A p p r o v e d by
The effect of road noise on performance time in a simulated V
driving task has been studied. A simulator, which comprises of the front half of a car enclosed in a wooden frame and a road movie projected from the rear on a screen which is placed in front of the driver was used. The
' \
simulated driving task was performed by 2 2 subjects at three different I
road speeds, i.e. 30, 40, and 50 miles per hour and under three different
•
road noise levels, i.e. 80, 90, 100 dB. Experimental results indicate that noise does affect the performance time. Subject's age and driving experience were not found to be significant variables in the study.
/
• • ,/
• i '.I
I V
V
/
o
ACKNOWLEDGEMENTS
The author takes this opportunity to express his appreciation to Dr. A. Raouf for his guidance, encouragements and inspiration in completing
this thesis.
----The author also extends h i s appreciation to all committee members, especially Prof.jN. G. Eley for his guidance, suggestions and wholehearted participation in the experiment.
Sincere thanks to Hr. L. Cory of Electronics Research Shop and Mr. 0. Brudy of Mechanical Research Shoj? for allowing me to use their facilities in order to build the essential components for.the Simulator.
The author further wishes to thank Hr. S. McDowal,l o.f^ChrySler .Company for providing a truck for taking road film and to Mr. F. Daws
for driving the truck while the author shot the film.
Gratitude is also due the subjects for their patient participation in conducting the experiment.
Finally, the author wishes to express his greatfulness to his wife, for her financial and moral supports which made-this work possible.
ABSTRACT. I V
ACKNOWLEDGEMENTS.
LIST OF FIGURES.
A
LIST OF TABLES. I X
1. INTRODUCTION.
2. LITERATURE S U R V E Y ... 2.1 Performance Time 2.2 Why Simulator?...
3 7
11
3- EXPERIMENTAL SET UP - THE SIMULATOR... 3.1 The Half C a r ... ...
.
i •
•
:
3.2 Rear Projection S c r e e n ... 3.3 Projector, Road Film and Turn Table, 3.4 Mechanical Direction Se l e c t o r ... 3.5 Electronic Control C i r c u i t s ... . 3.6 Road Noise and Tape Recorder... 3.7 Sound Level M e t e r ... . 3.8 Multipen Recorder ... ■,
."'i .to. •Ak.*,'.
V '
12 12 13 13 14 14 16 17 17
V I
\
PAGE 4.1 Experimental Procedure and Methods^ of Data Collection... 20 4.2 Data C o l l e c t i o n ... 21
5. ANALYSIS OF D A T A ... . . ' 31 V"
6 . FINDINGS AND CONCLUSIONS ... 35
36 6.1 Findings
6.2 Conclusions.'.
6.3 Suggestions for Further Study
APPENDIX A Sound Pressure Level...,
Some facts
APPENDIX iout sound
Some noise levels recorded form a parked car
41
43
43 "I .
3. How much noise we m a k e ... 44
APPENDIX C Side Shift Mag n i t u d e ... '... '___ 46 / APPENDIX D Questionnaire... . 48
APPENDIX E Chart S a m p l e s... ... ... 50
£
APPENDIX F Schematic Diagrams ... «■... . 67
APPENDIX G Computer Program and P r i n t o u t s ... 76 i
APPENDIX H Graphs - Performance Time vs Noise L e v e l s ... 123
B IBLIOGRAPHY... 135 VI T A A U C T O R I S ... * ... 139
vii
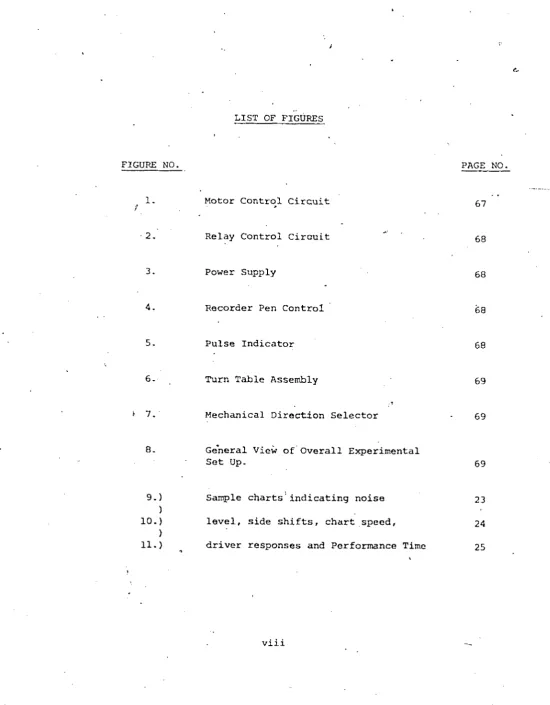
FIGURE NO. PAGE NO.
1- Motor Control Circuit 5 7
• 2. Relay Control circuit "* gg
3- Power Supply gg
4. Recorder Pen Control gg
5. Pulse Indicator $ 8
6- Turn Table Assembly 6 9
.t
^ 7. Mechanical Direction Selector - 69
8- General View of Overall Experimental
Set Up. gg
9.) Sample charts'indicating noise 23
)
( 1 0.) level, side shifts, chart speed, 24
)
11.) driver responses and Performance Time 25
viii
4
f
V
TABLE NO. ' PAGE
1 Information on subjects 1 0
r
2 Performance Time Measurements for
all Subjects. 26
3. Effects of noise F - Ratio
and Percent Rise of P e r f o r m a n c e .
Time. 3 8
I X
INTRODUCTION
Researchers interested in studying human performance in man
machine systems agree that environmental factors such as temperature, noise and vibrations are factory influencing human performance. A Vehicular Transport System. (VTS) which is comprised of the driver, the vehicle, surr ounding traffic, and environment, is a special kind of man-machine system
(43). In this system the driver's behaviour encompasses sensory and perceptual p r o c e ^ . ^ x ' d p t ^ ^ p n making and psychomotor skills. Although,
the number of drivers killed while performing in VT S (56,000 annually in the U.S. alone) is considerably higher than industrial workers killed ■) while performing industrial tasks, one does not find many documented studies pertaining to the effects of environment on driver behaviour
In North America the automobile manufacturers are not only trying to minimize the after effects of accidents by providing seat belts, shoulder harness, padded dash boards, collapsable steering
columns, energy absorbing bumpers, and air bags, but aro also making'the .
* >
automobile very comfortable. Number of cars equipped withNflx conditioners is increasing every year. Air conditioners not only provide a controlled temperature inside the automobile, but also cut down "road and wind
noises" considerably. ■ "■
sufficiently investigated". Consequently present study in which subjects performed a simulated driving task under, various noiso levels and road speods was undertaken. The three noise levels selected for this study are similar to the noiso levels usually experienced in day to day city driving. Throe speed levels allowed for city driving wore 'selected for this study.
Using a tot$l of 22 subjects a randomized complete factorial ■a
experiment was performed on the simulator designed and built by the University of Windsor.
, The subjects selected for this study were holder's of the Ontario Drivers Licence. Data pertaining to their driving experience in terms of miles and years wore, obtained. Tests wore performed to determine the coefficients of correlation between the performance times and the number of years of experience and approximate total milage driven.
o
CHAPTER TWO a
Literature Survey
For many years scientists and engineers concerned with the design and operation of man-machine systems have b£en continuously working to improve ’safety, controls and comfort of the automobile. An automobile is an excellent example of a man-machine system, with which most people come into contact one time or another. Therefore, mechanical as well as electrical designs in an automobile should be combatable to the psychological and physiological characteristics of a driver- Learner (36) and Forbes
(24) directed their research work mainly towards establishing some criterion whf re by the efficiency of the individual driver or steering system can be measured and compared with each other. Laur, Suhr, and Allgair (35) suggest that better drivers turn the steering wheel less, use less gasoline, work the accelerator less, and are less severe o n brakes than the poor drivers. Literature suggest no absolute method to define driving performance, rather it depends on experimental conditions inposed restrictions, masked and unmasked parameters and many other related factors.
Factors such as reaction time, fatigue, glare, tenperature, alcohol, tracking behaviour, vibration and noise, have been the subjects for
researchers during the last few decades. Darret, Kobayashi_ /■■and pox, (3),
'
p
v ' T lconducted feasibility studies of a driver reactions to budden pfedfe(Strian
emergencies. Johansson and Rumar (33) tested 321 drivers for'their brake reaction times and found that every driver, male or female, has longer reaction time when signals occurred randomly. Further investigation by Davies and Watts reveals that:
(1) Foot movement time for females is 25% slower than males when both gas pedal and brake pedal are kept at the same l e v e l .
(2) - Foot movement time are the same for both male and female when the brake pedal was 6 inches higher
than the gas pedal. '
It is often assumed that simple reaction time and accidents are closely related. However, little is known to support this argument, mainly j>ecause of the difficulty to create or simulate genuine accidents in the laboratory. Albert Burg (14) compared the driving and accidents records of 769 drivers and summarized that milage, sex and age are factors influencing driving records.
Driving is usually a challenging experience. However, under normal conditions the driver can produce good or poor performances since he is
j
subjected to information feedback from road signs and is exposed to environ-mental conditions. When the drivers begin to tire he looses much of his attention to feedback. As a result he cannot track the vehicle as well as when he is alert. Even though most people w i l l be highly motivated to do their best when being tested,, researchers agree that driver fatigue will have effect on steering wheel reversals, speed change rates, and average speed of the vehicle. As drivers become fatigued he will accept
to measure fatigue of drivers over long driving intervals having steering wheel reversals as a measurement of driving performance and found, in general, more skilled drivers produced .lower steering wheel reversals. He catagorizes fatigue as:
(1) Subjective fatigue defined as the feeling of being tired.
S '
(2) Physiological fatigue as determined by bodily
change - ,
, • V
v
(3) Objective fatigue when performance of a task shows a ' progressive deterioration.
Temperature has been found to cause deterioration in a wide range of tasks including vigilance, and tracking. Pepler (45) concluded that tracking performance deteriorate as temperature increases. Lamburn-suggests that the most comfortable driving is when the temperature inside the car. is kept at 75°F,
Vibration in an automobile is considered to include the
oscillatory motion of the vehicle travelling over bumpy roads. Excessive
1'
vibrations have been found hajrmf ul to both human beings and a n i m a l s . Alcohol, carbon monoxide, tobacco smoke, drugs, produce poor attention, slower and less dependable response, less self control and deterioration in reaction time.
p n e of the factors which has not been explored sufficiently is the effect of noise on driver performance. It has been shown that
t
Experiments shows that high intensity high frequency noise has more adverse effect on performance than a low frequency high intensity noise. In the presence of noise the subject may loose task information because he is responding directly or indirectly to noise- Noise has generally been studied as a distracting stimulus and has been found to impair performance in psychoroeteric tasks. Both Morgan (42) and Ford demonstrated that
removal of noise has the same kind of decremental effect as the introduction of the same noise. Broadbent (11) found that high frequency noise gave more errors in performance and response time was slower at lower frequency. Sanders (52). noted that noise affects work - it affects increasingly
irregularity of response time rather than a general decrease in number of responses. Broadbent (38) showed that noise does produce a deliterious effect on ^performance task that are unpredictable with respect to time of occurance. However, Watkins (57) found that the detection performance was. substantially better when noise was presented during the observation ' intervals than when it was continuously present. Brown (12), on the
other hand, noted a beneficial effect of a group of subjects who drove through heavy and light traffic while listening to a recorded p rogram of music.
Thus literature does not indicate the effect of noise on the performance of a driver. Thus a study on this topic was. considered
desirable. The task was to select a proper parameter that represents the performance o f a driver and a meaningful measuring method to record
the quantitative results.
There has been considerable work done on response time and a *• * * brief survey of which is given below.
One of the interesting aspects of the stimulus - Response mechanism is that there is a definite time interval between the time
t'
when the stimulus is applied and the response it produces. This time interval, widly known as t h e Response Time, is neither the same for the same individual under different conditions nor the same for different individuals under the same conditions. It may be concluded that the Response Time is an index of an individual's independent characteristic, a parameter by which an individual's physiological and psychological characteristic may be measured.
A knowledge of Response Time leads us to a better understanding of the nature of the psychic activities, and their relationships 'to the
y
physiology of the individual driver. Studies on Response Times have been extremely helpful in judging the qualifications necessary for efficient drivers, pilots and others who must-react quickly to stimulus. The natural dependency of response time on an individual's characteristics and its tendency to change as the conditions change prompted many
scientists to explore further in this field- The general tendencies of Response Time, as postulated by Siwek, (44), are:— ■'
* (1) That it varies from one individual to another.
(2) That it is longer in childhood and in old age than in maturity.
(3) That fatigue lengthen it and practice shortens it.
One of the first studies on Response T ime w as that Obersteiner (44") studied Response Times of subjects who were sleepy, fatigued, suffering from a head ache and found that these conditions all lengthened Response T i m e as compared with the Response Times of the same subjects when they
were normal. Crude technique and the conclusions drawn on insufficient number of cases made these results of little or no value.
• ‘ * >
Draxin's (18A) experimental findings are interpreted as
evidence in favour of the view that response time reflects the subjects state of readiness- for the stimulus. Botwinic and Brinley, (9), Jointley, and Hershenson, (30), independently showed that response time was longer with visual stimulus than with auditory stimul’us. Robinson (50) found that response time decreased w ith increased luminance or area under equal
energy conditions and is independent of d u r a t i o n
-It has been shown that response time is shorter w hen the ready signal is applied before the stimulus than an uncertain, random signal. Berch (2), found that response time showed a slowness w h e n uncertainly of stimulus is introduced and this slowness was reduced or eliminated by introducing a ready signal. Also, Bernstein, S h u m a n and Forester,
(7), concluded that changes in stimulus uncertainty produced linear' changes in response time.
Literature, has provided sufficient proof that response time varies w ith experimental set ups, conditions and methods of experiments. Experiments such as measuring response time for:
(a) Light added to light-(b) Light added to n o i s e . (c) Noise added to light.
(f) Tones added to tones.
r
All provide varying values of response time. Actual procedure of these experiments^, one way or the other involved in pressing a telegraph or pushing or pulling levers or verbal responses of "yes" or "no".
These and many other factors strongly suggests a need to measure the variation of response time related to automobile driving. A number of feasibility studies conducted on driver response times and various methods of measurements are worth- mentioning at this point. Typical tracking tasks involve control of a single variable and the measurement is time averaged. Crossman (17) , using a laboratory simulator showed
that on a straight road the lateral-position error showed a marked periodicity of 0.2Hz. McLaren and Hoffman (39), writes "In a simple steeriHg task
drivers make most of their control movements within the two frequency bands ’ v
of 0.1 to -3H_ and .35 to .6H"- Michaels and Cozan, (41), found when
Z 2 •
-an object is placed near the path of a driver, a lateral movement away from the object occurs. Another element in the> real world driving task • iso the anticipatory information that is perceived by the driver at some point down the road stored until needed and then recalled from memory to be converted into a specific response. Any time a vehicle operator r e c e i v e s •information regarding the desired and actual state o f -his vehicle either directly or via displays and visual aids and adjust a control to regulate his task - he is performing tracking task.
One of the interesting aspects of tracking task is the various methods of measurements of useful parameters. A few of such methods are:
t
*.
t i m e .
(2) Lateral displacement of a vehicle from the reference point.
i
_
(3} Optimal use of braJce, gas and gears.
(4) Ability of a driver to be on target (TOT o r Time on
(
Target Method, alternatively Time off Target may also b e ’u s e d ) .
(5) Zero crossing method.
(6) Tracking scores.
Scientists have used several m e t h o d s , depending on the manner of the studies conducted. A quantity commonly recorded is the number of times the steering wheel is moved across-the zero angle position. Frequency characteristics of a steering wheel control movements have been
* ••• «... '
used by a number of authors as driving pe r f o r m a n c e . Time on target or time within tolerances is an easy measurement to make and is the one which obviously correlates well with independent variables reflective of
tracking skill. Cross over frequency is more appropriate for straight
■Ci
tracking. The one which is suitable for curved path is the measurement of lateral displacement of the vehicle from zero position.
Questions have been raised on the validity of using a simulator in order to study the parameters which are experienced in real life situations. We must not forget the fact that man is a creature whose optput is t o t a l l y ‘stochastic and very seldom can be predicted accurately.
$
Therefore, modeling the system becomes a tremendous challenge if an attempt is made to define the system in its entirety. The nature of the sinfulator design depends primarily on the uses to which they are to be tested. From the standpoint of this thesis the interest in simulation arises solely from a desire to subject certain aspects of driving to study under laboratory conditions. Although a number of draw backs can be cited against the simulator study, its advantages are equally valuable.
/
Since human beings are involved, even a minor physical and emotional disturbance can cause measurable variations in driver actions. A
simulator is particularily useful to repeat the environmental conditions as many times as the study required. Also using a simulator, it is
possible to filter out unwanted conditions or make unnecessary parameters constant. ■ In fact, simulator is the most suitable answer for a study such as this one
->
A quick retrospect would reveal the necessity of quantitative study on the response time of a driver while exposed to road noise. Therefore, it is the purpose of this quantitative study to draw some useful conclusions on the effect of road noise on the response time
i *
of a driver. ' v
I
EXPERIMENTAL SET UP - THE SIMULATOR
The entire experiment has been conducted in a Simulator, the basic description of which is given in reference 15. However, this has been greatly modified in concept and redesigned by the author. Also, the entire simulator except the half-car, the screen, and the projector
has been built b y the author. The simulator, consisted of the following; \
1. Half Car
2. Rear projection screen.
m
y
3. Projector, road film and a turntable. 4. Me'chanical direction selector
5. Electronic control circuits
6 . Tape recorder and recorded road noise. 7. Sound level meter.
8 . Multipen strip chart recorder
3.1 THE HALF C AR (Fig. 8) (For Fig. 1-8 see appendix F)
The front half of a car, (without engine) was inserted half the way through one of the two open ends of a wooden box which was kept at one end o f a room. A dark cloth hanging from the top of the box, over the sides of the half car was used to minimize subjects distractions while performing task.
3.2 THE SCREEN (Fig. 8)'
■ 9
A S ' x 4* rear projection screen, mounted on two adjustable side,
supports was placed inside the box, close to the front bumper of the
half car, so that it was in full view; of the subject who was seated inside the half car.
3.3 PROJECTOR, ROAD FILM, AND THE TURN TABLE (Fig. 6 )
A 16 mm. Bell & Howell, Model 173, Auto-Manual type projector
k
was located about 24 - ft. from the screen. The speed of the projector was varied by means of a speed control knob attached to the projector.
A 500 f t. ; 16 mm. colour movie film of a road was shot by the author from the top and directly behind the driver of a motor vehicle, so that the full v i e w of the road travelled was captured, just as the driver saw it.
The turn table, designed and built by the author, consisted of two circular discs, connected by a steel rod through their centres such a way that the top disc, called the turn table, rotated freely with the bottom disc fixed firmly to a wooden platform.
The projector was placed on top of the turn table which could be rotated both directions either through a programmer by the axperimenter or using the steering wheel by the subject. Connected to the turn table, through a gear combination of speed ratio of 1 0 0:1, was a speed reducer motor whose direction of rotation w a s the same as that of the turn table. The motor was attached to an. aluminum base.
The mechanical direction selector designed and built by the author consisted of a stationary part attached to the body of the car, and a rotating part attached on to the gear box of the steering wheel.
1
The stationary part was made up of sheet metal 2 inches w i d e , 6 inches long bent to the shape of an qrc of radius 5 inches. Two 6v lamps, powered directly from the mains, through a transformer, were fitted in
I two holes provided at both ends of the stationary p a r t .
Opposite to the lamps, along the same line, were two CL 907 photo cells which energized when light fell on them. The rotating part was a sheet metal piece, 2 inches wide, 4 inches long, also bent to an arc of radius 5 inches (approximately) was fixed such a way that when the steering wheel was turned, it moved freely in between the lamps and
photocells. The moving part could only block one lamp-photocell combination at any one time. The rotating part which was connected to the*gear,
box will rotate 270 degrees.end to end for 4 1/2 steering wheel revolutions. Thus for one revolution of the steering wheel an angle of 60 degrees was
' '
f
rotated.
3.5 ELECTRONIC CONTROL CIRCUITS
The Electronic part of the system consisted o f :
i. Power Supply (Fig. 3)
ii Pulse Indicator Circuit (Fig. 5)
iii Recorder Pen Control Circuit (Fig. 4). iv Relay Control Circuit (Figj 2)
v Motor Control Cirfcuit ,vi Lamp Circuit (Fig. 2}
A power supply was designed to supply 12v d.c. to the relay
control circuit. A step-down transformer reduced the main voltage (120v) to a lower a.c. value which subsequently converted to 1 2v d.c. by means of a bridge and capacitor circuit. A reference diode was provided in ..V, order to keep a steady out put.
The pulse indicator circuit was arranged to provide a synchronous pulse to the recorder whenever a side shift was applied to the irtQtor.
m
This was an ordinary resistor-capacitor charge-discharge circuit. In order to avoid the conditioned response of an individual, if only one side shift was given, two side shifts of distinct magnitudes were applied randomly to the projector.
The recorder pen control circuit was to attenuate the large output signal produced by turning the steering wheel and to feed a proportional quantity of it to the recorder pen. The 10 turn, 10 K potentiometer was used to select any desired value. (In order to guarantee an uninterrupted test pepiod, a battery of 8.4v and a zener diode of-3v were used). This low voltage’1 zener and high voltage battery ensured a reliable long term operation of the circuit.
V
The purpose of the relay control circuit was to -respond to the condition of photocells and to control the operation of the relays P and
(
.Q, as shown in Fig. 2. Initially whon both lamps lighted and the rotating part of the mechanical direction selector at normal position both relays' operated. When any one of the photocells was blocked from light, the corresponding relay released providing a path for the motor to turn to
The essential part of the motor control circuit was a rectifier to provide 115v d.c. to a standard SCR controlled motor speed control
circuit. The field of the motor was connected directly to 115v d.c. supply. The armature of the motor was connected through a set of relay-key contacts to the 115v d.c. supply.;-which also enorgized the SCR control circuit.
The purpose of the relay-key contacts were to choose directions of turn of the motor either manually or by the subject using the steering wheel. A parallel combination of resistors and key contacts, serving as a
programmer, to provide side shift movements to the projector were connected across the speed control potentiometer. A delay relay ensured delayed operation of the rectifier circuit in order to prevent a momentary short. Lamp C in'Fig. 2 indicatod the state of the circuit.
Tho'Mamp circuit is a small step down transformer, 1 2 0 . 6 volts a.c., and a parallol combination of two 6v lamps connected across it in such a way that when the main switch SW operates both lamps light. If the rotating part of the mechanical ^irection selector was at normal position, the photocells were energized.
3.6 ROAD NOISE AND TAPE RECORDER
Actual road noise of trucks-, cars, buses and motorcycles were
recorded by the author from a car running at 30 mph, with microphones kept at ear level of the driver. A pro-determined signal of known frequency and db level was p laced a£ the beginning of the tape for calibration
purposes. This tape was played back on a stereo tape recorder kept inside the experimental car, at throe db levels of SPL (see Appendix A) of
produced by a number of vehicles also taken from a parked car is given
•»
in Appendix B.'
3.7 SOUND LEVEL METER
A Bruel and Kjoer type 2204 sound level meter kept- at a distance the same as the s u b j e c t s ’ ear from the tape recorder'.speaker measured the SPL of the noise; a proportionate value of which is fed to the multipen
recorder.
3.8 MULTIPEN RECORDER (Fig. 8 , Component 5)
o
A four pen, Rikadenki Multipen Recorder recorded:
.
1. The magnitude and time o f steering wheel reversals 2. Side shift pulses.
3. The road noise-v
A chart speed of 15 cxn/min was used normally- Appendix E gives a numbei-of chart.samples and details of^the recordings.
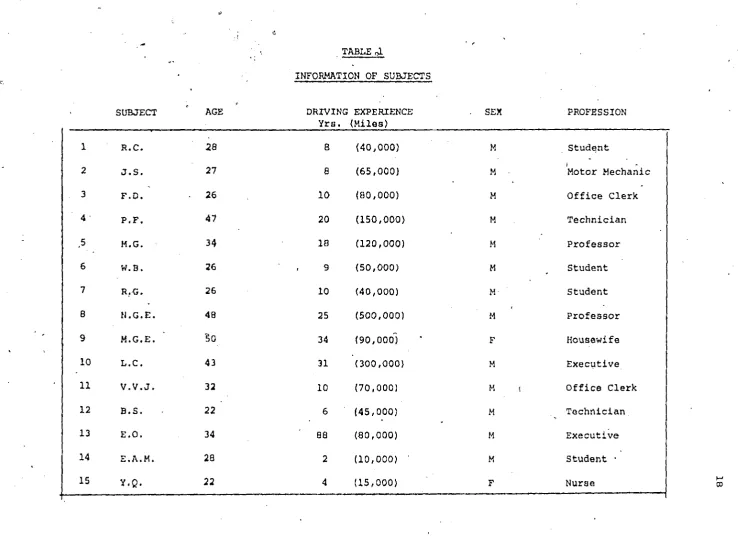
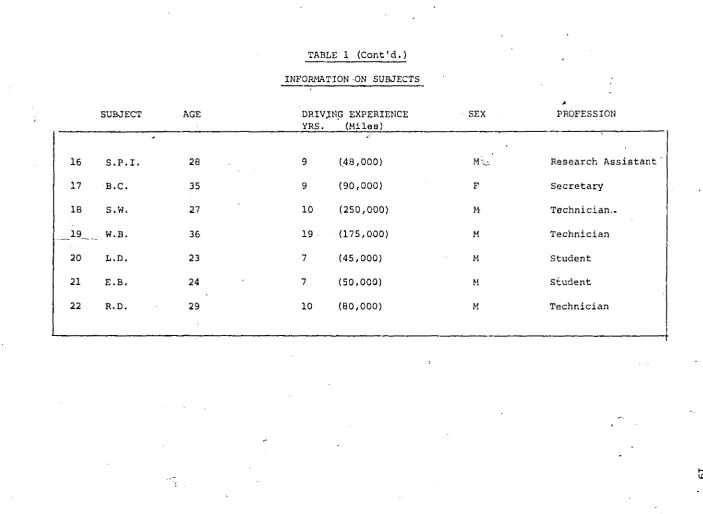
Since the-aim of the study was to investigate the effects of road noise on driver performance behaviour it was considered necessary that the persons holding d r i v e r ’s licences issu^i. by the Department of Transportation, Province of Ontario, be allowed to participate in the experiment-■
2 2 subjects were_ selected randomly, both men and women of different ' d having varying driving experiences. They include office workers, technicians, machine operators and executives- Particulars of subjects*
•
age, sex, driving experience etc.' aife given in Table 1.
Q. c o CD Q. T3 CD (/) (/) SUBJECT AGE o o -o 3 CD c 3. CD ■a o Q. c
fl
o 3 ■o—5 o CD Q. ■a CD c/> w 1 2 3 4 ' ,56
7 8 9 10 11 12 13 14 15 R.C. J.S. F.D. P.F, M.G. W.B. R.<5. N.G.E. M.G. E . L.C. V.V.J. B.S. E.O. E.A.M. Y.Q. 28 27 26 47 34 26 26 48 So 43 32 22 34 28 22 TABLE piINFORMATION OF SUBJECTS
DRIVING EXPERIENCE SEX PROFESSION
YrB. (Milos) ______________
8 (40,000) M Student
8 (65,000) M
)
Motor Mechanic
1 0 (80,000) M Office Clerk
2 0 (150,000) M Technician
18 (1 2 0,0 0 0) M Professor
9 (50,000) M Student
1 0 (40,000) M Student
25 (500,000) M Professor
34 (90,0001 F Housewife
31 (300,000) M Executive
1 0 (70,000) M t office Clerk
6 (45,000) M Technician
8 8 (80,000) M Executive
2 (1 0,0 0 0) ' M Student ■
ced
w
ith
pe
rm
is
s
io
n
of
th
e
co
py
ri
gh
t
o
w
ne
r.
Fu
rthe
r
re
production
p
ro
h
ib
ite
d
wi
th
ou
t
p
e
rm
is
s
io
n
.
TABLE 1 (Cont'd.) INFORMATION -ON SUBJECTS
SUBJECT AGE DRIVING EXPERIENCE
YRS. (Miles)
SEX
*
PROFESSION
16 S.P.I. 28 9 (48,000) M o Research Assistant
17 B.C. 35 9 (90,000) F Secretary
IB S.W. 27 1 0 (250,000) M Technician..
I?— _ W.B. 36 19 (175,000) M Technician
2 0 L.D. 23 7 (45,000) M Student
2 1 E.B. 24 7 (50,000) M Student
4.1 EXPERIMENTAL. PROCEDURE A N D METHODS OF DATA COLLECTION
Prior to the experiment a brief explanation on the experimental set up and procedure t o be folloVfed was explained to each subject and a 1 0 minute warm-up was given to get adjuste.d with the set up. Then the experimenter randomly selected;
1. A speed level 30 m.p.h. or S2 = 40 m.p.h. or S 3 = 50 m.p.h.) 2. A noise level (N^= 80 db or N2 ~ 90 db or N 3 = 100 db.)
3. A side shift CSS^“ 1.5 ft/sec or SS2= 2.5 ft/sec)
All noise levels and speed levels were varied randomly during the course of experiment so that all combinations of speed and noise were selected. During the experiment side shifts were applied randomly to the projector b y the experimenter so that the subject would see the road moves to one direction. The task of the driver was to react to the side shifts and bring the car again on the road. Three replications were made for each experimental conditions and a higher chart speed (60 cm/min) other than the normal one (15 cm/min), was used for all replications. Meanwhile, a tape recorder replayed the road noise inside the car and its sound pressure level (SPL) was measured b y a precision sound level meter and was recorded by the multipen strip chart recorder. The potentiometer
W h e n the experimenter applied the side shift to the road, a simul taneous pulse which indicated the time of input pulse, was sent to the strip chart recorder, on observing the side shift of the road the
subject tried to bring it back to the centre of the screen by manipulating the steering wheel- The steering wheel movement sent a pulse to the
recorder. The difference between the initiation of thr side shift and the initiation of the steering wheel manipulation was taken as performance time. The Performance Time as defined is assumed to be the indicator of
the driver's
performance-T he experiment lasted about 1 t o .1-1/4 h o u r s , with two 5 minute
breaks in order to rewind and re-arrange film and tapes.a The normal chart
speed used for the experiment w a s 15 cm/min- Later this chart was analyzed and performance time measurements were made.
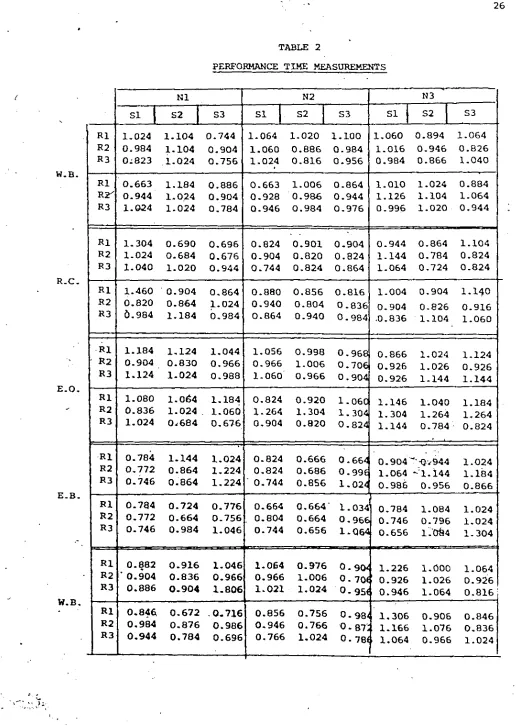
4.2 DATA COLLECTION
All necessary informatiotf such as the side shift initiation and
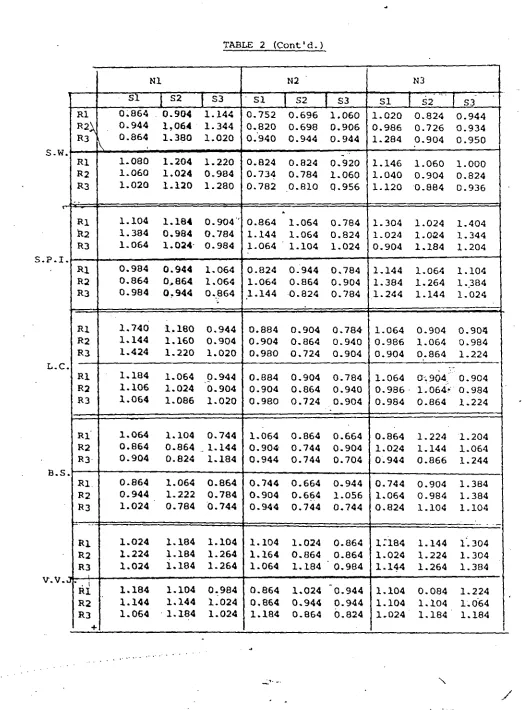
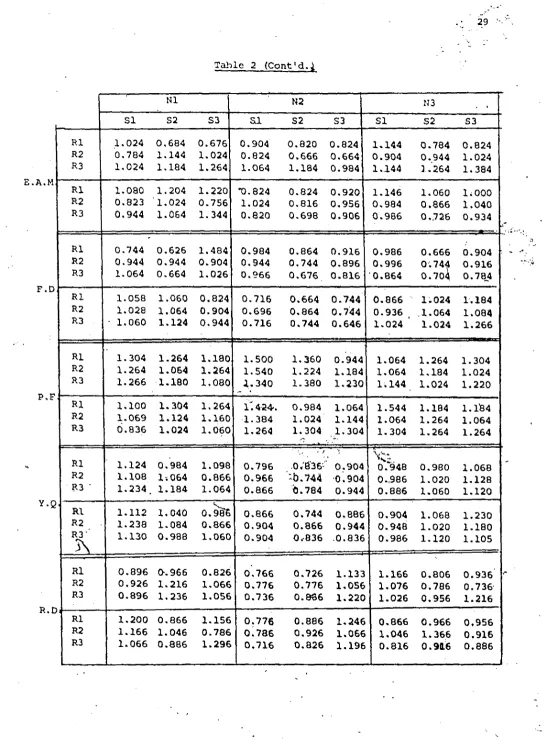
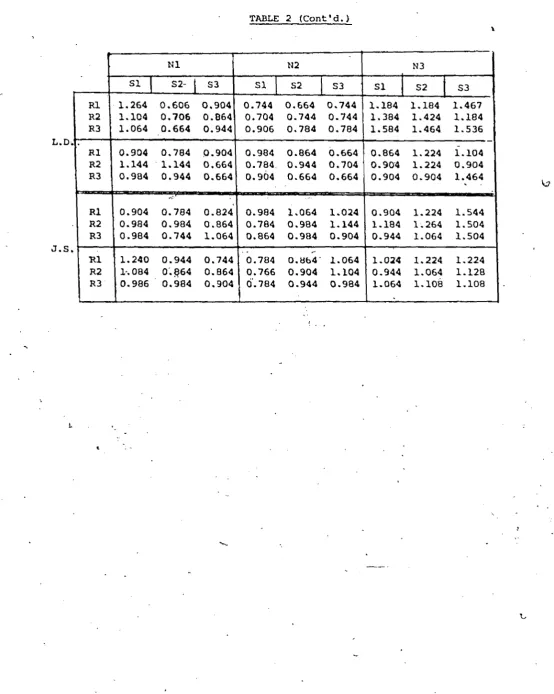
magnitude, steering wheel initiation and magnitude, and noise levels were recorded b y the Multipen Strip Chart recorder. The chart contained, for each subject, three noise levels, three speed levels, two side shifts and three replications of the above conditions. The data collected for each subject under each experimental conditions are given in T a b l e ’2. These are the performance times measurements taken from each S u b j e c t ’s Chart. Performance time las bee n taken from the charts as the time between initiation’ of the side shift pulse to the moment the subject responded
to it. There are 54 such measurements for each subject, for 3 noise levels.
3 speed levels, and 2 side shifts with 3 replications- These data were analysed using a statistical technique called Analysis o f V a r i a n c e .(ANOVA) and its details are given in Chapter 5- Graphs between noise levels
and performance time for each individual are given in Appendix H-Figures 9, 10 & 1 1 show the driver r e s p c n ^ ^ noise levies and side shifts a s they were recorded by the multipen strip chart rec o r d e r . A speciman measurement of h o w performance tine was determined is also s h o w n .
*
AMP
LI
TU
DE
m
v
/
c
m
DRIVER RESPONSE
i
SIDE SHIFT NOISE LEVEL « 9Q d B
1
15 cm/min CHART SPEED
Figure 9
> E «
^ t = A
DRIVER RESPONSE
Noise Level 100 dB
Side Shift 1
'r
-h-T
v C-15 cm/min.
CHART SPEED Figure 10
' X
A
M
P
L
I
T
UD
E
m
v
/
c
m
I
Initiation of Response Driver Response
PERFORMANCE
TIME
Noide Level 80 dB
i Initiation o f Sid^
y Shifjt
15 cm/min
CHART SPEED
FIGURE 11
TABLE 2
PERFORMANCE TIME MEASUREMENTS
N1 N2 N3
SI S2 S3 SI S2 S3 SI S2 S3
R1 R2 R3
1.024 1.104 0.744 0.984 1.104 0.904 0-823 1.024 0.756
1.064 1.020 1.100 1.060 0.886 0.984 1.024 0.816 0.956
1.060 0.894 1.064 1.016 0.946 0.826 0.984 0.866 1.040 R1
R Z '
R3
0.663 1.184 0.886 0.944 1.024 0.904 1.024 1.024 0.784
0.663 1.006 0.864 0.928 0.986 0.944 0.946 0.984 0.976
1.010 1.024 0.884 1.126 1.104 1.064 0.996 1.020 0.944
R1 R2 R3
1.304 0.690 0.696 1.024 0.684 0.676 1.040 1.020 0.944
0.824 0.901 0.904 0.904 0.820 0.824 0.744 0.824 0.864
0.944 0.864 1.104 1.144 0.784 0.824 1.064 0.724 0.824 R1
R2 R 3
1.460 0.904 0.864 0.820 0.864 1.024 6.984 1.184 0.984
0.880 0.856 0.816 0.940 0.804 0.836 0.864 0.940 0.984
1.004 0.904 1.140 0.904 0-826 0.916 .0.836 1.104 1.060
R1 R2 R 3
1-184 1.124 1.044 0.904 0.830 0.966 1.124 1.024 0.988
1.056 0.998 0.968 0.966 1.006 0.706 1.060 0.966 0.904
0.866 1.024 1.124 0.926 1.026 0.926 0.926 1.144 1.144 R 1
R2 R3
1.080 1.064 1.184 0.836 1.024 . 1.060 1.024 0.< 684 0.676
0.824 0.920 1.060 1.264 1.304 1.304 0.904 0.820 0.824
1.146 1.040 1.184 1.304 1.264 1.264 1.144 0.784 0.824
R 1 R2 R3
— —--—.— - ■■■ .-v 0.784 1.144 1.024 0.772 0.864 1.224 0.746 0.864 1.224
0.824 0.666 0.664 0.824 0.686 0.99£ ' 0.744 0.856 1.024
0.904 "''-Qv944 1.024 1.064 -1.144 1.184 0-986 0.956 0.866 R 1
R 2 R3
0.784 0.724 0.776 0.772 0.664 0.756 0.746 0.984 1.046
0.664 0.664' 1.034 0.804 0.664 0.966 0.744 0.656 1.Q64
0.784 1.084 1.024 0.746 0.796 1.024 0.656 1.0&4 1.304
R 1 R 2 R 3
0.882 0.916 1.046 * 0.904 0.836 0.966
0 . 8 8 6 0.904 1.806
1.064 0.976 0-904 0.966 1.006 0 . 7 0
1 . 0 2 1 1.024 0. 9 5{
1.226 1.000 1.064 ^ 0.926 1.026 0.926
0.946 1.064 0 . 8 1 6 j R1
R 2 R 3
0.846 0.672 .0.716 0.984 0.876 0.986 0.944 0.784 0.696
0.856 0.756 0.98^ 0.946 0.766 0.871 0.766 1.024 0. 78(
1.306 0.906 0.846 1.166 1.076 0.836 1.064 0.966 1.024
TABEE 2 (Cont'd.) ■N.G.E. R.G. t N.G.E M.G B.C
N1 N2 N3
SI S2 is 3 SI S2 S3 si S2 S3
R1 1.224 1 . 2 2 2 1.144 0.704 0.826 0.706 0.636 1.064 0.824 R2 0.744 1.264 0.984 0.664 0.718 0.916 0.716 0.756 0 . 8 8 6 R3 1.264 1.184 1.264 0.744 0.710 0.876 1.064 0 . 8 8 6 0.736 K1 0.944 1.024 1.184 0.984 0.784 *0.682 0.984
0.784 0 . 8 6 6 R2 1.104 1.064 1.344 0.664 0.784 0.986 0.864 0.784 0.726 R3 1.104 0.744 1.104 0.864 0.784 0.784 1.264 0.664 0.916
R1
0 . 9 2 4 0 . 9 3 2K2 0 . 9 0 3 0 . 9 2 1 R3 0 . 9 0 1 0 . 8 7 4
1 . 1 0 4 0 . 9 4 0 0 . 8 9 4 0 . 7 8 4 0 . 9 4 4 0 . 8 6 4 0 . 8 6 4 Q .68 2 1 .1 8 6 1 0 . 8 5 0 0 . 8 7 2 0 . 6 5 1 R l j 0 . 1 0 0 1 . 2 2 0 1 . 1 8 0 | 0 . 7 8 4
R2 0 . 9 2 0 0 . 9 2 8 1 . 0 2 0 0 . 8 2 0 R? I 0 . 9 0 4 ’ 0 . 8 7 4 1 . 1 2 0 1 0 . 7 6 0
0 . 8 1 6 0 . 7 0 4 0 . 8 2 0 0 . 8 2 0 0 . 9 1 0 0 . 9 2 4
R1 0 . 6 9 6 1 . 2 7 0 1 . 1 8 0 1 . 0 4 0 R2 0 . 8 8 4 1 . 1 4 0 1 . 1 0 0 1 . 3 2 0 R3 1 0 . 7 0 4 1 . 2 0 0 _ 1 . J L 4 0 | 1 . 1 6 0
0.370 1.040 0.980 1.070 0.880 .1.130
0 . 5 3 0 0 . 6 6 4 0 . 4 2 4 0 . 5 1 0 0 . 6 1 2 0 . 6 6 4 0 . 5 4 0 0 . 6 0 1 0 . 6 3 2 0 . 6 5 4 0 . 4 2 4 0 . 6 6 4 0 . 6 6 2 0 . 4 3 5 0 . 6 7 6 0 . 5 8 1 ' 0 . 5 4 3 0 . 6 2 4
R1 1 . 0 6 0 0 . 8 4 0 1 - 0 1 0 0 . 9 2 4 0 . 9 2 4 1 . 0 7 0 0 . 9 2 0 R2 0 . 8 9 2 0 . 9 8 0 1 . 2 4 0 | 0 . 9 8 4 0 . 9 3 8 1 . 0 5 0 0 . 6 7 6 R3 0 . 7 3 1 0 . 8 0 0 0 . 9 8 0 0 . 9 6 8 0 . 9 5 5 1 . 0 2 0 0 . 6 8 6
R1 1 . 0 6 4 0 . 8 6 4 R2 1 . 0 6 4 0 . 6 6 4 R3 1 . 0 2 4 0 . 7 6 4
v
0 . 9 6 6 I 0 . 9 8 4 0 . 7 4 4 0 . 7 4 4 0 . 9 0 4 I 0 . 6 6 4 0 . 9 6 6 0 . 6 8 0 0 . 8 3 4 1 0 . 9 8 4 0 . 9 2 6 0 . 8 3 0 R1 I 0 . 9 8 4 1 . 0 6 4 0 . 7 4 4 | 0 . 8 2 4
R2 I 0 . 9 1 6 0 . 9 6 6 0 . 9 4 4 0 . 9 2 4 R3
J
0 . 9 2 4 0 . 9 8 8 0 . 9 4 4 0 . 9 0 40 . 7 0 4 0 . 8 6 4 0 . 7 0 4 0 . 6 6 0 0 . 7 2 4 0 . 7 2 6
R1 | 1 . 0 2 4 0 . 9 8 6 0 . 8 2 4 I 0 . 7 0 4 R2 1 . 0 6 4 0 . 9 6 6 0 . 9 0 4 0 . 6 6 4 R3 I 1 . 0 2 4 1 . 0 6 0 1 . 0 6 4 0 . 6 6 4
0 . 7 4 4 0 . 6 2 4 0 . 7 0 4
0 . 9 0 4 0 . 7 0 4 0 . 7 0 4
0 . 9 4 4 0 . 6 8 8 0 . 9 2 2 0 . 6 8 4 0 . 6 8 4 1 . 1 8 0 0 . 6 7 0 0 . 6 8 8 0 . 9 0 4
0 . 6 9 6 0 . 6 8 2 0 . 6 9 6
; 0 . 6 7 6
0.686
0.688
1 . 1 4 4 0 . 9 0 4 0 . 9 8 4 1 . 0 2 4 0 . 9 4 4 1 . 3 7 6 1 . 1 5 4 1 . 0 6 4 1 . 1 2 4 0 . 9 0 4 0 . 9 8 4 0 . 9 4 4 1 . 2 2 4 0 . 8 6 4 0 . 6 6 0 1 . 2 6 4 0 . 9 4 4 0 . 7 8 4
R1 j 0 . 9 4 4 1 . 1 0 4 R2 1 . 1 0 4 1 . 1 8 4 R3 j 0 . 9 0 4 1 . 0 2 4
0 . 8 2 4 j 0 . 7 4 4 0 . 9 0 4 0 . 7 0 4 0 . 7 4 4 0 . 7 0 4 0 . 9 0 4 0 . 7 0 4 0 . 7 4 4 [ 0 . 6 6 4 0 . 6 2 4 0 . 6 6 4
--- .---
7-1 . 0 2 4 0 . 9 4 4 1 . 0 2 0 0 . 8 2 4 0 . 9 8 6 1 . 1 2 4 0 . 8 6 6 0 . 8 6 6 1 . 0 2 4 1 . 0 6 4 0 . 7 0 4 0 . 9 0 4 0 . 7 4 4 0 . 7 4 4 0 . 7 4 4 0 . 7 0 4 0 . 7 0 4 0 . 7 8 4
TABLE 2 (Cont'd.)
NX N2 N3
S i S2 S3 S I S2 S3 S I S2 S3
R1 R2N R3
0 . 8 6 4 0 . 9 4 4 ^ 0 . 8 6 4
0 . 9 0 4 1 , 0 6 4 1 . 3 8 0
1 . 1 4 4 1 . 3 4 4 1 . 0 2 0
0 . 7 5 2 0 . 8 2 0 0 . 9 4 0
0 . 6 9 6 0 . 6 9 8 0 . 9 4 4
1 . 0 6 0 0 . 9 0 6 0 . 9 4 4
1 . 0 2 0 0 . 9 8 6 1 . 2 8 4
0 . 8 2 4 0 . 7 2 6 0 . 9 0 4
0 . 9 4 4 0 . 9 3 4 0 . 9 5 0 S-W*
R1 R2 R3
1 . 0 8 0 1 .Q 6 0 1 . 0 2 0
1 .2 0 4 1 . 0 2 4 1 . 1 2 0
1 . 2 2 0 0 . 9 8 4 1 . 2 8 0
0 . 8 2 4 0 . 7 3 4 0 . 7 8 2
0 . 8 2 4 0 .7 8 4 0 . 8 1 0
0 . 9 2 0 1 . 0 6 0 Q .9 5 6
1 . 1 4 6 1 . 0 4 0 1 . 1 2 0
1 . 0 6 0 0 . 9 0 4 0 . 8 8 4
1 . 0 0 0 0 . 8 2 4 0 . 9 3 6 c~
R1 &2 R3
1 .1 0 4 1 . 3 8 4 1 . 0 6 4
1 . 1 8 4 0 . 9 8 4 1 . 0 2 4
0 .9 0 4 '* 0 . 7 8 4 0 . 9 8 4
0 . 8 6 4 1 . 1 4 4 1 . 0 6 4
1 . 0 6 4 1 . 0 6 4 1 . 1 0 4
0 . 7 8 4 0 . 8 2 4 1 . 0 2 4
1 . 3 0 4 1 . 0 2 4 0 . 9 0 4
1 . 0 2 4 1 . 0 2 4 1 . 1 8 4
1 . 4 0 4 1 .3 4 4 1 . 2 0 4 S • P . I .
R1 R2 R3
0 . 9 8 4 0 . 8 6 4 0 . 9 8 4
0 . 9 4 4 0 , 8 6 4 0 , 9 4 4
1 . 0 6 4 1 . 0 6 4 0 . 8 6 4
0 . 8 2 4 1 . 0 6 4 1 . 1 4 4
0 . 9 4 4 0 . 8 6 4 0 . 8 2 4
0 . 7 8 4 0 . 9 0 4 0 . 7 8 4
1 . 1 4 4 1 . 3 8 4 1 . 2 4 4
1 .0 6 4 1 . 2 6 4 1 . 1 4 4
1 . 1 0 4 1 . 3 8 4 1 . 0 2 4
R1 R2 R3
1 . 7 4 0 1 . 1 4 4 1 . 4 2 4
1 . 1 8 0 1 . 1 6 0 1 . 2 2 0
0 . 9 4 4 0 . 9 0 4 1 . 0 2 0
0 . 8 8 4 0 . 9 0 4 0 . 9 8 0
0 . 9 0 4 0 . 8 6 4 0 . 7 2 4
0 . 7 8 4 0 . 9 4 0 0 . 9 0 4
1 . 0 6 4 0 . 9 8 6 0 . 9 0 4
0 . 9 0 4 1 . 0 6 4 0 . 8 6 4
0 . 9 0 4 0 . 9 8 4 1 .2 2 4 L , C .
R1 R2 R3
1 . 1 8 4 1 . 1 0 6 1 . 0 6 4
1 . 0 6 4 1 . 0 2 4 1 . 0 8 6
0 . 9 4 4 0 . 9 0 4 1 . 0 2 0
0 . 8 8 4 0 . 9 0 4 0 . 9 8 0
0 . 9 0 4 0 . 8 6 4 0 . 7 2 4
0 . 7 8 4 0 . 9 4 0 0 . 9 0 4
1 . 0 6 4 0 . 9 8 6 0 . 9 8 4
O'. 904. 1 . 0 6 4 ‘ 0 . 8 6 4
0 . 9 0 4 0 . 9 8 4 1 . 2 2 4
R1 R2 R3
1 . 0 6 4 0 . 8 6 4 0 . 9 0 4
1 .1 0 4 0 . 8 6 4 0 . 8 2 4
0 . 7 4 4 1 . 1 4 4 1 . 1 8 4
1 . 0 6 4 0 . 9 0 4 0 . 9 4 4
0 . 8 6 4 0 . 7 4 4 0 . 7 4 4
0 . 6 6 4 0 . 9 0 4 0 . 7 0 4
0 . 8 6 4 1 . 0 2 4 0 . 9 4 4
1 . 2 2 4 1 . 1 4 4 0 . 8 6 6
1 . 2 0 4 1 .0 6 4 1 .2 4 4 o • o «
R l . R2 R3
0 . 8 6 4 0 . 9 4 4 1 . 0 2 4
1 .0 6 4 1 . 2 2 2 0 .7 8 4
0 . 8 6 4 0 . 7 8 4 0 . 7 4 4
0 . 7 4 4 0 . 9 0 4 0 . 9 4 4
0 . 6 6 4 0 . 6 6 4 0 . 7 4 4
0 . 9 4 4 1 . 0 5 6 0 . 7 4 4
0 . 7 4 4 1 . 0 6 4 0 . 8 2 4
0 . 9 0 4 0 . 9 8 4 1 . 1 0 4
1 .3 8 4 1 .3 8 4 1 .1 0 4
R l R2 R3
1 . 0 2 4 1 . 2 2 4 1 . 0 2 4
1 . 1 8 4 1 . 1 8 4 1 .1 8 4
1 . 1 0 4 1 . 2 6 4 1 . 2 6 4
1 .1 0 4 1 . 1 6 4 1 .0 6 4
1 .0 2 4 0 . 8 6 4 1 . 1 8 4
0 . 8 6 4 0 . 8 6 4 ' 0 . 9 8 4
i : i 8 4 1 . 0 2 4 1 . 1 4 4
1 . 1 4 4 1 . 2 2 4 1 . 2 6 4
1 .3 0 4 1 .3 0 4 1 .3 8 4 V . V .
J
H I R2 R3 +
1 . 1 8 4 1 . 1 4 4 1 . 0 6 4
1 . 1 0 4 1 . 1 4 4 1 . 1 8 4
0 . 9 8 4 1 . 0 2 4 1 . 0 2 4
0 . 8 6 4 0 . 8 6 4 1 . 1 8 4
1 . 0 2 4 0 . 9 4 4 0 . 8 6 4
* 0 . 9 4 4 0 . 9 4 4 0 . 8 2 4
1 . 1 0 4 1 . 1 0 4 1 . 0 2 4
0 . 0 8 4 1 .1 0 4 1 . 1 8 4
1 . 2 2 4 1 .0 6 4 1 .1 8 4
\
/
Table 2 (Cont1d .4
Nl N2 N3 . ,
SI 52 S3 SJl S2 S3 SI S2 S3
Rl R2 R3 1.024 0.784 1.024 0.684 1.144 1.184 0.676 1.024 1.264 0.904 0.824 1.064 0.820 0 . 6 6 6 1.184 0.824 0.664 0.984 1.144 0.904 1.144 0.784 0.944 1.264 0.824 1.024 1.384 Rl R2 R3 1.080 0.823 0.944 1.204 1.024 1.064
1 . 2 2 0 0.756 1.344 *0.824 1.024 0.820 0.824 0.816 0.698 0.920 0.956 0.906 1.146 0.984 0.986 1.060 0 . 8 6 6 0.726
1 , 0 0 0 1.040 0.934 Rl R2 R3 0.744 0.944 1.064 0.626 0.944 0.664 1.484 0.904 1.026 0.984 0.944 0.966 0.864 0,744 0.676 0.916 0.896 0.816 0.986 0.996 0.864
0 . 6 6 6 Q.744 0.704 0.904 0.916 0.784 Rl R2 R3 1.058 1.028 - 1.060
1.060 1.064 1.124 0.824 0.904 0.944 0.716 0.696 0.716 0.664 0.864 0.744 0.744 0.744 0.646
0 . 8 6 6 0.936 , 1.024 ’ 1.024 .1.064 1.024 1.184 1.084 1.266 Rl R2 R3 1.304 1.264 1.266 1.264 1.064 1.180 1.180 1.264 1.080 1.500 1.540 1.340 1,360 1.224 1.380 0.944 1.184 1.23Q 1.064 1.064 1.144 1.264 1.184 1.024 1.304 1.024 1 . 2 2 0
Rl R2 R3
1 . 1 0 0 1.069 0.836 1.304 1.124 1.024 1.264 1.160 1.060 r.4-24-. 1.384 1.264 0.984 1.024 1.304 1.064 1.144 1.304 1.544 1.064 1.304 1.184 1.264 1.264 1.184 1.064 1.264 Rl R2 R3 ' 1.124 1.108 1.234 . 0.984 1-.064 1.184 1.098 0 . 8 6 6 1.064
0.796 0.966 0 . 8 6 6
• / •0;6'36-' ‘ 4). 744 0.784 > 0.904 0.904 0.944 t1 X c .
0.948 0..986 0 . 8 8 6
0.980 1 . 0 2 0 1.060
1.068 1.128 1 . 1 2 0
,
Rl R2 R 3 '
ss
1 . 1 1 2 1.238 1.130 1.040 1.084 0.988 Q.9§6 0 . 8 6 6 1.060
0 . 8 6 6 0.904 0.904
0.744 0 . 8 6 6 0,836
0 . 8 8 6 0.944 .0.836 0.904 0.948 0.986 1.068 1 . 0 2 0 1 . 1 2 0
1.230 1.180 1.105 Rl R2 R3 0.896 0.926 0.896 0-.966 1.216 1.236 0.826 1.066 1.056 0.766 0.776 0.736 0.726 0.776 0 . 8 6 6
1.133 1.056 1 . 2 2 0
1.166 1.076 1.026 0.806 0.786 0.956 0.936 0.736 1.216 )i---Rl R2 R3
1 . 2 0 0 1.166 1.066
0 . 8 6 6 1.046 0 . 8 8 6
1.156 0.786 1.296 0.776 0.786 0.716
0 . 8 8 6 0.926 0.826
1.246 1.066 1.196
0 . 8 6 6 1.046 0.816 0.966 1.366 0.916 0.956 0.916 0 . 8 8 6
TABLE 2 (Cont'd.)
\
H I N2 N3
S I S2- | S3 SI S2 S3 SI S2 I S3
Rl 1.264 0.606 0.904 0.744 0.664 0.744 1.184 1.184 1.467 R2 1.104 0.706 0.864 0.704 0.744 0.744 1.384 1.424 1.184 R3 1.064 0.664 0.944 0.906 0.784 0.784 1.584 1.464 1.536 Rl 0.904 0.784 0.904 0.984 0.864 0.664 0.864 1.224 1.104 R2 1.144 1.144 0.664 0.784 0.944 0.704 0.904 1.224 0.904 R3 0.984 0.944 0.664 0.904 0.664 0.664 0.904 0.904 1.464
Rl 0.904 0.784 0.824 0.984 1.064 1.024 0.904 1.224 1.544 R2 0.984 0.984 0.864 0.784 0.984 1.144 1.184 1.264 1.504 R3 0.984 0.744 1.064 0.864 0.984 0.904 0.944 1.064 1.504 R l 1.240 0.944 0.744 0.784 0.864 1.064 1.024 1.224 1.224 R2 1-.084 0.§64 0.864 0.766 0.904 1.104 0.944 1.064 1.128 R3 0.986 0.984 0.904 0.784 0.944 0.984 1.064 1.108 1.108
i.
ANALYSIS OF DATA
In order to analyse the measurements which depended on both noise and speed effects operating simultaneously and to decide and estimate which kind of effect was predominant, a statistical technique called Analysis of Variance (ANOVA) was used. The following reasons also found to be advantageous in-choosing this technique.
It is a convenient method of evaluating b y a
simpf£ test, called F-test, the overall differences among the means of several experimental groups. The F-test involved in finding the ratio of two
4
variances which, if a stated null hypothesis were true, ,would fall inside a specified point of the oppropriate F-distTibution. If this .variance ratio falls beyond the 5 p er cent point
of F-distributiqn, known as confidence limit, determined by degrees of f r e e d o m of the two variances concerned, then the null hypothesis is rejected at the 5 per cent level of significance. .
interpretation due to the complexities
of probabilities when a number of means are to be compared.
The fundamental equation for Analysis of Variance is that the total sum of squares of deviations from grand mean is equal to the sum of squares of deviations between treatment means and the grand mean p l u s the sum of squares of deviaitions within tr e a t m e n t s .
Following model was used to analyse the data given in Table 2:
- *ijlc - » ♦ « ± ♦ »j ♦ • ♦ cijk
i - 1, 2, 3 .j “ 1, 2, 3
k = 1, 2, 3 (replication)
where X. is the mean performance time for ith speed level, jth noise level and kth replication, y is the general mean, o is.the effect of -speed,
B
is the effect of-noise,aB
is the interaction between speed andnoise, and is an independent chance conponent, representing error in the experiment, with normal distribution H (0 , 0
)-The null hypothesis tested were:
C Z ai = 0 r
Z
Bj“ 0
andZZ aBij =■ 0
A 5 p e r cent confidence level is choosen in order to accept or reject the null hypothesis for this analysis a and B were treated as fixed level.