Report No. 422
DEVELOPMENT OF AN ANALYTICAL METHOD FOR TASTE AND ODOR COMPOUNDS COMMONLY FOUND IN DRINKING WATER SOURCES
By
Detlef R.U. Knappe and Anjali Viswakumar
Department of Civil, Construction, and Environmental Engineering North Carolina State University
UNC-WRRI-422
DEVELOPMENT OF AN ANALYTICAL METHOD FOR TASTE AND ODOR COMPOUNDS COMMONLY FOUND IN DRINKING WATER SOURCES
Detlef R.U. Knappe and Anjali Viswakumar
Department of Civil, Construction, and Environmental Engineering North Carolina State University
208 Mann Hall, 2501 Stinson Drive Raleigh, North Carolina 27695-7908
The research on which this report is based was supported by funds provided by the North Carolina General Assembly through the North Carolina Department of Environment and Natural Resources.
Contents of this publication do not necessarily reflect the views and policies of the WRRI, nor does mention of trade names or commercial products constitute their endorsement by the WRRI or the State of North Carolina.
This report fulfills the requirements for a project completion report of the Water Resources Research Institute of The University of North Carolina. The authors are solely responsible for the content and completeness of the report.
ABSTRACT
DEVELOPMENT OF AN ANALYTICAL METHOD FOR TASTE AND ODOR COMPOUNDS COMMONLY FOUND IN DRINKING WATER SOURCES
An analytical method was developed to detect and quantify 19 compounds commonly associated with taste and odor (T&O) problems in drinking water. The method can be used by utilities during T&O episodes to quickly and reliably detect T&O compounds and determine their
concentrations. Knowledge about the identity and concentration of T&O compounds will greatly aid utilities in the selection of appropriate treatment strategies. Head space solid phase
microextraction (SPME) was used to concentrate T&O compounds, and gas chromatography (GC) followed by tandem mass spectrometry (MS/MS) was used to separate, detect, and quantify the T&O compounds. Method development included (1) determination of parent ion mass and retention time, (2) optimization of the ion trap MS/MS instrumental parameters, (3) development of calibration curves, and (4) determination of the limits of quantitation (LOQs) for each
compound. For 12 of the 17 targeted T&O compounds with known odor threshold
concentrations (OTCs), LOQs were below the OTC. This result suggests that the developed method is capable of detecting developing T&O problems for these 12 compounds and allow utilities to implement treatment strategies before consumers can detect objectionable tastes and odors in their water. The developed method was tested by analyzing three water samples from North Carolina ponds and lakes that experienced algae/cyanobacteria blooms. In addition, Raleigh source and tap water samples were analyzed. Of the 19 targeted T&O compounds, all but 2,4,6 tribromoanisole were detected in the collected samples. In the bloom samples,
geosmin, β-ionone, and trans-2,cis-6-nonadienal most frequently occurred at concentrations that exceeded their OTCs, sometimes by a factor of >100. A comparison of results for non-filtered and filtered (0.45 µm membrane) samples suggests that many T&O compounds were
1
ACKNOWLEDGMENTS
The authors of this report would like to thank the following people and organizations for their cooperation, participation, and support of this project:
• The Water Resources Research Institute (WRRI) of the University of North Carolina for funding this project
• The WRRI staff for project management
• David Black of the NC State Environmental Engineering Research Laboratory for his support throughout this research
• Elle Allen and JoAnn Burkholder of the NC State University Center for Applied Aquatic Ecology for cyanobacteria identification
2
1. Introduction and Objectives
The presence of taste and odor (T&O) compounds in drinking water is an important issue for many utilities. In general the public perception is that the aesthetic quality of water is a good indicator of how safe the water is to drink. Thus water utilities meeting primary drinking water standards will not be able to guarantee consumer satisfaction unless their water is also taste and odor free (McGuire, 1995). Considerable financial resources are spent by the water industry to prevent and control T&O problems. For example, a T&O survey of about 800 US and Canadian water utilities showed that water utilities on average spent 4.5% of their total budget to control T&O problems (Suffet et al., 1996).
The causes of T&O problems have been largely attributed to microbial byproducts, disinfectants and disinfection byproducts, and distribution system materials (AwwaRF and Lyonnaise des Eaux, 1995; Whelton and Dietrich, 2004). Most T&O compounds implicated in consumer complaints have been microbial metabolites formed in surface waters (Suffet et al., 1999; Peter et al., 2009). Actinomycetes, cyanobacteria, algae and even fungi have been associated with the occurrence of T&O compounds (Gerber, 1979; Watson, 2003: Zaitlin and Watson, 2006). T&O problems commonly occur when “culture-like conditions” (a 2- to 5- week period with little or no rain, average flows less than 6500 cfs and water temperatures of 17oC or greater) exist in reservoirs (Raschke et al., 1975). Such conditions may occur with increasing frequency in North Carolina, which experienced extreme drought conditions in 2002, 2007 and 2008 in >30% of the state (ncwater.org). Apart from the water source, T&O compounds may also form during
treatment and distribution. Therefore, it is important for water utilities to screen their source and finished waters as well as distribution system samples for T&O compounds to determine the identity and origin of these compounds.
The principal objective of this study was to develop an analytical method that can be used by drinking water utilities to simultaneously detect and quantify 19 compounds commonly associated with T&O problems in drinking water. To assure sensitivity and specificity, gas chromatography tandem mass spectrometry (GC-MS/MS) was used. Sample preconcentration was achieved by head space solid phase microextraction (SPME) which has emerged as an ideal preconcentration technique with such advantages as small sample volume, solvent-free
extraction, and adaptability to automation.
Additional objectives of this study were to develop standard curves and to identify the limit of quantitation (LOQ) for each compound. The final objective was to apply the developed method to identify and quantify T&O compounds in several North Carolina water samples including a drinking water source, tap water, and water from lakes that were experiencing
3
2. Background
2.1 Classification of taste and odor
The Taste and Odor Wheel (Figure 1) was developed over the last twenty years (AwwaRF and Lyonnaise des Eaux, 1987, Suffet at al., 1999, 2004) and organizes T&O compounds according to their specific organoleptic characteristics. It includes eight classes of odors, four tastes and a mouth feel/nose feel category. The inner circle (Figure 1) describes the primary T&O groups, the second circle defines the primary T&O groups as described by trained sensory panelists, and finally the outer circle shows chemicals that have been confirmed in (denoted with a *), or are “representative” standards or “substitutes” (standards from natural odorous material that can be consistently prepared) for the various T&O categories. The main goal for the development of the T&O wheel was to
1) develop a common language for T&O sensory panelists and drinking water professionals, and
2) to present to the water industry the existing knowledge about the organoleptic characteristics of drinking water.
The following is a short description of common T&O compounds using the primary odor descriptors in the wheel as a guide for their classification. Table 1 provides a summary of common T&O compounds together with their CAS number, chemical properties, and structure. Earthy/musty/moldy
Geosmin. With its name derived from the Greek word “ge”= earth and “osme”= odor, geosmin or trans-1,10-dimethyl-trans-9-decalol was first isolated from actinomycetes (Gerber and LeChevalier, 1965). As its name suggests, geosmin has an earthy odor with an odor threshold concentration (OTC) of <10 ng/L (AwwaRF and Lyonnaise des Eaux, 1987). Frequently, an OTC of 4 ng/L is reported for geosmin (Malleret et al., 2001). Cyanobacteria are regarded to be the major producers of geosmin in surface water (Watson, 2004). Geosmin is a saturated tertiary alcohol that is quite stable in water and quite resistant to oxidation by conventional oxidants used in water treatment (Gerber, 1979; Peter and von Gunten, 2007). Granular and powdered
4
5
Table 1. Common taste and odor compounds, their CAS number, chemical properties and structure.
Compound Name CAS Number Molecular Weight
(g/mol)*
Boiling point (°C)*
Vapor Pressure
(Torr)*
Chemical Structure OTC
(ng/L)
dimethyl disulfide 624-92-0 94.20 109.7±0.0 28.7 H3C S S
CH3 <4,000 [2]
1-hexanal 66-25-1 100.16 127.9±3.0 10.9 H C
3 O
4,500[2]
cis-4-heptenal 6728-31-0 112.17 151.6±9.0 3.64
C H3
O
?
1-heptanal (heptaldehyde) 111-71-7 114.19 150.4±3.0 3.85 HC O
3
3,000[2] dimethyl trisulfide 3658-80-8 126.26 183.1±23.0 1.07 S S S CH
3
C
H3 10
[2]
cis-3-hexenyl acetate 3681-71-8 142.20 174.2±19.0 1.22 O CH3 O
CH3
1500[5]
trans,trans-2,4-heptadienal 4313-03-5 110.15 177.4±9.0 1.04 H3C O
2,500-5,000[3]
2-isopropyl-3-methoxypyrazine 25773-40-4 152.19 210.8±40.0 0.274
O C H3
N N C
H3 CH3
6 Table 1. Continued
Compound Name CAS Number Molecular Weight
(g/mol)*
Boiling point (°C)*
Vapor Pressure
(Torr)*
Chemical Structure OTC
(ng/L)
trans-2,cis-6-nonadienal 557-48-2 138.21 203.3±0.0 0.280
C H3
O
4.00[6]
2-isobutyl-3-methoxypyrazine 24683-00-9 166.22 210.8±35.0 0.273
CH3 C
H3 N
O N CH3
1.00[4]
2-methylisoborneol 2371-42-8 168.28 208.7±8.0 0.0487
C H3 C H3
C
H3 HO CH3 9.00[1]
β-cyclocitral 432-25-7 152.23 212.1±19.0 0.176 O
CH3 C H3
CH3
3,000[6]
2,3-benzopyrrole (indole) 120-72-9 117.15 253.0±9.0 0.0298 N
H
300,000[3]
trans,trans-2,4-decadienal 25152-84-5 152.23 244.6±0.0 0.0300
CH3
7 Table 1. Continued
Compound Name CAS Number Molecular Weight
(g/mol)*
Boiling point (°C)*
Vapor Pressure
(Torr)*
Chemical Structure OTC
(ng/L)
2,4,6-trichloroanisole 87-40-1 211.47 246.0±0.0 0.0436
C H3
O Cl
Cl
Cl 0.03
[1]
2,3,6-trichloroanisole 50375-10-5 211.47 254.1±35.0 0.0281
Cl Cl O
Cl
C H3
7.00[1]
geosmin 19700-21-1 182.30 252.4±8.0 3.01E-3
CH3
CH3 OH
4.00[1]
β-ionone 79-77-6 192.30 254.8±0.0 0.0169
CH3 O CH3
C H3
CH3
7.00[2]
2,4,6-tribromoanisole 607-99-8 344.83 298.0±0.0 2.31E-3
C H3
O Br
Br
Br 0.03
[1]
*Source: SciFinder Scholar (ACS, 2009). Calculated using Advanced Chemistry Development (ACD/Labs) Software V9.04 for Solaris (© 1994-2009
8
2-methylisoborneol (MIB). The compound 1,2,7,7-tetramethylbicyclo[2.2.1]heptan-2-ol, commonly known as 2-methylisoborneol or more succinctly MIB, was first isolated from actinomycetes by Gerber (1969). MIB is produced by some actinomycetes that also produce geosmin (Gerber, 1978). MIB is more volatile than geosmin and has a higher boiling point (Pirbazari et al., 1992). MIB is a methylated monoterpene and has similar chemical stability as geosmin and is typically more difficult to remove from water than geosmin. A musty odor is identified with 2-MIB and its OTC is in the 9-42 ng/L range (Krasner et al., 1983) with 9 ng/L often being the reported value (Malleret et al., 2001).
Trihalogenated anisoles. The compounds 2,4,6-trichloroanisole (2,4,6 TCA); 2,3,6-trichloroanisole (2,3,6 TCA) and 2,4,6-tribromoanisole (2,4,6 TBA) commonly form via biomethylation of trichlorophenols in distribution systems. Chlorophenols can form during the free chlorine disinfection of water sources containing phenol. Halogenated anisoles can have OTCs in the sub-ng/L range (Malleret et al., 2001, Diaz et al., 2005); e.g. the 2,4,6 isomers have an OTC of 30 pg/L. A study involving a T&O episode in Paris, France established that 2,4,6 TBA was released from the cementitious coating of a storage tank and was the principal cause of the musty odor of the water (Malleret and Bruchet, 2002).
2-isopropyl-3-methoxypyrazine (IPMP). IPMP is of major significance in the flavor of peas (Murray et al., 1970) and is responsible for the earthy aroma of potatoes (Buttery and Ling, 1973), the musty aroma of sterile milk (Gordon and Morgan, 1972), and the musty potato-like odor of some spoiled and chilled fish (Miller et al., 1973). In a survey conducted of 25 raw vegetables, 18 contained measurable quantities of IPMP (Murray and Whitfield, 1975). It has been described as having a “potato-bin/musty” odor by FPA panelists and has an OTC of 2 ng/L (Cotsaris et al., 1995, Young et al., 1996).
Marshy/swampy/septic/sulfurous
Dimethyl disulfide and dimethyl trisulfide. Alkyl sulfides can be produced by actinomycetes (e.g. Pseudonocardia thremophilia, Wilkins, 1996), by the cyanobacteria Microcystis (Juttner, 1984) and Anabaena (Juttner et al, 1983), and by the golden-brown alga Synura petersenii (Collins and Kalnins, 1965). Dimethyl disulfide is said to produce a decaying vegetation odor and dimethyl trisulfide a swampy/septic odor (Khiari et al., 1997). The OTC of dimethyl disulfide has been reported as 0.2-5 µg/L (Van Gemert and Nettenbreijer, 1977), and < 4 µg/L (Cotsaris et al., 1995) while that of dimethyl trisulfide is 10 ng/L (Buttery et al., 1976, Cotsaris et al., 1995).
2,3-benzopyrrole (indole). Indole has been associated with septic odors. It has been described as having a “fecal and stench” odor at high concentration and a pleasant odor at lower levels (Khiari et al., 1997). Its OTC has been reported as 300 µg/L (Van Gemert and Nettenbreijer, 1977, Young and Suffet, 1999).
Fishy/Rancid
9
cultured to produce polyunsaturated fatty acid (PUFA)-derived aldehydes associated with
fishy/rancid off flavors. Both the trans,cis (biological) isomers and the trans,trans derivatives of the compounds 2,4,7-decatrienal, 2,4-heptadienal and 2,4-decadienal (from Dinobryon) have been shown to cause fishy odors during an episode of high biomass algal growth under an ice-covered Canadian reservoir (Watson et al., 2001).
trans,trans-2,4-heptadienal. The compound t,t-2,4-heptadienal has been obtained from
Uroglena americana cultures (Yano, 1988; Watson et al., 1999) and confirmed to be responsible for the fishy/swampy type odors in some water supplies (Khiari et al, 1995). It can also originate from decaying grass in water (Khiari et al., 1995b). Young and Suffet (1999) determined its OTC to be 2.5-5 µg/L by FPA analysis.
1-heptanal (heptaldehyde). A flavor profile analysis (FPA) of 1-heptanal by Rashash et al., (1997) described its odor as “oily, slight citrus” (7 µg/L), ”oily” (21 µg/L) and “strong cilantro” (>80 µg/L), while Fabrellas et al. (2004) described 1-heptanal as having a rancid oil + fish, fruity (orange, mandarin) odor. It has been identified as an algal metabolite along with 1-hexanal in an isolate of Synedra rumpens Kutz from Lake Biwa (Japan) (Kikuchi et al., 1974). The OTC of 1-heptanal has been reported to be 3 µg/L (Cotsaris et al., 1995).
trans,trans-2,4-decadienal and trans,cis,cis-2,4,7-decatrienal. Decadienal and decatrienal are lipooxygenase-mediated cleavage products of Chyrosphyceae (golden-brown algae) and diatoms, respectively (Juttner, 1995). The trans,cis and trans,trans isomers of 2,4-decadienal have been identified in Poterioochromonas malhamensis (Juttner and Hahne, 1981), in Synura uvella (Juttner, 1981), and in Dinobryon isolates (Juttner et al., 1986).
2,4,7-decatrienal has been identified in the diatom Asterionella formosa (Juttner and Muller, 1979). The odor descriptor for trans,trans-2,4-decadienal and trans,cis,cis-2,4,7-decatrienal is “fishy, oily” and the OTC of trans,cis,cis-2,4,7-decatrienal is reported as 1.5 µg/L (Watson, 2004). No OTC has been reported for trans,trans-2,4-decadienal.
Grassy/hay/straw/woody
1-hexanal. Initially given a fishy odor descriptor, 1-hexanal (or n-hexanal) was identified as a metabolite of the diatom Synedra rumpens Kutz isolated from the Lake Biwa (Japan) (Kikuchi et al., 1974). The presence of 1-hexanal has also been associated with the algae Scendesmus
-3-hexen-1-10
ol has also been shown to be a product of the green alga Scendesmus suspicatus (Costaris et al., 1995) and is thought to contribute to the tomato aroma in some plants (Eskin, 1979). The OTC of cis-3-hexenyl acetate is 1.5 µg/L (Khiari et al., 1995).
trans-2,cis-6-nonadienal. This metabolite is produced by the cyanobacterium Synurapetersenii (Rashash et al., 1996) and has been confirmed as the cause for “cucumber” odor in water
(Burlingame et al., 1991b). Trans-2,cis-6-nonadienal can be formed by the oxidation of linolenic acid, and algae that form the acid also have the potential to form this conjugate aldehyde
(Rashash et al., 1997). The compound has also been found in cucumbers (Boelens et al., 1987; Schieberle et al., 1990). The FPA panel of the Philadelphia Water Department found the trans,trans configuration of the compound to have more rancid and oily organoleptic characteristics as compared to the green, cucumber characteristics of the trans,cis form (Burlingame et al., 1992). The FPA also found that for the trans,cis form at its OTC (4 ng/L, Rashash et al., 1996) the odor was sweet, green vegetation, at 60 ng/L it was a distinctive fresh green cucumber odor, while at higher concentrations the odor became more waxy, oily, and rancid.
Fragrant: vegetable/fruity/flowery
2-isobutyl-3-methoxypyrazine (IBMP). The compound IBMP is similar to IPMP in structure and like IPMP, IBMP is present in numerous vegetables. It has been described by FPA panelists as having a “vegetable” and “bell pepper” like odor and an OTC of 1-2 ng/L (Khiari et al., 1992; Khiari et al., 1997; van Gemert and Nettenbreijer, 1977, Young et al., 1996).
6-methyl-5-hepten-2-one. This compound is produced by cyanobacteria such as Synechococcus strains (Henatsch and Juttner, 1983) and Anabaena cylindrica (Juttner et al., 1983) as well as by the golden-brown alga Synura uvella (Juttner, 1981). Its odor descriptor is fruity and ester-like, and it has an OTC of 50 µg/L (Watson, 2004).
β-cyclocitral. The nor-carotenoid 2,6,6-trimethyl-1-cyclohexane-1-carboxaldehyde (or β-cyclocitral) may be a degradation product of carotenes and has been observed at significant levels by Juttner (1976, 1983, 1984a, 1987) in Microcystis wesenbergii, Microcystis viridis and Microcystis aeruginosa. The odor character of β-cyclocitral changes with concentration.
Between 2 and 20 µg/L in distilled water it imparts a hay/woody odor (Young et al., 1999) while at higher concentrations it has a “tobacco-like” odor (Juttner, 1976, Slater and Block, 1983b). Based on the results of Rashash et al. (1996), the OTC of β-cyclocitral is 3 µg/L.
11 2.2 Causes of taste and odor
The causes of taste and odor problems have been largely attributed to microbial byproducts, to disinfectants and disinfection byproducts, and to distribution system processes and materials (Whelton and Dietrich, 2003).
Microbial byproducts
Of all the T&O compounds related to microbial byproducts, MIB and geosmin are the most extensively researched. Both MIB and geosmin were originally associated with the
heterotrophic actinomycete bacteria (Gerber, 1968; Medsker, 1968). It was after the study by Tabachek and Yurkowski (1976) that the photoautotrophic cyanobacteria were also implicated with the production of T&O compounds and became recognized to be the dominant source of these compounds (Juttner and Watson, 2007). The genus Streptomyces (actinomycetes) has been reported to produce not only MIB and geosmin but also other musty/earthy smelling compounds (e.g. IBMP and IPMP, dimethyl disulfide, dimethyl trisulfide) (Zaitlin and Watson, 2006). Among the cyanobacteria, a long list of genera (e.g. Anabaena, Aphanizomenon, Microcystis, Oscillatoria, Phormidium) is associated with the occurrence of MIB, geosmin and other T&O compounds (Juttner and Watson, 2007). Table 2 lists some common T&O compounds and the algae/cyanobacteria/actinomycetes groups that produce them. In addition, soil fungi in the genera Penicillium, Aspergillus and Chaetomium can produce MIB and geosmin (Borjesson et al., 1993; Bjurman and Kristensson, 1992; Kikuchi et al., 1983). Geosmin and MIB occur as both cellular (bound) and dissolved fractions (extracellular products) and the differentiation between these fractions is essential for effective water quality analysis and management (Juttner and Watson, 2007; Rashash et al., 1996).
Suffet et al. (1999) point out that a presumptive test (identifying an organism considered to be the cause of a particular T&O problem and quantifying its population density) will not be sufficient to confirm that the microorganism under question is the true cause for the T&O problem. They describe the “rules-of-evidence” method that must be satisfied to validate a cause-and-effect relationship with either one of the following steps:
1. Correlating the odor produced by an organism isolated by culture techniques to the original odor problem in the water as determined by a sensory panel.
2. Isolating microbial metabolites causing the odor from the culture and confirming the compounds by GC/MS.
3. Isolating the microbial metabolites causing the odor from natural water samples.
12
Table 2. Common taste and odor compounds and the major algae /actinomycetes associated with them
Compound Major algae group and dominant taxa Actinomycete taxa Odor descriptors Source
Geosmin
Anabaena, Aphanizomenon, Fischerella,
Lyngbya, Oscillatoria,
Phormidium,Schizothrix, Symploca
Streptomyces earthy-corn-musty Gerber(1979),Zaitlin and Watson, 2006
2-methylisoborneol (MIB) Oscillatoria, Phormidium, Pseudanabaena,
Synechococcus Streptomyces earthy-musty
Gerber(1979),Zaitlin and Watson, 2006
β-cyclocitral
Anabaena circinalis, Aphanizomenon flosaquae Microcystis wesenbergii, Microcystis
viridis and Microcystis aeruginosa
sweet-fruity-chocolate-pipe
tobacco
Watson et al., 2000, Young et al., 1999; Juttner, 1984; Juttner et
al., 1983
2,4-heptadienal, 2,4-decadienal, 2,4,7-decatrienal
Chrysosphaerella, Dinobryon sociale, Synura
petersenii fishy
Juttner et al., 1995, Watson et al., 2000
trans,trans-2,4-heptadienal Uroglena Americana fishy Yano et al., 1988
trans-2,cis-6-nonadienal Chrysosphaerella, Dinobryon sociale, Synura
petersenii cucumber Watson et al., 2000
cis-3-hexen-1-ol,
cis-3-hexenyl acetate Scenedesmus subspicatus grassy Khiari et al., 1999
2-isobutyl-3-methoxypyrazine,
2-isopropyl-3 methoxypyrazine Streptomyces
Septic, decaying vegetation
Gerber(1979),Zaitlin and Watson, 2006
dimethyl disulfide,
dimethyl trisulfide Microcystis, Anabaena
Streptomyces,Pseudonocardia , Saccharomonospora,
Thermoactinomyces, Thermomonospora
Septic, decaying vegetation
Wilkins(1996); Zaitlin and Watson, 2006; Juttner, 1984; Juttner et
al., 1983
6-methyl-5-hepten-2-one Synechococcus, Anabaena,Synura Thermoactinomyces Fruity, flowery,
tobacco
13 Disinfectants and disinfection products
Chlorinous T&O problems are the primary cause of consumer complaints at utilities in the U.S (Suffet et al., 1996) and in France (Bruchet, 1999). Such T&O episodes are usually associated with the detection of chlorinated, brominated and iodinated disinfection byproducts (DBPs) (Bruchet, 1999). Halogenated anisoles impart an earthy-musty odor and have OTCs in the pg/L range. For example, brominated anisoles found in treated waters have an OTC of 30 pg/L (Malleret et al., 2001). The chlorinous odor is pH dependent (odor intensity decreases as pH is raised from 5.5 to 8.5) and so is the formation of odorous chloro- and bromophenols (optimum formation at 8< pH < 9) (Bruchet, 1999; Suffet et al., 1999). Table 3 summarizes odorous compounds associated with disinfectants and DBPs, their method of formation, and the primary T&O group descriptor.
Table 3. Disinfectants and disinfection byproducts
Odorous compounds Formation method Odor
descriptor
References
Free Chlorine, Chloramines Chlorination Chlorinous Krasner and Barret, 1984 Chlorophenols, Bromophenols Free chlorine + phenol
+ (Bromide)
Medicinal Khiari et al., 1999b
Brominated/Iodinated Haloforms Free chlorine + NOM +bromide/iodide
Medicinal Cancho et al., 1999
Halogenated anisoles (e.g. 2,4,6-trichloroanisole, 2,3,6-trichloroanisole
and bromoanisoles)
Biomethylation of halogenated phenols
Earthy-musty Malleret et al., 2001, Diaz et al., 2005
Distribution system
About 65% of U.S utilities surveyed by AWWA in 1989 identified the distribution systems as the primary cause of their T&O problems (Suffet et al., 1996). The major causes leading to T&O episodes in the distribution system are either (1) of biological origin, (2) related to disinfection or oxidation byproducts, or (3) associated with leaching of chemicals from distribution system materials. The first two causes were discussed above. Regarding T&O occurrences related to the materials used in distribution systems and premise plumbing, Tomboulian et al. (2004) identified the following scenarios:
14
the reservoir. It was discovered that under high pH conditions, triphenylphosphate leached from the PVC and reacted with the chlorine residual to form an odorous trichlorophenol hydrolysis product.
b) Non-compliance of rules during application of coatings and additives, which results in adverse T&O episodes, especially after any new installation or maintenance work. A T&O episode in eastern France with customer complaints describing phenol/styrene-type odors occurred in May 1994 (Khiari et al., 1999). On investigation, it was discovered that one of the reservoirs had recently been lined with acrylic coating reinforced with fiberglass. Laboratory experiments demonstrated that phenol was leaching from the coating material, which led to the formation of iodinated by-products (known to produce medicinal odors) that were found in the sample. A defective batch of the material used for lining the tanks was determined to be the cause of the problem.
c) Periods of stagnation in the distribution system leading to increases in trace level contamination. A T&O complaint in Barcelona, Spain, was related to the occurrence of medicinal odors. Stagnation exacerbated the problem, and it was postulated that either slow formation kinetics of brominated compounds or the dissipation of chlorine residual, which could have masked the odor initially, were the cause (Khiari et al., 1999). The treated water had been standing in the distribution system for longer than usual due to maintenance.
Tomboulian et al. (2004) give a comprehensive list of materials typical of most distribution systems and the possible undesirable organoleptic characteristics that can be associated with them. These compounds were not targeted in this study.
2.3 Taste and odor compound detection and quantification
A distinct odor as perceived by humans is often the result of a complex mixture of volatile compounds, and the concentration-response relationship for every compound is unique. The odor threshold concentration (OTC) is defined as the lowest concentration at which the odor is perceived. The OTC is determined from a flavor profile analysis (FPA) as the concentration of a compound that is needed in a FPA sample to evoke an average intensity rating of 2 from
panelists when the sample temperature is 45oC (Rashash, 1994). Generally the psychometric function (concentration-response) of the compounds is a sigma plot. There is a gradual
15 Sensory methods
Sensory methods involve qualitative description of tastes or odors and rating the quality on an intensity scale. Sensory analysis is typically conducted by a FPA panel of trained professionals. The OTCs for many T&O compounds are below instrumental detection limits and hence sensory methods are often more sensitive than instrumental methods (Suffet et al., 2004). However sensory methods also have disadvantages such as:
a) Sensory methods require highly trained panelists and are labor intensive. For example the FPA directs panelists to record descriptors quantitatively on a 7-point scale for all T&O compounds.
b) Sensory methods are also highly subjective to the individuals on the panel. Sensory panels relate the chemical concentration in water samples to the odor intensity using either the Weber-Fechner model or the Stevens’s power model. Alternatively, the TON (threshold odor number) is defined as the highest dilution of the water sample at which more than one individual can perceive an odor. This is a much simpler method than the FPA and was originally used as a standard method in T&O analysis (APHA et al., 2005). Overall sensory methods have an important place for the early detection of T&O events during the regular monitoring of source and finished waters. Also, new and simpler FPA versions are in use today. The simpler methods include (1) the attribute rating test; (2) the 2-out-of-5 odor test; and (3) the rating method for evaluating distribution system odors in comparison to a control (Dietrich et al., 2004).
Instrumental methods
Instrumental methods of analysis have the advantage of objectivity, repeatability, and accuracy. Instrumental methods are able to confirm the identity and quantity of the compound responsible for the T&O problem. However, instrumental methods also have some disadvantages. E.g., because the OTCs of many T&O compounds are in the ng-pg/L range, instrumental detection limits are a limiting factor, and a preconcentration step is needed for the analysis. Another potential disadvantage is that the instrument is set to detect and quantify only the compounds you are looking for, and the compound causing the T&O problem might not be in the analyte list of the method. The need for low detection limits necessitates the use of highly sophisticated instrumentation like gas chromatography/mass spectrometry for separation/detection in addition to a preconcentration step.
16
are determined (March, 1997). GC-MS methods have emerged as the method of choice in T&O detection and analysis for three primary reasons: (1) high sensitivity and high resolving power; (2) ability to yield a spectral signature for each compound that can be used for simultaneous quantitation and structural confirmation of the compounds, and (3) convenience of bench-top GC-MS systems that have become available in many laboratories (Suffet et al., 1995). Table 4 summarizes analytical methods that have been used for each primary odor group (Suffet et al., 1995). Chemical properties like polarity, volatility, hydrophobicity, boiling point, and
molecular weight of the compounds in the analyte list are all important when deciding on the analytical method for T&O compounds.
Sensory GC or GC-olfactometry is the technique of using human assessors to detect and evaluate the volatile compounds eluting from a GC column. GC-olfactometry has found many
applications in the food and beverage industry (Delahunty et al., 2006). It is often used as a complement to chemical analysis of T&O compounds (Anselem et al., 1985; Peter et al., 2009) with the objectives of characterizing the odor profile of a sample and quantifying the relative importance of various compounds to a particular odor (Delahunty et al., 2006). Disadvantages of this method of analysis include: (1) sensory GC detects compounds that are present at
concentration levels lower than their OTCs in water as they are volatilized into pure states in the GC column, and (2) sensory GC does not account for the synergistic effect of compounds that yields a particular odor. However, sensory GC can be used to screen potential T&O candidates in a sample that result from a GC-MS analysis (Suffet et al., 1995).
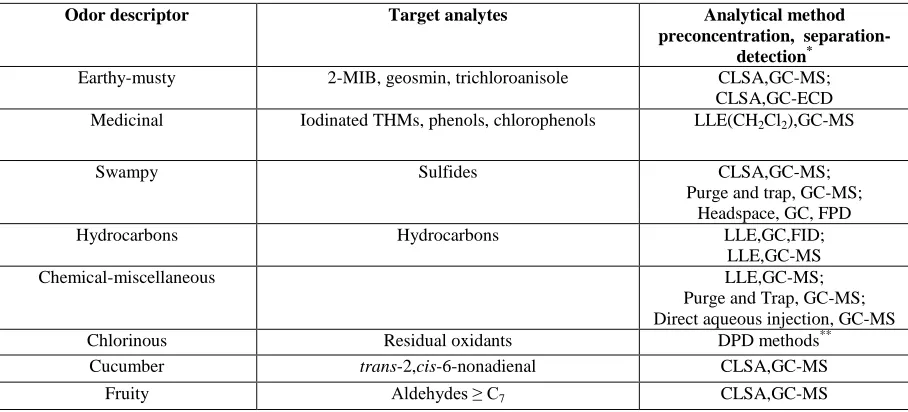
Table 4. Analytical methods of choice for common odor categories (adapted from Suffet et al., 1995)
Odor descriptor Target analytes Analytical method
preconcentration, separation-detection*
Earthy-musty 2-MIB, geosmin, trichloroanisole CLSA,GC-MS; CLSA,GC-ECD
Medicinal Iodinated THMs, phenols, chlorophenols LLE(CH2Cl2),GC-MS
Swampy Sulfides CLSA,GC-MS; Purge and trap, GC-MS;
Headspace, GC, FPD
Hydrocarbons Hydrocarbons LLE,GC,FID; LLE,GC-MS
Chemical-miscellaneous LLE,GC-MS; Purge and Trap, GC-MS; Direct aqueous injection, GC-MS
Chlorinous Residual oxidants DPD methods**
Cucumber trans-2,cis-6-nonadienal CLSA,GC-MS
Fruity Aldehydes ≥ C7 CLSA,GC-MS
* CLSA - closed loop stripping analysis; ECD - electron capture detector; LLE - liquid-liquid extraction; FPD -
17
Preconcentration techniques. Preconcentration techniques in use for the detection of T&O compounds include (1) closed loop stripping analysis (CLSA) (Standard method 6040, APHA et al., 2005), (2) simultaneous distillation extraction (SDE) (Khiari et al., 1995), (3) purge and trap, (4) open stripping analysis (OSA), (5) liquid-liquid extraction (LLE), (6) liquid-liquid
microextraction (LLME), (7) continuous liquid-liquid extraction (CLLE), (8) solid-phase extraction (SPE) with different adsorbents, and (9) solid-phase micro-extraction (SPME). The LLE, SDE, CLSA and OSA methods have been shown to give low detection limits but require a large sample size, require expensive equipment, and are time consuming and labor intensive. The SPME method developed by Pawliszyn et al. (1990) has found application as a
preconcentration technique across various fields and different matrices such as drinking water (Pan and Pawliszyn, 1997), wastewater (Huang et al., 2004), foods and beverages (Yang and Pepard, 1994), environmental samples (Chai et al., 1993; James and Stack, 1996), and biological samples (e.g. human blood and urine) (Lee et al., 1996). The major advantages of SPME as compared to other preconcentration techniques are: (1) small sample volume requirement, (2) elimination of organic solvents, and (3) suitability for automation. Furthermore, head space SPME (HSPME) eliminates the need of the fiber to be immersed in the sample and thus can be effectively used in matrices with suspended matter (Bao et al., 1999; Huang et al., 2004; Watson et al., 2000).
2.4 Treatment techniques for mitigating taste and odor problems
The biggest challenge in treating T&O compounds in drinking water is related to their presence and olfactory detection at low concentrations (pg/L-µg/L). Their removal is required from a complex mixture that contains organic matter and inorganic matter at mg/L levels. These
18
Table 5. Treatment methods, target T&O categories, and advantages/disadvantages of treatment methods
Treatment Method Target T&O odor categories Advantages Disadvantages Sources
Oxidation - Chlorine, chloramines, chlorine dioxide
Earthy/musty; Chlorinous; Grassy/woody; Swampy; Fragrant; Fishy; Medicinal; Chemical
a) Both disinfection and oxidation in one step
b) Chlorine and chlorine dioxide oxidize many T&O compounds c) Chloramines reduce chlorinous odor but cannot oxidize many T&O compounds
d) Tendency to mask other odors
a) Ineffective for MIB and geosmin
b) Impart chlorinous type odor and some DBPs impart medicinal/earthy musty odor
Reckhow, 1996; Kirmeyer et al., 1993; Lyn et al., 1995
Oxidation - Potassium permanganate
Compound-selective oxidant; effective for β-cyclocitral, linolenic acid, and trans-2,cis-6-nonadienal.
a) Inexpensive a) A weaker oxidant compared to ozone and chlorine
b) Selective oxidant - does not target many compounds, including MIB and geosmin
Lalezary et al., 1986; Ficek and Waer, 1993; Dietrich et al., 1995
Oxidation - Ozone/Advanced oxidation processes (AOPs) -
Earthy/musty; Chlorinous; Grassy/woody; Swampy; Fragrant; Fishy; Medicinal; Chemical
a) Powerful oxidant effective for MIB and geosmin
b) Ozone/GAC combination most efficient for T&O removal. c) Also removes color and many micropollutants
a) Both disinfection and oxidation in one step
a) Forms aldehydes and ketones as byproducts creating fragrant/fruity odor b) Need “promoter” e.g. H2O2
or NOM for generation of OH radicals
c) Expensive compared to chlorination/potassium permanganate
19 Table 5. Continued
Treatment Method Target T&O odor categories Advantages Disadvantages Sources
Adsorption - GAC, PAC Earthy/musty; Medicinal; Chemical; Fishy/Swampy.
a) “Tried and true” method that removes the compound from water instead of just
transforming it.
a) Expensive; not effective for all T&O categories.
DeMarco, 1994; Smith and Pettit, 1996; Graham et al., 1996; Simpson et al., 1997; Krasner et al., 2004. Biological Treatment Earthy/musty; Fishy; Swampy;
Medicinal
a) Combination of ozone/GAC or ozone and any granular media filter helps produce biologically stable water, less chlorine demand and fewer T&O problems in distribution system.
a) Less commonly implemented in the U.S.
Huck, 1996; Norton et al., 1997; Rice and Hansen, 1994; Croll, 1996 Membranes Salty; many T&O compounds a) Can control a variety of
off-flavours.
b) Advances in membrane materials has broadened application for T&O removal.
a) Expensive
b) Concentrate disposal
20
3. Materials and Methods 3.1 Chemicals and materials
Table 6 summarizes information about the T&O compounds and other chemicals used in this study. Apart from their name, CAS number, purity, and source, Table 6 lists the stock standard solution concentration if the compound was purchased in methanol or the density of the neat compound if the pure substance was purchased. Deionized water was used as a laboratory blank to account for background corrections and to prepare the calibration standards.
A 1-cm divinylbenzene/ carboxenTM/ polydimethylsiloxane stableflexTM (DVB/CAR/PDMS) SPME fiber (Supelco 57329-U) was used for sample preconcentration by headspace SPME. Every new fiber was conditioned at 270oC for 2 hours before sample analysis. Twenty-mL clear glass vials (Supelco SU860097) fitted with open top screw caps and PTFE-faced silicon septa (Supelco SU860101) were used to hold samples for GC-MS/MS analysis.
Sodium chloride was baked at 450oC for 4 hours prior to use as a salting out agent. The 20-mL sample vials were washed in soap, rinsed three times with DI water, and baked at 550oC for 2 hours. Screw caps and PTFE-faced silicone septa (Sigma Aldrich, Inc.) were rinsed three times with DI water and baked at 105oC. The 5, 10, 100 and 1000 µL microsyringes used to prepare the standards were rinsed with methanol 10-15 times between the use of different solutions. 3.2 Instrumentation
A Varian (Palo Alto, CA, USA) Saturn 2200 tandem mass spectrometer (MS/MS) connected to a Varian 3800 gas chromatograph (GC) and a Combi PALTM SPME autosampler was used for method development and sample analysis. The Combi PALTM autosampler (CTC Analytics AG, Zwingen, Switzerland) had a built-in agitator that enabled heated agitation of the sample during the SPME process. The GC was fitted with a capillary split/splitless injector (Varian 1177). The capillary column used was a FactorFour VF-5ms column - 30m x 0.25 mm, 0.25 µm film
21 Table 6. Names, properties, and sources of compounds used in this study.
Compound Name CAS Number Purity (%)
Stock solution concentration
in methanol (µg/ml)
Density of neat material
(g/cm3) Vendor
dimethyl disulfide 624-92-0 99.9 1000 Supelco
hexanal-d12 99.5 atom%D 0.890 CDN Isotopes
1-hexanal 66-25-1 98 0.814 Aldrich
cis-4-heptenal 6728-31-0 ≥98 0.850 SAFC
1-heptanal (heptaldehyde) 111-71-7 ≥95 0.818 Fluka
dimethyl trisulfide 3658-80-8 99.9 1000 Supelco
cis-3-hexenyl acetate 3681-71-8 ≥98 0.897 SAFC
trans,trans-2,4-heptadienal 4313-03-5 90 0.881 Aldrich
2-isopropyl-3-methoxypyrazine 25773-40-4 99.9 100 Supelco
trans-2,cis-6-nonadienal 557-48-2 95 0.866 Aldrich
2-isobutyl-3-methoxypyrazine 24683-00-9 99.9 100 Supelco
methylisoborneol-d3 135441-89-3 >99 atom%D CDN Isotopes
2-methylisoborneol 2371-42-8 99.9 100 Supelco
β-cyclocitral 432-25-7 ≥90 0.943 SAFC
2,3-benzopyrrole (indole) 120-72-9 99.9 2000 Supelco
trans,trans-2,4-decadienal 25152-84-5 85 0.857 Aldrich
2,4,6-trichloroanisole 87-40-1 99.1 100 Supelco
2,3,6-trichloroanisole 50375-10-5 99.9 Sigma-Aldrich
geosmin 19700-21-1 99.8 100 Supelco
β-ionone 79-77-6 96 0.945 Aldrich
2,4,6-tribromoanisole 607-99-8 99 Aldrich
sodium chloride 7647-14-5 Certified ACS Fisher Scientific
methanol (LC-MS chromasolv) 67-56-1 99.9 Fluka
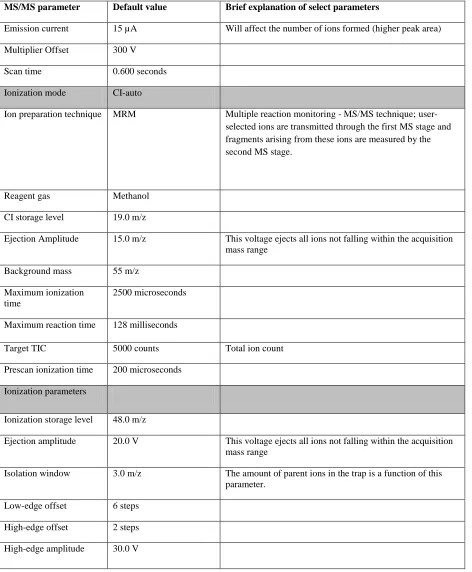
22 Table 7. Default settings for mass spectrometer
MS/MS parameter Default value Brief explanation of select parameters
Emission current 15 µA Will affect the number of ions formed (higher peak area) Multiplier Offset 300 V
Scan time 0.600 seconds Ionization mode CI-auto
Ion preparation technique MRM Multiple reaction monitoring - MS/MS technique; user-selected ions are transmitted through the first MS stage and fragments arising from these ions are measured by the second MS stage.
Reagent gas Methanol CI storage level 19.0 m/z
Ejection Amplitude 15.0 m/z This voltage ejects all ions not falling within the acquisition mass range
Background mass 55 m/z Maximum ionization
time
2500 microseconds
Maximum reaction time 128 milliseconds
Target TIC 5000 counts Total ion count Prescan ionization time 200 microseconds
Ionization parameters
Ionization storage level 48.0 m/z
Ejection amplitude 20.0 V This voltage ejects all ions not falling within the acquisition mass range
Isolation window 3.0 m/z The amount of parent ions in the trap is a function of this parameter.
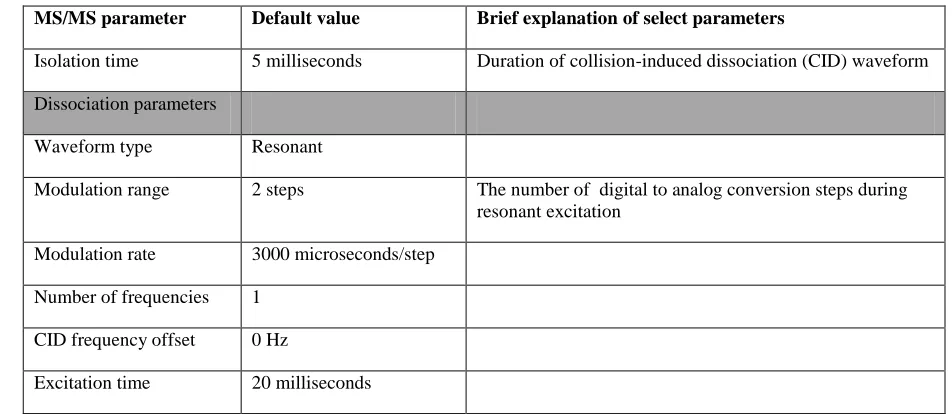
23 Table 7. Continued
MS/MS parameter Default value Brief explanation of select parameters
Isolation time 5 milliseconds Duration of collision-induced dissociation (CID) waveform Dissociation parameters
Waveform type Resonant
Modulation range 2 steps The number of digital to analog conversion steps during resonant excitation
Modulation rate 3000 microseconds/step Number of frequencies 1
CID frequency offset 0 Hz
Excitation time 20 milliseconds
3.3 Methods Preconcentration
Solid phase microextraction (SPME) of T&O compounds from the headspace of a water sample was carried out at 65ºC for 30 minutes using 1-cm DVB/CAR/PDMS SPME fibers. To 10 mL of sample, about 2.5 grams of sodium chloride was added in 20-mL glass vials. Salt addition decreases the solubility of the compounds in water and along with stirring has been shown to accelerate the mass-transfer from the aqueous phase into the headspace of the vial (Bao et al., 1999). The salt-sample mixture was placed in the autosampler tray of the Combi PALTM that was programmed to perform the following sequential steps: (1) preheat sample in the agitator at 300 rpm for 30 minutes at 65ºC to ensure that the sample is at 65ºC before extraction begins, (2) insert SPME fiber through the septum and adsorb T&O compounds from the headspace for 30 minutes in the agitator (fiber depth at 22 mm from the bottom of the vial, agitator set at 250 rpm, agitator rotation stopped for 2 seconds every 30 seconds), and (3) desorb at 250ºC for 5 min into the GC injector (with 0.8-mm glass liner) that operated initially in the splitless mode. The injector was switched to the split mode with a split ratio of 20:1 after 3.00 minutes of desorption. The carrier gas was helium at a flow rate of 1.5 mL/min. The Combi PALTM settings and the GC-injector settings are summarized in Table 8.
24 Table 8. SPME conditions and GC-injector settings
Combi PALTM settings
Incubation Temperature 65oC
Agitator On time 30 seconds
Agitator Off time 2 seconds
Vial Penetration 22 mm
Extraction time 30 minutes
Injection penetration 54 mm
Desorption time 5 minutes
Injector (Varian Type 1177)
Oven temperature 250 oC
Split ratio initial On at 20:1
Split ratio at 0.01 minutes Off
Split ratio at 3.00 minutes On at 20:1
Column flow 1.5 mL/min
Separation
Separation of T&O compounds was achieved with a FactorFour VF-5ms column with the following temperature program: 35ºC for 23 minutes, ramp to 139ºC at a rate of 4ºC/min, ramp to 301ºC at a rate of 27ºC/min, and hold at 301ºC for 5 minutes. Many T&O studies have utilized the same or similar columns, and the temperature program was previously shown to be effective for a method developed for 12 fishy, swampy, and grassy odor compounds (Sclimenti and Krasner, 2003). The optimal method run time was determined to be seventy minutes and twenty seconds by the Varian Software.
Detection/Quantification
25
The dominant daughter ion for each compound was chosen as the quantitation ion. Detailed descriptions of the AMD results are provided in Chapter 4.
Preparation of stock standard and intermediate standards
Stock standard solutions purchased in methanol were kept at -17oC and were used prior to the listed expiration date. For compounds purchased in neat form, stock standard solutions were prepared by dissolving a certain volume (in µL: 2 / density of the neat compound) in 2 mL of methanol to obtain a 1000 mg/L stock standard solution. E.g. to prepare 1000 mg/L of 1-hexanal stock, 2 /0.814 = 2.5 µL of the neat compound was added to 2 mL methanol. Intermediate standards were prepared from stock standard solutions and stored at -17oC for up to two months. Table 9 summarizes the stock standard solution concentrations for each compound and provides details on the preparation of intermediate standards and calibration stock mixtures.
Calibration mixtures and standards
Based on instrument responses of preliminary sample analyses, compounds were grouped into a high and a low sensitivity bin. Group 1 compounds exhibited high sensitivity while Group 2 compounds exhibited lower sensitivities. Accordingly, two calibration mixtures were prepared as follows: a high-concentration calibration mixture (12.5 mg/L) for Group 2 compounds and a low-concentration calibration mixture (125 µg/L) for Group 1 compounds. The calibration curves were obtained with seven aqueous calibration standards. Serial dilutions of the
calibration mixtures (12.5 mg/L and 125 µg/L) yielded intermediate solutions from which the seven calibration standards were prepared (Table 10). MIB-d3 and hexanal-d12 were the internal standards for the Group 1 and Group 2 compounds, respectively (Table 9). The internal standards were spiked at 10 ng/L (MIB-d3) and 500 ng/L (hexanal-d12) in every calibration standard.
Isotope dilution method
26
Table 9. Concentrations of stock standard solutions and procedures used to obtain intermediate standards and calibration standard mixtures.
Compound Name
Stock standard solution concentration in methanol (mg/L)
Volume of stock standard solution added to acetone to prepare 2 mL of
intermediate standard (µL)
Volume of stock/intermediate standards to make calibration mixtures (µL)
Calibration Mixture 1
(Group 1) Intermediate Standards (5mg/L each)
Calibration stock mixture containing 125 µg/L of each compound in 2 mL acetone
2-isopropyl-3-methoxypyrazine 100 100 50
2-isobutyl-3-methoxypyrazine 100 100 50
2-methylisoborneol 100 100 50
β-cyclocitral 1000 10 50
2,4,6-trichloroanisole 100 100 50
2,3,6-trichloroanisole 1308 7.6 50
geosmin 100 100 50
β-ionone 1000 10 50
2,4,6-tribromoanisole 100 100 50
Calibration Mixture 2 (Group 2)
No intermediate standards. Calibration stock mixture prepared directly from stock
standard solutions
Calibration stock mixture containing 12.5 mg/L of each compound in 2 mL acetone
dimethyl disulfide 1000 25
1-hexanal 1000 25
cis-4-heptenal 1000 25
1-heptanal (heptaldehyde) 1000 25
dimethyl trisulfide 1000 25
cis-3-hexenyl acetate 1000 25
trans,trans-2,4-heptadienal 1000 25
trans-2,cis-6-nonadienal 1000 25
2,3-benzopyrrole (indole) 2000 12.5
trans,trans-2,4-decadienal 1000 25
Internal Standards Second intermediate standard of 100 µg/L
in 2mL acetone for MIB-d3
methyl-d3-isoborneol 1120 8.9 40
27 Table 10. Concentrations and preparation of calibration standards.
Group 1 Compounds Group 2 Compounds Internal Standards
Calibration Points
Concentration to be achieved
in 10-mL calibration standard (ng/L) Concentration of stock mixture from which calibration standard was prepared (µg/L) Volume added to 10-mL calib. standard (µL) Concentration to be achieved
in 10-mL calibration standard (ng/L) Concentration of stock mixture from which calibration standard was prepared (mg/L) Volume added to 10-mL calib. standard (µL) Concentration to be achieved in 10-mL calibration standard (ng/L)
Concentration of stock mixture
Volume added to 10-mL calib.
standard (µL) MIB- d3 Hex-d12 MIB-d3 (µg/L) Hex-d12 (mg/L) MIB-d3 Hex-d12
1 0.1 1.25 0.8 10 0.125 0.8 10 500 100 5 1 1
2 0.5 1.25 4.0 50 0.125 4.0 10 500 100 5 1 1
3 1 12.5 0.8 100 1.25 0.8 10 500 100 5 1 1
4 5 12.5 4.0 500 1.25 4.0 10 500 100 5 1 1
5 10 62.5 1.6 1000 6.25 1.6 10 500 100 5 1 1
6 25 62.5 4.0 2500 6.25 4.0 10 500 100 5 1 1
28
4. Results and Discussion
To meet the objectives of this study, the following tasks were completed:
1) Validate suitable conditions for effective headspace SPME preconcentration and separation of the 19 T&O compounds on the GC column.
2) Determine optimal MS/MS settings.
3) Develop calibration curves for the 19 T&O compounds.
4) Determine the limit of detection (LOD) and limit of quantitation (LOQ) for each T&O compound.
5) Test the developed method with different water samples from NC: algal bloom samples, drinking water and distribution system samples were analyzed using the method after calibration curves were developed.
The results of tasks 1 and 2 are described in section 4.1 while the results of tasks 3-5 are described in sections 4.2 to 4.4 of this chapter.
4.1 Method development
Preconcentration and compound separation
To ensure effective preconcentration and separation of the 19 target analytes, a previously used headspace SPME method and GC temperature program for the analysis of 12 T&O compounds (Sclimenti and Krasner, 2003) was used as a starting point. After preliminary testing, the same SPME conditions and GC temperature program were chosen in this study because they
effectively concentrated and separated the 19 T&O compounds targeted in this study. For compounds with similar retention times, the ion trap MS/MS method used here had the capability to individually detect and quantify two compounds in the same MS/MS segment. Ion trap - MS/MS optimization
Tandem mass spectrometry is the process of carrying out two mass selective operations in series. The first step isolates the parent ion while the second isolates a parent ion fragment known as the product or quantitation ion. The collision-induced dissociation (CID) or fragmentation is
29
Table 7 summarized default MS values that were not adjusted during method development. The acquisition mass range, optimal excitation amplitude, and the excitation storage level were determined for each compound using the automated method development (AMD) feature of the Varian software. The acquisition mass range was determined from the parent ion and
quantitation ion mass-to-charge ratios (m/z) as described in detail below.
1) The first step in the determination of the ion trap-MS/MS settings was identification of the parent ion mass for each compound. To ensure effective identification of the parent ion mass and retention time, analyses of individual T&O compounds were initially conducted in single-stage CI-MS mode to obtain the total ion chromatogram (TIC, capturing all ions in the 40-650 m/z range). Analyses were conducted following headspace SPME of 10-mL samples containing 1, 10 or 50 µg L-1 of an individual T&O compound and 2.5 g NaCl. The TIC was used to identify both a first estimate of retention time and the most abundant ion, which was considered to be the parent ion. Figure 2 depicts a representative chromatogram, from which the retention time and parent ion mass for trans,trans-2,4-heptadienal were determined to be 34.96 minutes and m/z = 110.8, respectively. Parent ion chromatograms and mass spectra for all 19 T&O compounds targeted in this study are shown in the Appendix, and parent ion masses are summarized in Table 11.
30
Figure 2. Parent ion chromatogram (top) and mass spectrum (bottom) of trans,trans- 2,4-heptadienal.
10 20 30 40 50
minutes 0
25 50 75 100 125 150
kCounts 3-5-2009 t,t-2,4,hep t&o-ci-spme.SMS Ions: 111.0
40:650 1A
100 200 300 400 500 600
m/z 0%
25% 50% 75% 100%
66.9 4740
110.8 58412
152.9 31217
154.0 3784
Spectrum 1A
31
Table 11. Molecular weight and parent ion for each target analyte.
Compound Concentration
(µg/L)
Molecular weight (Da)
Parent ion (m/z)
dimethyl disulfide 50 94.2 95
hexanal-d12 10 112.23 92.8
1-hexanal 10 100.16 82.8
cis-4-heptenal 50 112.17 95
1-heptanal (heptaldehyde) 10 114.19 96.7
dimethyl trisulfide 10 126.26 127
cis-3-hexenyl acetate 50 142.2 83
trans,trans-2,4-heptadienal 50 110.15 110.8
2-isopropyl-3-methoxypyrazine 1 152.19 153
trans-2,cis-6-nonadienal 50 138.2 121
2-isobutyl-3-methoxypyrazine 1 166.22 167
methylisoborneol-d3 1 171.30 153.8
2-methylisoborneol 1 168.3 151
β-cyclocitral 1 152.23 153
2,3-benzopyrrole (indole) 50 117.15 118
trans,trans-2,4-decadienal 10 152.23 153
2,4,6-trichloroanisole 1 211.5 211
2,3,6-trichloroanisole 1 211.5 211
geosmin 1 182.3 165
β-ionone 1 192.3 193
32
10 20 30 40 50
minutes 0
1 2 3 4 5
MCounts 6-13-2009 t,t,2,4,hepta-1 t&o-ci-amd17.SMS 111.0>80:150 [0.00V] 111.0>80:150 [0.00V]1A
80 90 100 110 120 130 140 150
m/z 0%
25% 50% 75% 100%
110.8 4.842e+6 Spectrum 1A
30.188 min, Scan: 2936, 111.0>80:150 [0.00V], Ion: 75 us, RIC: 5.161e+6, BC
33
10 20 30 40 50
minutes 0.0
0.5 1.0 1.5 2.0 2.5 3.0 3.5
MCounts 6-13-2009 t,t,2,4,hepta-1 t&o-ci-amd17.SMS 111.0>80:150 [0.40V] 111.0>80:150 [0.40V]
1A
80 90 100 110 120 130 140 150
m/z 0%
25% 50% 75% 100%
92.8 809700
110.8 2.261e+6
111.8 177514 Spectrum 1A
30.208 min, Scan: 2938, 111.0>80:150 [0.40V], Ion: 75 us, RIC: 3.586e+6, BC
34
Figure 5. AMD result for 50 µg/L trans,trans-2,4-heptadienal at a resonant excitation voltage of 0.60 volts. The quantitation (product) ion m/z (m/z = 92.8) dominates at this voltage.
10 20 30 40 50
minutes 0.0
0.5 1.0 1.5 2.0
MCounts 6-13-2009 t,t,2,4,hepta-1 t&o-ci-amd17.SMS 111.0>80:150 [0.60V]
111.0>80:150 [0.60V]1A
80 90 100 110 120 130 140 150
m/z 0%
25% 50% 75% 100%
82.7 86246
90.9 300131
92.8 956967
110.8 384696
111.8 111461 Spectrum 1A
35
Figure 6. Duplicate first-stage AMD results for trans,trans-2,4-heptadienal by varying the resonant excitation voltage from 0 to 2 volts.
Figure 7. Duplicate second-stage AMD results for trans,trans-2,4-heptadienal by varying resonant excitation voltage from 0.2 to 1.4 volts.
0.0E+00 2.0E+05 4.0E+05 6.0E+05 8.0E+05 1.0E+06 1.2E+06
0 0.5 1 1.5 2
Ion
c
o
u
n
ts
(m
/z)
Excitation Voltage (volts)
0.0E+00 1.0E+05 2.0E+05 3.0E+05 4.0E+05 5.0E+05 6.0E+05 7.0E+05 8.0E+05 9.0E+05
0 0.2 0.4 0.6 0.8 1 1.2 1.4
Ion
c
o
u
n
ts
(m
/z)
36
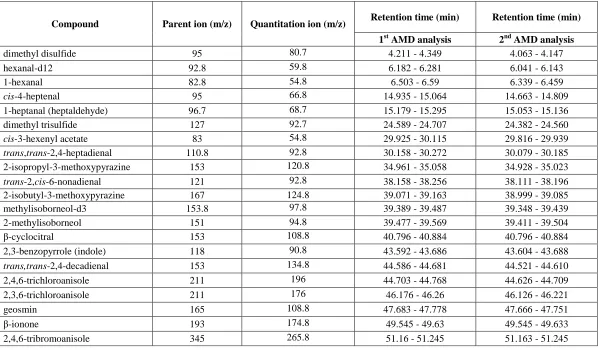
Table 12. Parent and quantitation ions as well as retention time range of peak base for each target analyte.
Compound Parent ion (m/z) Quantitation ion (m/z) Retention time (min) Retention time (min)
1st AMD analysis 2nd AMD analysis
dimethyl disulfide 95 80.7 4.211 - 4.349 4.063 - 4.147
hexanal-d12 92.8 59.8 6.182 - 6.281 6.041 - 6.143
1-hexanal 82.8 54.8 6.503 - 6.59 6.339 - 6.459
cis-4-heptenal 95 66.8 14.935 - 15.064 14.663 - 14.809
1-heptanal (heptaldehyde) 96.7 68.7 15.179 - 15.295 15.053 - 15.136
dimethyl trisulfide 127 92.7 24.589 - 24.707 24.382 - 24.560
cis-3-hexenyl acetate 83 54.8 29.925 - 30.115 29.816 - 29.939
trans,trans-2,4-heptadienal 110.8 92.8 30.158 - 30.272 30.079 - 30.185
2-isopropyl-3-methoxypyrazine 153 120.8 34.961 - 35.058 34.928 - 35.023
trans-2,cis-6-nonadienal 121 92.8 38.158 - 38.256 38.111 - 38.196
2-isobutyl-3-methoxypyrazine 167 124.8 39.071 - 39.163 38.999 - 39.085 methylisoborneol-d3 153.8 97.8 39.389 - 39.487 39.348 - 39.439
2-methylisoborneol 151 94.8 39.477 - 39.569 39.411 - 39.504
β-cyclocitral 153 108.8 40.796 - 40.884 40.796 - 40.884
2,3-benzopyrrole (indole) 118 90.8 43.592 - 43.686 43.604 - 43.688
trans,trans-2,4-decadienal 153 134.8 44.586 - 44.681 44.521 - 44.610
2,4,6-trichloroanisole 211 196 44.703 - 44.768 44.626 - 44.709
2,3,6-trichloroanisole 211 176 46.176 - 46.26 46.126 - 46.221
geosmin 165 108.8 47.683 - 47.778 47.666 - 47.751
β-ionone 193 174.8 49.545 - 49.63 49.545 - 49.633
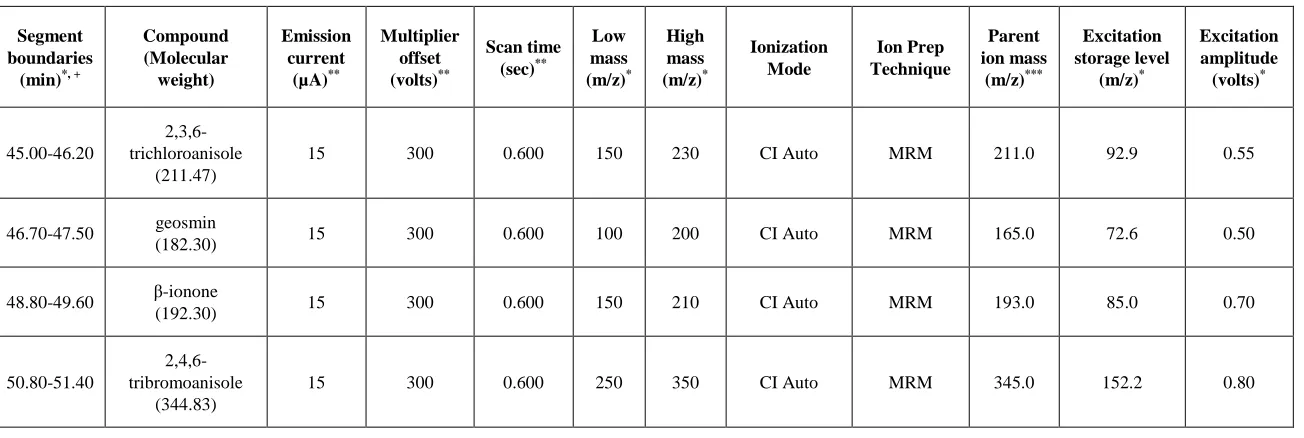
37 Table 13. MS/MS segment settings for each target analyte.
Segment boundaries
(min)* , +
Compound (Molecular
weight)
Emission current
(µA)**
Multiplier offset (volts)**
Scan time (sec)**
Low mass (m/z)*
High mass (m/z)*
Ionization Mode
Ion Prep Technique
Parent ion mass
(m/z)***
Excitation storage level
(m/z)*
Excitation amplitude
(volts)*
3.65-5.50 dimethyl disulfide
(94.20) 15 300 0.600 70 110 CI Auto MRM 95.0 41.6 1.70
5.50-7.50 hexanal-d12
(112.23) 15 300 0.600 40 110 CI Auto MRM 93.0 40.7 0.60
1-hexanal
(100.16) CI Auto MRM 83.0 36.3 0.50
13.25-16.25 cis-4-heptenal
(112.17) 15 300 0.600 50 110 CI Auto MRM 95.0 41.6 0.50
heptaldehyde
(114.19) CI Auto MRM 97.0 42.5 0.60
22.25-24.00 dimethyl trisulfide
(126.26) 15 300 0.600 80 150 CI Auto MRM 127.0 55.8 0.40
28.75-31.50 cis-3-hexenyl
acetate (142.20) 15 300 0.600 40 120 CI Auto MRM 83.0 36.3 0.50
t,t-2,4-heptadienal
38 Table 13. Continued
Segment boundaries
(min)* , +
Compound (Molecular weight) Emission current (µA)** Multiplier offset (volts)** Scan time (sec)** Low mass (m/z)* High mass (m/z)* Ionization Mode Ion Prep Technique Parent ion mass (m/z)*** Excitation storage level (m/z)* Excitation amplitude (volts)* 33.75-35.00 2-isopropyl-3-methoxypyrazine (152.19)
15 300 0.600 100 200 CI Auto MRM 153.0 67.3 0.60
37.30-38.40
trans-2,cis -6-nonadienal
(138.21)
15 300 0.600 80 150 CI Auto MRM 121.0 53.1 0.40
38.40-38.88
2-isobutyl-3-methoxypyrazine
(166.22)
15 300 0.600 100 200 CI Auto MRM 167.0 73.5 0.50
38.88-40.15 MIB-d3
(171.30) 15 300 0.600 80 200 CI Auto MRM 154.0 67.7 0.60
MIB
(168.28) CI Auto MRM 151.0 66.4 0.60
40.15-41.00 β-cyclocitral
(152.23) 15 300 0.600 90 200 CI Auto MRM 153.0 67.3 0.65
42.75-43.80 indole
(117.15) 15 300 0.600 80 150 CI Auto MRM 118.0 51.8 0.60
43.80-45.00 t,t-2,4-decadienal
(152.23) 15 300 0.600 120 230 CI Auto MRM 153.0 67.3 0.60
2,4,6- trichloroanisole
(211.47)
39 Table 13. Continued
Segment boundaries
(min)*, +
Compound (Molecular weight) Emission current (µA)** Multiplier offset (volts)** Scan time (sec)** Low mass (m/z)* High mass (m/z)* Ionization Mode Ion Prep Technique Parent ion mass (m/z)*** Excitation storage level (m/z)* Excitation amplitude (volts)* 45.00-46.20 2,3,6-trichloroanisole (211.47)
15 300 0.600 150 230 CI Auto MRM 211.0 92.9 0.55
46.70-47.50 geosmin
(182.30) 15 300 0.600 100 200 CI Auto MRM 165.0 72.6 0.50
48.80-49.60 β-ionone
(192.30) 15 300 0.600 150 210 CI Auto MRM 193.0 85.0 0.70
50.80-51.40
2,4,6-tribromoanisole
(344.83)
15 300 0.600 250 350 CI Auto MRM 345.0 152.2 0.80
*
Determined from AMD
+
Segment boundaries were adjusted throughout the course of the project because the GC column was cut periodically for maintenance purposes. As a result, segment boundaries in Table 13 do not align perfectly with the retention times shown in Table 12.
**
Indicates default setting
***
Determined from single-stage CI-MS analysis
40 4.2 Calibration curves
Calibration curves were prepared with seven calibration standards. Concentrations in the
calibration standards ranged from 0.1 - 50 ng/L for Group 1 compounds and from 10 - 4000 ng/L for Group 2 compounds (see also Table 10). The internal standards MIB-d3 (10 ng/L) and hexanal-d12 (500 ng/L) were spiked into each calibration standard to obtain the response factors (RF) for the Group 1 and Group 2 compounds, respectively. The response factor was obtained using the formula:
Response factor (RF) = Peak area of the compound / Peak area of the internal standard
A signal-to-noise (S/N) ratio of at least 10:1 was used as the criterion for quantifying compound concentrations. Peak areas of quantitation ions obtained for each target analyte and internal standard were determined using the MS workstation software (Varian, Inc.). The RF was plotted against the respective concentration of each compound to obtain a set of calibration curves for all 19 T&O compounds targeted in this study. Calibration curves were developed every time a new SPME fiber was used.
41
Table 14. Representative calibration curves, regression models, and compounds with calibration curves similar to the one shown.
Calibration curve Regression Model Compounds
Power Law
Group 1
Low concentration (0.1 - 50 ng/L):
IPMP, IBMP, MIB, β-cyclocitral,
2,4,6-TCA, 2,3,6-TCA, geosmin, β-ionone, 2,4,6-TBA
Power Law
Group 2 High concentration
(10 - 4000 ng/L):
dimethyl disulfide, hexanal,
cis-4-heptanal, heptaldehyde, dimethyl trisulfide, indole,
cis-3-hexenyl acetate,
trans,trans-2,4-heptadienal,
trans-2,cis-6-nonadienal,
trans,trans-2,4-decadienal
RF = 1.08*C1.11
R² = 0.992
0.01 0.10 1.00 10.00 100.00
0.1 1.0 10.0 100.0
RF
Concentration (ng/L) IPMP
RF = 0.000411*C1.32
R² = 0.991
0.01 0.10 1.00 10.00 100.00
10 100 1000 10000
RF
42
Table 15. Calibration curves for 19 T&O compounds: applicable concentration ranges,
regression equations, and r2 values. Obtained with SPME fiber used in the sampling campaign for Meredith College Pond (Raleigh, NC).
Compound Concentration range (ng/L) Regression equation r2
dimethyl disulfide 50-4000 y = 1.56E-05x1.77 0.977
hexanal 50-4000 y = 4.54E-03x0.883 0.9704
cis-4-heptenal 50-4000 y = 0.485E-03x1.27 0.991
heptaldehyde 100-4000 y = 2.53E-03x1.05 0.987
dimethyl trisulfide 100-4000 y = 2.86E-07x2.33 0.976
cis-3-hexenyl cetate 100-4000 y = 1.51E-03x1.15 0.963
trans,trans-2,4-heptadienal 100-4000 y = 0.265E-03x1.509 0.992
2-isopropyl-3-methoxypyrazine 0.5-50 y = 1.08x1.11 0.992
trans-2,cis-6-nonadienal 100-4000 y = 0.411E-03x1.32 0.991
2-isobutyl-3-methoxypyrazine 0.1-50 y = 0.704x1.03 0.995
2-methylisoborneol 1-50 y = 0.207x1.07 0.992
β-cyclocitral 0.1-50 y = 2.11x0.891 0.979
indole 100-4000 y = 0.105E-03x1.42 0.996
trans,trans-2,4-decadienal 100-4000 y = 0.382E-03x1.408 0.992
2,4,6-trichloroanisole 0.5-50 y = 0.159x1.12 0.987 2,3,6-trichloroanisole 0.5-50 y = 0.366x1.09 0.994
geosmin 1-50 y = 0.259x1.04 0.988
β-ionone 0.1-50 y = 1.05x0.802 0.962