ABSTRACT
GORAN, BOZINOVIC. Development and Population Divergence. (Under the Direction of Damian Shea and Marjorie F. Oleksiak.)
Changes in gene expression, coupled by biochemical, physiological, and behavioral alterations play a critical role in adaptation to environmental stress. To explore the ways natural populations may have adapted to local polluted environments, we took advantage of natural populations of the teleost fish Fundulus heteroclitus, one of the few studied fish species in North America that has established resistant populations in highly contaminated urban estuaries. We quantified expression of about one-fourth of Fundulus genes in all 40 stages of Fundulus embryogenesis. Waves of differential gene expression are associated with the different hallmarks of development (e.g., gastrula, vascular and organ development). Contrasting developmental patterns of gene
expression and phenotypic variation among populations indicate that individuals from heavily polluted sites have an altered developmental program during critical
Development and Population Divergence
by
Goran Bozinovic
A dissertation submitted to the Graduate Faculty of North Carolina State University
in partial fulfillment of the requirements for the degree of
Doctor of Philosophy
Toxicology
Raleigh, North Carolina 2009
APPROVED BY:
_________________________ ___________________________
Damian Shea Margie Oleksiak
Chair of Advisory Committee Co-chair of Advisory Committee
_________________________ ___________________________
Trudy Mackay David Hinton
BIOGRAPHY
Goran Bozinovic was born in Belgrade, Yugoslavia in 1969. After graduating from High School, he moved to the USA. He earned a B.S. degree in Biology from California State University Dominguez Hills in 1997, and M.S. degree in Environmental Health Sciences from San Diego State University in 2002.
TABLE OF CONTENTS
LIST OF TABLES...v
LIST OF FIGURES ...vi
DEVELOPMENT AND POPULAION DIVERGENCE INTRODUCTION ...1
Reference Cited ...17
STAGES OF NORMAL DEVELOPMENT, HISTOLOGY, AND EMBRYONIC GENE EXPESSION OF TELEOST FUNDULUS HETEROCLITUS...28
Abstract...29
Introduction...30
Materials and Methods ...33
Results ...42
Discussion...66
Conclusion ...74
References Cited...75
EFFECTS OF POLLUTANT EXPSURES ON CHEMISTRY, PHYSIOLOGY, MORPHOLOGY, HISTOLOGY, AND GENE EXPRESSION IN SENSITIVE AND RESISTANT EMBRYOS ...94
Abstract...95
Introduction...96
Materials and Methods ...98
Results...111
Discussion...121
Conclusion ...131
References Cited...132
SYNERGISTIC EFFECTS AND UNDERLYING MECHANISMS OF REPRESENTATIVE PAH-TYPE CYP1A INDUCERS AND INHIBITORS DURING FUNDULUS EMRBYO DEVELOPMENT...156
Abstract...157
Introduction...159
Materials and Methods ...161
Results...169
Discussion...174
Conclusion ...186
References Cited...188
EMRBYONIC GENE EXPRESSION AMONG AND WITHIN NATURAL FUNDULUS POPULATIONS: SENSITIVITY AND RESISTANCE TO POLLUTION...203
Introduction...205
Materials and Methods ...207
Results...215
Discussion...219
Conclusion ...223
References Cited...224
LIST OF TABLES
Table 1.1 Chemical data of clean and polluted sites populated
by Fundulus hetericlitus ...25
Table 2.1 Stages, main developmental events, and average time of onset for each stage during Fundulus heteroclitus
normal development ...81 Table 3.1 Symbols used in reporting results among 2 embryo
populations exposed to clean and polluted
sediment extracts ...139 Table 3.2 Number and percent of significant genes (Mixed model
ANOVA, p < 0.01 and pFDR < 0.05) of 6,789 analyzed due to Population, Stage, and Treatment alone,
and Pop x Treat, Pop x Stage, Treat x Stage,
and Pop x Treat x Stage interactions ...139 Table 3.3 Number of significant genes due to stage, treatment,
and treatment-by-stage interactions stages 21, 25, 31,
and 35 of Fundulus embryo development ...139 Table 3.4 Selected Differentially expressed genes during late
organogenesis (stage 35) among sensitive and resistant
embryos exposed to clean and polluted sediment extracts ...140 Table 4.1 Number of significant genes (pairwise comparisons,
Student t-test, p < 0.01) based on comparing treatments between embryo populations, and comparing controls
with each treatment within embryo populations...193 Table 5.1 Number and percentage of significant genes of
6,659 analyzed using pairwise comparisons between
embryo populations at p < 0.01 ...227 Table 5.2 Significant Differences in Gene Expression among
LIST OF FIGURES
Figure 1.1 Relative locations of Fundulus populations used in this study...26 Figure 1.2 Chemical structures of representative PAHs found at the
Elizabeth River, VA site populated by Fundulus heteroclitus...27 Figure 2.1 Stages (1-40) of normal development of
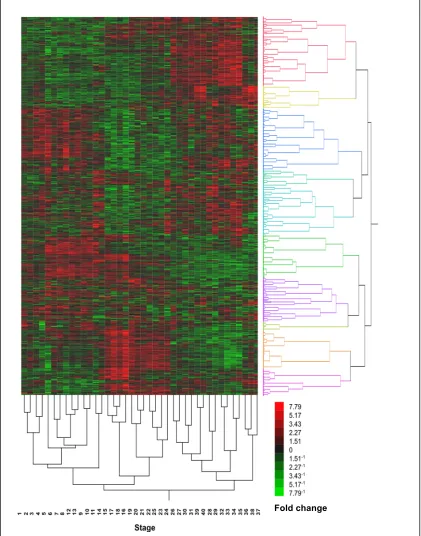
Fundulus heteroclitus...82 Figure 2.2 Fundulus heteroclitus embryo histology at stage 31 ...85 Figure 2.3 Heat map and hierarchical clustering of Fundulus genes
with pairwise differences (t-test, p<0.01)
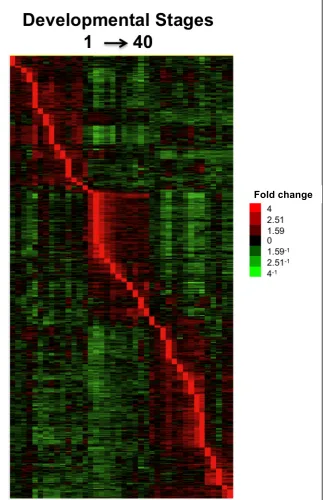
for all 40 developmental stages ...87 Figure 2.4 Pairwise comparisons between adjacent developmental stages ...88 Figure 2.5 Timing of peak expression levels of significant genes (p < 0.01)
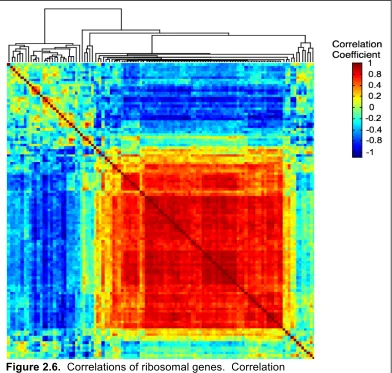
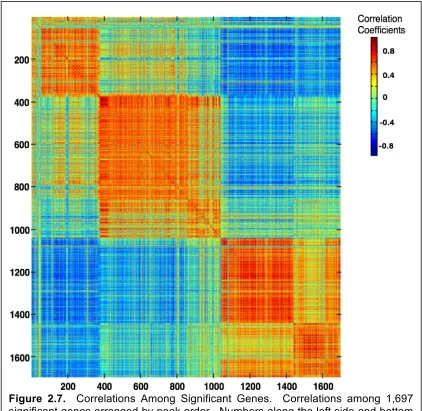
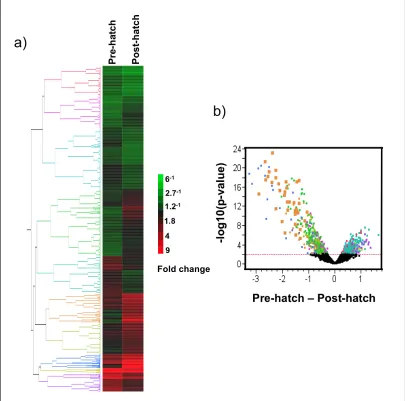
during each stage of Fundulus heterclitus development ...90 Figure 2.6 Correlations of ribosomal genes ...91 Figure 2.7 Correlations Among Significant Genes ...92 Figure 2.8 Gene Expression pre and post-hatch analysis
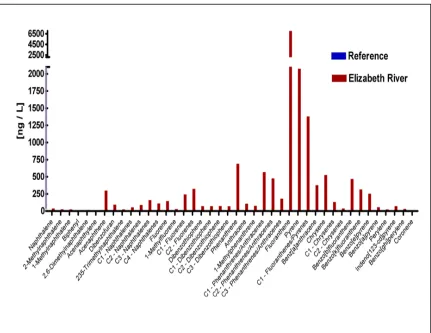
of Fundulus heteroclitus embryo development ...93 Figure 3.1 Chemical Analyses of PAH concentrations present
in Elizabeth River, VA, and Magotha Bay, VA
sediment extracts ...143 Figure 3.2 PAH-exposure analysis using SPDMs at Elizabeth River, VA,
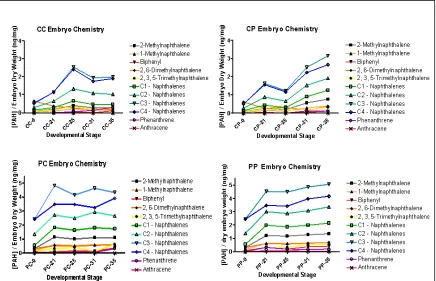
and Magotha Bay, VA sites ...144 Figure 3.3 Chemical Analysis of reference and resistant embryos
exposed to clean and polluted sediments extracts during
Figure 3.4 Survival rates for embryos from two populations exposed
to clean and polluted sediment extracts ...146 Figure 3.5 Time-to-stage for embryos from two populations
developing in clean and polluted sediment extracts ...147 Figure 3.6 Developmental delays of sensitive embryos exposed to
polluted sediment extracts ...148 Figure 3.7 Embryo heart rates (bpm) measured in reference
and resistant embryo populations ...149 Figure 3.8 Embryo Morphology at stage 31 ...150 Figure 3.9 Embryo deformity assessment among sensitive and resistant
embryos exposed to clean and polluted sediment extracts ...151 Figure 3.10 Correlation among developmental delays, heart rate,
and morphology of Fundulus embryos...152 Figure 3.11 Embryo histopathology of stage 31 ...153 Figure 3.12 Heat map and hierarchical clustering of significant genes
(Mixed model ANOVA, p < 0.01) in
treatment-by-population-by-stage analysis of sensitive and resistant embryos exposed to clean
and polluted sediment extracts...154 Figure 3.13 Heat maps and hierarchical clustering of genes whose
expression significantly differs (pairwise comparisons, p < 0.01) within each developmental stage, among sensitive and resistant embryos exposed to clean and
polluted sediment extracts ...155 Figure 4.1 Gene expression experiment and microarray loop design...193 Figure 4.2 Embryo survival (2-way ANOVA, p = 0.97) among
5 treatment groups within sensitive and resistant embryo
Figure 4.3 Development among control and 5 treatment groups of sensitive (King’s Creek) and resistant (Elizabeth River)
embryos at 144-150 hours post-fertilization...194 Figure 4.4 Embryo heart rates: King’s Creek (sensitive, red) and
Elizabeth River (resistant, blue) embryo hear rates during
late organogenesis...195 Figure 4.5 Embryo deformity assessment among sensitive and
resistant embryos under 6 treatments ...196 Figure 4.6 Embryo Morphology: progression of deformities among
exposed sensitive embryos ...197 Figure 4.7 Correlation between Embryo Morphology and Heart Rate...198 Figure 4.8 CYP1 enzymatic activity as measured by
in ovo EROD assay (120 hpf)...199 Figure 4.9 Heat map of significant genes reflecting all pairwise
comparisons (p<0.01) between sensitive and
resistant embryos ...200 Figure 4.10 Heat maps of differentially expressed genes
(Mixed model analysis ANOVA, p < 0.01)...201 Figure 4.11 Expression 105 genes significantly differs
(Mixed model ANOVA, p < 0.01) due to the effect of
embryo morphology among sensitive and resistant embryos...202 Figure 5.1 Loop Design for Embryo gene expression analysis ...231 Figure 5.2 Embryo survival (1-way ANOVA, P<0.05) among
five populations at stage 31 ...232 Figure 5.3 Developmental delays among embryos from five populations ...232 Figure 5.4 Heart rate (beats/min) differences during late organogenesis
Figure 5.5 Embryo morphology among 5 populations during
the late organogenesis stage...233 Figure 5.6 Heat map shows 380 of 6,659 genes tested (5.7%)
whose expression was significantly different (p<0.01) ...234 Figure 5.7 Heat map shows 32 genes whose expression was
significantly different (p<0.01) between polluted and
Chapter I
INTRODUCTION
The goal of my research was to determine the effects of chronic pollution on morphology, histology, physiology and gene expression during sensitive developmental stages in natural populations of Fundulus heteroclitus. This research takes advantage of populations of F. heteroclitus that inhabit heavily contaminated urban estuaries polluted with persistent and bioaccumulative chemicals. Fundulus is one of the few studied species in North America that has shown resistance to pollutants among both adults and embryos. While sediment extracts from polluted environments can be lethal to Fundulus embryos from reference sites, embryos of parents from polluted sites are remarkably resistant.
Using annotated F. heteroclitus microarrays, observed changes in mRNA expression in F1 Fundulus embryos of parents from clean and polluted sites were
analyzed during sensitive developmental stages and correlated to resistance phenotypes. The integration of phenotypic changes with genome-wide measures of gene expression provides evidence for functionally important changes in gene expression affected by pollution.
Background and Significance
size and genetic variability (Wirgin and Waldman, 2004). However, individual responses vary, and while some individuals are sensitive, others survive and reproduce, therefore establishing resistant populations. This acquired resistance is associated with fitness costs so that resistance genes are rarely fixed in natural populations (Coustau et al., 2000); counterbalancing selection pressure decreases the frequency of resistance genes in the absence of inducer, such as a chemical pollutant.
Natural Fundulus Populations
vertebrate species (Table 1.1; Wirgin and Waldman, 2004).
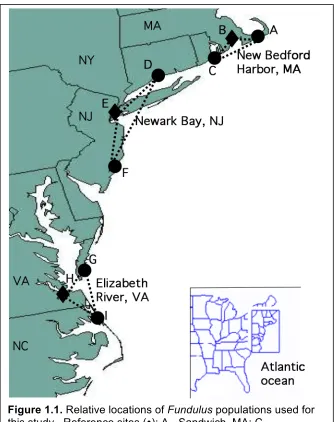
Multiple Fundulus populations live in highly contaminated, geographically unrelated urban estuaries, and comparing gene expression profiles of many individuals can reveal conserved patterns of gene expression among these populations (Figure 1.1). In addition, each population can be associated with the primary pollutants that are specific for that location. For example, one population of Fundulus from the Elizabeth River, VA is predominantly exposed to polycyclic aromatic hydrocarbons (PAHs), while populations living in New Bedford Harbor, MA are mostly associated with
polychlorinated biphenyl (PCBs) exposure. Site-specific exposures might point out differences in response not only based on the individual variation, but also on exposure differences.
Fundulus Development
Many aspects of vertebrate development, including those in humans, are mirrored in the fish embryo. Thus, transcript profiling of early fish development and how it is
sensitive target for stressors, such as chemical pollutants. Further, the effects of a developmental abnormality can cascade throughout the different developmental stages. Changes in size, biochemistry, physiology, form and functionality are regulated by gene transcription of regulatory genes, first via maternally inherited genes present in the egg before fertilization, and subsequently by genes expressed during embryogenesis. Although pollution exposure is not unique to developing embryos, it may quickly cause pathogenetic response in the embryo, resulting in reduced cell proliferation, cell death, altered cell-cell interactions, reduced biosynthesis, inhibition of morphogenic
movements, and/or disruption of developing structures (Wilson, 1977).
Multiple Fundulus populations inhabit and have adapted to heavily contaminated urban estuaries (Nacci et al., 1999; Meyer et al., 2002; Ownby et al., 2002) which
contain persistent and bioaccumulative chemicals that are toxic to early fish development (Nacci et al., 1999; Elskus et al., 1999). Acute and chronic exposure of Fundulus
embryos to toxicants present in the polluted sites can lead to functional deficit, growth retardation, malformation, and even death (Nacci et al., 1999; Meyer et al., 2002; Meyer et al., 2003). The resultant morphological alterations and deformities caused by pollutant exposure can be observed, scored, and used as an indicator of adverse effects (Wilson, 1973; Meyer et al., 2003).
Fundulus is a favorable model for embryological research since field sampling, spawning, and egg culturing are relatively easy, and the embryo is large, hardy, and
transparent, which allows for non-invasive experimental approaches. Moreover, theembryo’s sensitivity to xenobiotics makes Fundulus an excellent indicator of
developmental toxicity based on exposures to a wide range of environmental pollutants (Prince and Cooper, 1995; McMillan et al., 2006; Nacci et al., 2005; Elskus et al., 1999; Meyer et al., 2002; Meyer et al., 2003;Meyer and Di Giulio, 2003).
Resistance has been observed in Fundulus embryo populations from three highly contaminated US Superfund sites: New Bedford Harbor, MA, Newark Bay, NJ, and Elizabeth River, VA. New Bedford Harbor is highly contaminated with polychlorinated biphenyls (PCBs) (Elskus and Stageman, 1989; Black et al., 1998; Gutjahr-Gobell et al., 1999), the lower Hudson River estuary in Newark Bay is predominantly contaminated with 2,3,7,8-tetrachloro-p-dioxin (TCDD) (Powell et al., 2000), and Elizabeth River, VA, is contaminated with creosote, mostly polycyclic aromatic hydrocarbons (PAHs) (Elskus and Stageman, 1989; Vogelbein et al., 1990). Chemical structures of common PAHs are shown in Figure 1.2.
Concentrations of contaminants similar to those measured in New Bedford, MA polluted site-collected eggs were lethal to reference embryos but not to embryos from the New Bedford Harbor population. This resistance in the New Bedford Harbor embryos appeared to be inherited and independent of maternal deposition (Nacci et al., 1999). Differences in CYP1A expression between clean and polluted sites among Fundulus larvae indicated that populations from polluted sites have altered response to CYP1A
inducers that is consistent and possibly an indicator of resistance to chemical stressors (Elskus et al., 1999).
Embryos from Newark Bay were less sensitive to TCDD-caused lethality and inductionof CYP1A compared to reference site embryos (Nacci et al., 1999; Prince and Cooper, 1995). Resulting mortality among the reference embryos was associated with pericardial edema and hemorrhaging, hallmark pathologies of TCDD-induced toxicity in fish (Prince and Cooper, 1995). No differences were observed in TCDD absorption between embryos from the polluted and clean environments, suggesting that mechanisms other than differential uptake or efflux were responsible for variable susceptibilities (Nacci et al., 1999).
Embryos from clean environments do not survive when grown on sediment from the Elizabeth River site (Meyer et al., 2003) and develop significantly higher numbers of cardiac abnormalities due to exposure to contaminated sediments compared to embryos from the Elizabeth River (Ownby et al., 2002). Offspring of Elizabeth River Fundulus were significantly more resistant to oxidative stress than the reference site Fundulus offspring and showed upregulated antioxidant defenses which suggests that such upregulated antioxidant defense plays a role in both short term/physiological and heritable resistance mechanisms to environmental pollutants (Meyer et al., 2003). Similar patterns were observed upon embryo exposure to both sediments from the
was apparent in first generation larvae, less apparent in second generation ones (Meyer and Di Giulio, 2003), and much closer to the reference larvae response in third generation larvae (Meyer et al., 2002).
Developmental Effects of Persistent Organic Pollutants
Various developmental abnormalities caused by persistent organic pollutants (POPs) in humans and other species have been described. For example, POPs are resistant to environmental degradation and metabolism and tend to accumulate in food chains due to their lipophilic nature (Miettinen et al., 2006). Fetuses and children are more sensitive than adults to toxicity of such pollutants partially because of their higher cell proliferation rates, lower immunological competence, and decreased ability to detoxify carcinogens and to repair DNA damage (Anderson et al., 2000; Perera et al., 2004). Epidemiological studies have shown a relationship between perinatal exposure to POPs and neurological and behavioral disturbances in infants and children (Jacobson and Jacobson, 1997; Koopman-Esseboom et al., 1996; Patandin et al., 1998). Infants of mothers consuming large amounts of contaminated Great Lakes fish show developmental effects, such as decreased intellectual capacity, altered attention and memory processes, reduced birth size, decreased growth rate, altered psychomotor activity and delayed sexual development (Jacobson et al., 1990). Exposure to ambient POPs has been
associated with altered physical growth, immune function, and thyroid hormone function
in infants (Koopman-Esseboom et al., 1994).
Although sensitivity to POPs varies greatly among adult individuals, developing animals are generally affected at lower doses, and resultant developmental effects may be irreversible (Miettinen et al., 2006). For example, gestational exposure to dioxins is minor compared to lactational exposure, but is sufficient to induce at least the most sensitive developmental effects (Miettinen et al., 2002). Breast-fed human infants are exposed far more than adults because chemicals such as TCDD are mobilized from mother’s fat tissue during lactation, and an infant’s daily intake on a body weight basis may be up to two orders of magnitude higher than an adult’s. TCDD-induced
developmental effects include hydronephrosis and cleft palate in rodents (Abbott et al., 1987), and low doses of TCDD alter the development of reproductive organs (Gray et al., 1997; Hamm et al., 2000), bone (Miettinen et al., 2005), and teeth (Kattainen et al., 2001; Miettinen et al., 2002). In-vitro experiments examining the species and organ
sensitivities to TCDD suggest that altered regulation of growth factors and their receptors may involve inappropriate proliferation and differentiation of target cells, ultimately causing TCDD-induced teratogenic effects (Couture et al., 1990).
Epidemiological studies with infants and children reported a possible association between poorer cognitive and psychomotor development and perinatal exposure to PCB mixtures at contemporary background levels (Huisman et al., 1995a; Huisman et al., 1995b; Jacobson and Jacobson, 1997). In primates, perinatal PCB exposure resulted in
neurobehavioral effects, such as impairment of cognitive tasks, which are indicative of effects on learning and memory (Levin et al., 1988). Animal studies have confirmed that PCBs produce deficits in motor activity (Hany et al., 1999), learning (Lilienthal and Winneke, 1991), memory, attention, andresponsiveness to aversive stimuli (Daily et al., 1989), neuromuscular development (Bernhofelt et al., 1994), and sensory function (Crofton and Rice, 1999). PCB exposure during development also affects mortality, growth, thyroid function, and neurobehavior in rodents (Bowers et al., 2004).
PAHs are generated by the incomplete combustion of fossil fuels and are among the most harmful pollutants: a number of PAHs, such as benzo(a) pyrene (BaP) are known human mutagens and carcinogens. Some are transplacental carcinogens in experiment bioassays, causing tumor formation in liver, lung, lymphatic tissues and nervous system of the offspring (Rice and Ward, 1982; Veselinovich et al., 1975). PAHs are
absorption, metabolic activation, and DNA repair, they provide measurable endpoints and valuable risk markers.
Parallel effects in Fundulus embryos from polluted environments are likely. Conserved differences among independent populations of Fundulus from polluted sites will indicate common responses to stress. Differences in developmental gene expression also will be used to target genes and explore mechanisms that underlie biological
responses caused by chronic exposure to site-specific pollutants, such as differences in gene expression among individual mostly exposed to PCBs (New Bedford Harbor) and PAHs (Elizabeth River).
Why gene expression during Fundulus development?
Susceptibility to toxic substances released into the environment depends on the embryo genotype and the manner in which it interacts with the polluted environment (Jelinek, 2005). Rapid and diverse processes occur during critical developmental stages when organisms are vulnerable to environmental influences. Gene expression is
ubiquitous throughout development and strongly modulates responses to environmental stimulus (Linney et al., 2004).
The goal of this study was to identify genes that respond to chemical contamination exposures, to potentially discover new gene interactions, and to better understand
pathways and mechanisms involved in sensitivity and development of resistance to
into the extent of expression differences underlying diseases and malignancies and reveal genes that may prove useful as diagnostic and prognostic markers (Golub et al., 1999; Jernas et al., 2006)). Furthermore, gene expression changes during fish embryo development may reveal common or novel mechanisms in sensitivity and resistance shared among species, including human populations. Natural populations exposed to complex mixtures of pollutants likely will show polygenic responses, and the genes that respond will identify pathways and point to mechanisms associated with stress.
Genetically variable, independent Fundulus populations exposed to pollution are under natural selection and could evolve different solutions forresistance to pollution.
However, one reason a similar solution among these populations is likely results from the fact that natural selection acts on standing genetic variation and only genes and inducible pathways that are variable can respond. These inducible pathways have few rate limiting steps and altering activities of such genes by changing their expression levels could be the most effective way to alter toxicity of a pollutant. Moreover, natural selection should favor genes that minimize toxicant effect, but that should also have the least overall negative effect on other traits and the fewest negative epistatic effects (Wolf et al., 2000). This limits the number of genes and could result in similar responses in independent natural populations.
global gene expression during development has not been investigated. Changes in gene regulation during development may play an important role in adaptive evolution, especially during adaptation to heavily polluted environments.
Why Genomics and Microarrays
Microarrays are thousands of 150 to 250 micron spots of DNA bound to microscope slides in a precise and known pattern (Ramsay, 1998, Schena et al., 1998). Each DNA spot quantitatively hybridizes to a specific mRNA so that expression of thousands of individual genes can be measured simultaneously. This technology enables genome-wide gene expression analysis and is a powerful means to better understand physiological responses that involve complex regulatory networks affecting gene expression. Microarrays can be used to clarify the mechanisms of actions of compounds, provide insight into functions of genes with no known function, and advance many areas of biologic and biomedical research (Lobenhofer et al., 2001) .
identify changes in gene expression that are important in dealing with environmental pollution. This research provides insights into how organisms are affected and respond to chronic pollutant exposure and addresses the question of why some individuals develop resistance to a chemical exposure while other individuals are sensitive.
Research Goals
The goals of my dissertation research were to characterize embryonic gene expression in F. heteroclitus, quantify effects of chemical exposures on developing F. heteroclitus embryos from both sensitive and resistant populations, and explore evolved changes in gene expression among embryos from different F. heteroclitus populations. Chapter 2 defines the quantitative patterns of gene expression for all 40 F. heteroclitus developmental stages. Gene expression profiles are accompanied by an in vivo
developmental atlas with detailed descriptions of each developmental stage. The atlas is used to correlate significant changes in gene expression with specific morphological changes during development. These data provide standards of normal development against which to contrast patterns of gene expression in embryos adapted to polluted Superfund sites.
In chapter 3, embryos from both sensitive and resistant populations are exposed to sediment extract from the polluted site to determine how pollutant exposure alters
quantify chemical exposures. In chapter 4, a similar experiment compares embryos from both sensitive and resistant populations to a defined mixture of pollutants found in the sediment extract.
Finally, chapter 5 compares and contrasts development among populations during late organogenesis to identify evolved differences in gene expression. Gene expression, time to stage, heart rates, and morphology are compared and contrasted among
References
Abbott, B. D., L. S. Birnbaum, and R. M. Pratt. 1987. TCDD-induced hyperplasia of the ureteral epithelium produces hydronephrosis in murine fetuses. Teratology 35:329-334.
Anderson, L. M., B. A. Diwan, N. T. Fear, and E. Roman. 2000. Critical windows of exposure for children's health: cancer in human epidemiological studies and neoplasms in experimental animal models. Environ Health Perspect 108 Suppl 3:573-594.
Armstrong, P. B., and J. S. Child. 1965. Stages of normal development of Fundulus heteroclitus. Biological Bulletin 128:143-168.
Bernhofelt, A., I. Nafstad, P. Engen, and J. U. Skaare. 1994. Effects of pre and post-natal exposure to 3,3,4,4,5-pentachlorobiphenyl on physical development, neurobehavior, and xenobiotic metabolizing enzymes in rats. Environmental Toxicology and Chemistry 13:1589-1597.
Bickham, J. W., S. Sandhu, P. D. Hebert, L. Chikhi, and R. Athwal. 2000. Effects of chemical contaminants on genetic diversity in natural populations: implications for biomonitoring and ecotoxicology. Mutat Res 463:33-51.
Black, D. E., R. Gutjahr-Gobell, R. J. Pruell, B. Bergen, L. Mills, and A. E. McElroy. 1998. Reproduction and polychlorinated biphenyls in Fundulus heteroclitus (Linnaeus) from New Bedford Harbor, Massachussets, USA. Environmental Toxicology and Chemistry 17:1405-1414.
Bowers, W. J., J. S. Nakai, I. Chu, M. G. Wade, D. Moir, A. Yagminas, S. Gill, O. Pulido, and R. Meuller. 2004. Early developmental neurotoxicity of a
PCB/organochlorine mixture in rodents after gestational and lactational exposure. Toxicol Sci 77:51-62.
Brown, B. L., and R. W. Chapman. 1991. Gene Flow and Mitochondrial DNA Variation in the Killifish Fundulus heteroclitus. Evolution 45:1147-1161. Coustau, C., C. Chevillon, and R. ffrench-Constant. 2000. Resistance to xenobiotics
Couture, L. A., B. D. Abbott, and L. S. Birnbaum. 1990. A critical review of the developmental toxicity and teratogenicity of 2,3,7,8-tetrachlorodibenzo-p-dioxin: recent advances toward understanding the mechanism. Teratology 42:619-627. Daily, H. B., D. R. Hertler, and D. M. Sargent. 1989. Ingestion of
environmentally-contaminated Lake Ontario salmon by laboratory rats increases avoidance of unpredictable aversive nonreward and mild electric shock. Behavioral Neuroscience 103:1356-1365.
Dejmek, J., I. Solansky, I. Benes, J. Lenicek, and R. J. Sram. 2000. The impact of polycyclic aromatic hydrocarbons and fine particles on pregnancy outcome. Environ Health Perspect 108:1159-1164.
Ehlinger, S. E., and A. T. Richard. 2004. Survival and Development of Horseshoe Crab (Limulus polyphemus) embryos is hypersaline conditions. The Biological Bulletin 206:87-94.
Elskus, A. A., E. Monosson, A. E. McElroy, J. J. Stageman, and D. S. Woltering. 1999. Altered CYP1A expression in Fundulus heteroclitus adults and larvae: a sign of pollutant resistance? Aquatic Toxicology 45:99-113.
Elskus, A. A., and J. J. Stageman. 1989. Induced cytochrome P450 in Fundulus heteroclitus associated with environmental contamination by polychlorinated biphenyls and polynuclear aromatic hydrocarbons. Marine Environmental Research 27:31-50.
Golub, T. R., D. K. Slonim, P. Tamayo, C. Huard, M. Gaasenbeek, J. P. Mesirov, H. Coller, M. L. Loh, J. R. Downing, M. A. Caligiuri, C. D. Bloomfield, and E. S. Lander. 1999. Molecular classification of cancer: class discovery and class prediction by gene expression monitoring. Science 286:531-537.
Gray, L. E., C. Wolf, P. Mann, and J. S. Ostby. 1997. In utero exposure to low doses of 2,3,7,8-tetrachlorodibenzo-p-dioxin alters reproductive development of female Long Evans hooded rat offspring. Toxicol Appl Pharmacol 146:237-244.
Gutjahr-Gobell, R. E., D. E. Black, L. J. Mills, R. J. Pruell, B. K. Taplin, and S. Jayaraman. 1999. Feeding the mummichog (Fundulus heteroclitus) a diet spiked with non-ortho- and mono-ortho-substituted polychlorinated biphenyls:
Hamm, J. T., B. R. Sparrow, D. Wolf, and L. S. Birnbaum. 2000. In utero and lactational exposure to 2,3,7,8-tetrachlorodibenzo-p-dioxin alters postnatal development of seminal vesicle epithelium. Toxicol Sci 54:424-430.
Hany, J., H. Lilienthal, A. Roth-Harer, G. Ostendorp, B. Heinzow, and G. Winneke. 1999. Behavioral effects following single and combined maternal exposure to PCB 77
(3,4,3',4'-tetrachlorobiphenyl) and PCB 47 (2,4,2',4'-tetrachlorobiphenyl) in rats. Neurotoxicol Teratol 21:147-156.
Hsiao, S. M., M. S. Greeley, and R. A. Wallace. 1994. Reprodictive cycling in female Fundulus heteroclitus. Biological Bulletin 186:271-284.
Huisman, M., C. Koopman-Esseboom, V. Fidler, M. Hadders-Algra, C. G. van der Paauw, L. G. Tuinstra, N. Weisglas-Kuperus, P. J. Sauer, B. C. Touwen, and E. R. Boersma. 1995a. Perinatal exposure to polychlorinated biphenyls and dioxins and its effect on neonatal neurological development. Early Hum Dev 41:111-127.
Huisman, M., C. Koopman-Esseboom, C. I. Lanting, C. G. van der Paauw, L. G. Tuinstra, V. Fidler, N. Weisglas-Kuperus, P. J. Sauer, E. R. Boersma, and B. C. Touwen. 1995b. Neurological condition in 18-month-old children perinatally exposed to polychlorinated biphenyls and dioxins. Early Hum Dev 43:165-176. Jacobson, J. L., and S. W. Jacobson. 1997. Evidence for PCBs as neurodevelopmental
toxicants in humans. Neurotoxicology 18:415-424.
Jacobson, J. L., S. W. Jacobson, and H. E. Humphrey. 1990. Effects of exposure to PCBs and related compounds on growth and activity in children. Neurotoxicol Teratol 12:319-326.
Jelinek, R. 2005. The contribution of new findings and Ideas to the old principles of teratology. Reprodictive Toxicology 20:295-300.
Kattainen, H., J. Tuukkanen, U. Simanainen, J. T. Tuomisto, O. Kovero, P. L. Lukinmaa, S. Alaluusua, J. Tuomisto, and M. Viluksela. 2001. In
utero/lactational 2,3,7,8-tetrachlorodibenzo-p-dioxin exposure impairs molar tooth development in rats. Toxicol Appl Pharmacol 174:216-224.
Koopman-Esseboom, C., D. C. Morse, N. Weisglas-Kuperus, I. J. Lutkeschipholt, C. G. Van der Paauw, L. G. Tuinstra, A. Brouwer, and P. J. Sauer. 1994. Effects of dioxins and polychlorinated biphenyls on thyroid hormone status of pregnant women and their infants. Pediatr Res 36:468-473.
Koopman-Esseboom, C., N. Weisglas-Kuperus, M. A. de Ridder, C. G. Van der Paauw, L. G. Tuinstra, and P. J. Sauer. 1996. Effects of polychlorinated biphenyl/dioxin exposure and feeding type on infants' mental and psychomotor development. Pediatrics 97:700-706.
Levin, E. D., S. L. Schantz, and R. E. Bowman. 1988. Delayed spatial alternation deficits resulting from perinatal PCB exposure in monkeys. Arch Toxicol 62:267-273.
Lilienthal, H., and G. Winneke. 1991. Sensitive periods for behavioral toxicity of polychlorinated biphenyls: determination by cross-fostering in rats. Fundam Appl Toxicol 17:368-375.
Linney, E., B. Dobbs-McAuliffe, H. Sajadi, and R. L. Malek. 2004. Microarray gene expression profiling during the segmentation phase of zebrafish development. Comp Biochem Physiol C Toxicol Pharmacol 138:351-362.
Lobenhofer, E. K., P. R. Bushel, C. A. Afshari, and H. K. Hamadeh. 2001. Progress in the application of DNA microarrays. Environ Health Perspect 109:881-891. McMillan, A. M., M. J. Bagley, S. A. Jackson, and D. E. Nacci. 2006. Genetic
diversity and structure of an estuarine fish (Fundulus heteroclitus) indigenous to sites associated with a highly contaminated urban harbor. Ecotoxicology 15:539-548.
Meyer, J. N., D. E. Nacci, and R. T. Di Giulio. 2002. Cytochrome P450A (CYP1A)in Killifish (Fundulus heteroclitus): Heritability of Altered Expression and
Relatioship to Survival in Contaminated Sediments. Toxicological Sciences 68:69-81.
Meyer, J. N., J. D. Smith, G. W. Winstin, and R. T. Di Giulio. 2003. Antioxidant defenses in killifish (Fundulus heteroclitus) exposed to contaminated sediments and model prooxidants: short-term and heritable responses. Aquatic Toxicology 65:377-395.
Miettinen, H. M., S. Alaluusua, J. Tuomisto, and M. Viluksela. 2002. Effect of in utero and lactational 2,3,7,8-tetrachlorodibenzo-p-dioxin exposure on rat molar development: the role of exposure time. Toxicol Appl Pharmacol 184:57-66. Miettinen, H. M., P. Pulkkinen, T. Jamsa, J. Koistinen, U. Simanainen, J. Tuomisto,
J. Tuukkanen, and M. Viluksela. 2005. Effects of in utero and lactational TCDD exposure on bone development in differentially sensitive rat lines. Toxicol Sci 85:1003-1012.
Miettinen, H. M., R. Sorvari, S. Alaluusua, M. Murtomaa, J. Tuukkanen, and M. Viluksela. 2006. The effect of perinatal TCDD exposure on caries susceptibility in rats. Toxicol Sci 91:568-575.
Nacci, D., M. Pelletier, J. Lake, R. Bennett, J. Nichols, R. Haebler, J. Grear, A. Kuhn, J. Copeland, M. Nicholson, S. Walters, and W. R. Munns, Jr. 2005. An approach to predict risks to wildlife populations from mercury and other stressors. Ecotoxicology 14:283-293.
Nacci, D. E., L. Coiro, D. Champlin, S. Jayaraman, R. Mckinney, T. R. Gleason, J. Munns, W.R., J. L. Specker, and K. R. Cooper. 1999. Adaptation of wild populations of the estuarine fish Fundulus heteroclitus to persistant environmental contaminants. Marine Biology 134:9-17.
Oleksiak, M. F., and D. L. Crawford. 2005. Functional genomics in Fishes: Insights into Physical Complexity. Physiology of Fishes, 3rd ed.:523-545.
Ownby, D. R., M. C. Newman, M. Mulvey, W. K. Vogelbein, M. A. Unger, and L. F. Arzayus. 2002. Fish (Fundulus heteroclitus) populations with different exposure histories differ in tollerance of creosote-contaminated sediments. Enironmental Toxicology and Chemistry 21:1897-1902.
Palmer, F. B., C. A. Butler, C. A. Timperly, and C. W. Evans. 1998. Toxicity to embryo and adult zebrafish of copper complexes with two malonic acids as models for dissolved organic matter. Environmental Toxicology and Chemistry 17:1538-1545.
Patandin, S., C. Koopman-Esseboom, M. A. de Ridder, N. Weisglas-Kuperus, and P. J. Sauer. 1998. Effects of environmental exposure to polychlorinated biphenyls and dioxins on birth size and growth in Dutch children. Pediatr Res 44:538-545. Perera, F. P., W. Jedrychowski, V. Rauh, and R. M. Whyatt. 1999. Molecular
epidemiologic research on the effects of environmental pollutants on the fetus. Environ Health Perspect 107 Suppl 3:451-460.
Perera, F. P., V. Rauh, W. Y. Tsai, P. Kinney, D. Camann, D. Barr, T. Bernert, R. Garfinkel, Y. H. Tu, D. Diaz, J. Dietrich, and R. M. Whyatt. 2003. Effects of transplacental exposure to environmental pollutants on birth outcomes in a multiethnic population. Environ Health Perspect 111:201-205.
Perera, F. P., D. Tang, Y. H. Tu, L. A. Cruz, M. Borjas, T. Bernert, and R. M. Whyatt. 2004. Biomarkers in maternal and newborn blood indicate heightened fetal susceptibility to procarcinogenic DNA damage. Environ Health Perspect 112:1133-1136.
Powell, W. H., R. Bright, S. M. Bello, and M. E. Hahn. 2000. Developmental and tissuespecific expression of AHR1, AHR2, and ARNT2 in dioxinsensitive and -resistant populations of the marine fish Fundulus heteroclitus. Toxicol Sci 57:229-239.
Prince, R., and K. R. Cooper. 1995. Comparison of the effect of 2,3,7,8-tetrachlorodibenzo-p-dioxin on chemically impacted and nonimpacted subpopulations of Fundulus heteroclitus: II Metabolic Considerations. Environmental Toxicology and Chemistry 14:589-595.
Rice, J. M., and J. M. Ward. 1982. Age dependance of susceptibility to carcinogenesis in nervous system. Annals of the New York Academy of Sciences 381:274-289. Rifkin, S. A., J. Kim, and K. P. White. 2003. Evolution of gene expression in the
Drosophila melanogaster subgroup. Nat Genet 33:138-144.
Ringwood, A. H. 2005. The relative sensitivities of different life stages of Isognomon californicum to cadmium toxicity. Environmental Contamination Toxicoogy 19:338-340.
Schena, M., R. A. Heller, T. P. Theriault, K. Konrad, E. Lachenmeier, and R. W. Davis. 1998. Microarrays: biotechnology's discovery platform for functional genomics. Trends In Biotechnology 16:301-306.
Selman, K., and R. A. Wallace. 1983. Oogenesis in Fundulus heteroclitus. III. Vitellogenesis. J Exp Zool 226:441-457.
Selman, K., and R. A. Wallace. 1986. Gametogenesis in Fundulus hetericlitus. American Zoologist 12:173-192.
Smith, G. M., and S. J. Weis. 1997. Predator-prey relationships in mumischogs (Fundulus heteroclitus): Effects of living in a polluted environment. Journal of Expreimental Marine Biology and Ecology 209:75-87.
Veselinovich, S. C., D. R. Kandala, and N. Mihailovich. 1975. Neoplastic response of mouse tissues during perinatal age periods and its significance in chemical carcinogenesis. National Cancer Institute Monographs 51:230-250.
Vogelbein, W. K., J. W. Fournie, P. A. Van Veld, and R. J. Huggett. 1990. Hepatic neoplasms in the mummichog Fundulus heteroclitus from a
creosote-contaminated site. Cancer Res 50:5978-5986.
Weis, J. S., G. M. Smith, and T. Zhou. 1999. Altered predator/pray behavior in polluted environments: Implications for conservation. Environmental Biology of Fishes 55:43-51.
Whyatt, R. M., R. M. Santella, W. Jedrychowski, S. J. Garte, D. A. Bell, R. Ottman, A. Gladek-Yarborough, G. Cosma, T. L. Young, T. B. Cooper, M. C.
Randall, D. K. Manchester, and F. P. Perera. 1998. Relationship between ambient air pollution and DNA damage in Polish mothers and newborns. Environ Health Perspect 106 Suppl 3:821-826.
Wilson, J. G. 1973. Environment and Birth Defects. Academic Press, New York. Wilson, J. G. 1977. Embryotoxicity of drugs in man.309-355.
Wirgin, I., and J. R. Waldman. 2004. Resistance to contaminants in North American fish populations. Mutat Res 552:73-100.
Max. Concentrations Measured in Water (ng/L) StudySites Total PAHs Total PCBs Mercury
27,400 18,000 47
New Bedford Harbor, MA
Sandwich, MA 1,100 0.3 1.7 46,000 128 140 Newark Bay, NJ
Barnegat Bay, NJ 3,100 1.9 4.5 109,100 13 22 Elizabeth River, VA
Knots Island, NC 360 0.085 3.3
Figure 1.1. Relative locations of Fundulus populations used for this study. Reference sites (): A - Sandwich, MA; C –
Succotosh, RI; D – Clinton, CT; F – Tuckerton, NJ; G – Magotha, VA; I – Manteo, NC. Polluted sites (♦): B – New Bedford Harbor, MA; E – Newark Bay, NJ; H – Elizabeth River, VA.
Chapter II
Stages of normal development,
histology, and embryonic gene
expression of teleost Fundulus
ABSTRACT
Although numerous aspects of development have been discovered through studies
of diverse species, a comprehensive analysis of gene expression at every stage of
vertebrate development is lacking. The teleost Fundulus heteroclitus is a valuable model
in vertebrate developmental and environmental biology. We quantified gene expression
patterns of about one-fourth of Fundulus genes for all 40 developmental stages using
microarray analysis. Our data illustrates temporal dynamics of gene activity during
embryogenesis highlighting waves of differential gene expression associated with the
different hallmarks of development. Analysis of stage-specific gene expression and onset
of peak gene activity provide insights about relationships between gene activity and
major physiological processes throughout development. We also provide a
comprehensive atlas and timeline of normal Fundulus development and present histology
INTRODUCTION
One of the main goals of developmental biology is to understand the relationship
between regulated changes in gene expression and progression of development on the
cellular, tissue, and organism level. Since the activity of regulatory genes drives embryo
development (Davidson et al., 2002), efforts are made to study developmental
mechanisms via differentially regulated gene expression. Analyzing expression of many
genes can point to sets of individual genes for further study, and genes expressed in
similar patterns often are associated with common signaling or metabolic pathways.
Microarray technology is a useful tool to study embryonic gene expression screens and
establish developmental profiles by monitoring activity of thousands of genes preferably
during all developmental stages, from unfertilized egg to hatching. This allows for
temporal and spatial analysis of gene expression patterns and for identifying novel genes
not previously associated with embryogenesis (Altmann et al., 2001; Ton et al., 2002;
Linney et al., 2004).
Fish, in particular zebrafish and medaka, are established vertebrate models in
developmental biology because they combine the best features of all the other models:
multiple embryos develop externally and can be viewed and manipulated at all stages;
development is rapid, the organization of the embryo is relatively simple and the embryo
is transparent. Like the mouse, the fish embryo is amenable to genetic analysis: it is easy
causing defects in some biological processes, such as the developing nervous system
(Powers, 1989; Cossins and Crawford, 2005). These advantages have resulted in dense
genetic maps in the zebrafish, which have been useful for the comparative mapping of
human genes (Postlethwait and Talbot, 1997). There is extensive similarity between the
fish and human genomes and many human developmental and disease genes have
counterparts in fish (Zon, 1999; Ton et al., 2000).
The teleostFundulus heteroclitus is arguably the most environmentally important
fish species on the east coast of the U.S. (Burnett et al., 2007) with populations widely
distributed in salt marshes from Florida to Maine (Lee et al., 1980, Scott and Crossman,
1998). Fundulus are small (6-12 cm), abundant, non-migratory, hardy fish (Skinner et
al., 2005). They can tolerate variable salinities (Griffith, 1974; Marshall and Grossel,
2005) and temperatures (Powers et al., 1993; Crawford et al., 1999) and can thrive in
heavily polluted environments (Wirgin and Waldman, 2004; Prince and Cooper, 1995;
Elskus et al., 1999; Nacci et al., 1999; Vogelbein et al., 1990; Ownby et al., 2002; Meyer
et al., 2003). Such characteristics make Fundulus an exceptional model for studying
population and individual response to changing environments, physiology, toxicology,
disease, and evolution. Similar to adults, Fundulus embryos are resilient and can develop
under different environmental conditions, which is important when assessing the effects
of many natural and anthropogenic factors on normal development (Oppenheimer, 1937;
Armstrong and Child, 1965; Preston et al., 2006). Moreover, Fundulus is an excellent
larger than zebrafish and medaka (about 2 mm); eggs are easily stripped from females on
a relatively regular bi-weekly schedule under controlled laboratory conditions (Hsiao et
al., 1996; Nacci et al., 1998; internal data) and can be fertilized in vitro, yielding large
numbers of viable eggs; the time to develop from unfertilized egg to free-swimming
larvae takes 10-14 days and can be manipulated (Armstrong and Child, 1965; Taylor,
1999; internal data). This developmental time period (longer than that of zebrafish and
medaka) allows for more accurate morphologic observations and measures of
stage-specific gene expression responses.
A standardized and systematic approach to embryo staging is a critical tool in
developmental biology, toxicology, and disease studies that involve experiments and
statistical analyses using numerous embryos during relatively short developmental
time-periods. To date, the most comprehensive Fundulus atlas was reported by Armstrong and
Childs (1965), with drawings and descriptions of 39 stages of normal development. We
complement this work with images using equipment common in today’s laboratories
(10-80x magnification dissecting microscope and digital camera) and provide additional
angles, details, depth, and focus of critical structures that define particular stages. In
contrast to Armstrong and Childs, we separated stage 35 into two distinct stages (pre- and
post-hatching) for the practicality of identifying changes in gene expression taking place
before and after embryos break through the chorion membrane and become
free-swimming. Thus, in total we characterize 40 distinct stages of F. heteroclitus
Our analysis of normal development in F. heteroclitus is three-fold. We provide a
detailed atlas identifying the 40 stages of development and average times embryos reach
a specific stage under controlled laboratory conditions. We augment this atlas with
histological sections identifying major structures of a late organogenesis stage. Finally,
using microarray analyses, we report a statistical analysis of gene expression patterns of
each developmental stage during Fundulus embryogenesis.
MATERIALS AND METHODS
Fish field collection and maintenance
Adult Fundulus heteroclitus were captured from King’s Creek, VA (37° 17’
54.04”N; 76° 25’ 32.06”W) using minnow traps and transported under controlled
temperature and aeration conditions to NCSU Aquatic Laboratory. Fish were maintained
at 20°C and 15 ppt salinity in 40 gallon flow-though re-circulating tanks under a
pseudo-summer light cycle (8 h dark / 16 h light) for 2 months prior to embryo culturing.
Effluent from the tanks was passed through an activated charcoal filter system, and 20%
of the water was changed weekly. Fish were fed (brine shrimp flake, blood meal flake,
Fish spawning, fertilization, development, and egg collection for Atlas, Histology and Gene Expression
To minimize variability, we used embryos from a single Fundulus population,
developing under controlled laboratory conditions. Mature females were stripped of their
eggs and sperm from mature males were collected in separate beakers. Eggs from
multiple females were fertilized by sperm of multiple males, and excess sperm were
removed. Fertilized embryos were maintained in Petri dishes half submerged in 15 ppt
filtered seawater in a 25°C environmental chamber under light during the first two stages
of development (2-cell stage). Embryos that successfully reached the 2-cell stage within
3 hours were incubated under a 16 hour light: 8 hour dark photoperiod at 25°C in the
environmental chamber (818 Low Temperature Illuminated Incubator, Precision
Scientific, USA). Fertilization success and embryo progress was monitored daily by
examining representative stages during pre-determined time periods (Armstrong and
Childs, 1965; internal data) using a dissecting stereo microscope (Nikon SME1500,
Japan). Time to stage, normal versus abnormal development, and mortality also were
recorded. Unfertilized eggs, malformed and/or dead embryos were removed from the
population, and times and stages of arrest and abnormal development were recorded
accordingly. Once the normally developing embryos reached pre-determined
developmental stages, embryos were photographed using a Micropublisher 5.0 RTV
1.5 ml eppendorf tubes and snap-frozen at -80°C for later RNA analyses.
Average time to stage and heart rate
To determine the average time to stage for all 40 stages, three embryos from 10
different families (each family consisted of offspring from a single female and male
cross) were monitored in individual 20-ml scintillation vials. Identification of each stage
was determined using a dissecting stereo microscope (Nikon SME1500, Japan) at 70-80X
magnification. Multiple images of developing embryos were taken at different phases of
each developmental stage. Images were captured with the Micropublisher 5.0 RTV
Camera (QImaging), and catalogued, stored, and analyzed using QCapture Pro imaging
software.
We calculated average times during which >50% of observed embryos showed
most of the morphological characteristics of a particular stage. The embryos were
observed during pre-determined time periods based on the reported Fundulus
developmental data (Armstrong and Child, 1965) and our preliminary results.
The same embryos used to determine average time to stage were used to
determine heart rate during early organogenesis (stage 31) and pre-hatching (stage 35). A
beating heart is formed, with both chambers completely differentiated and in full view by
stage 31, and the heart rate can be accurately determined from that stage on. Individual
minute prior to taking heart rate measurements so that the stressed embryo could
re-establish resting heart beat (most Fundulus embryos temporarily arrest their heart beat
due to a sudden change of environment, such as transfer from the petri dish to a well-lit
slide surface). The heart rate of each embryo was measured by counting the number of
heart beats for 30 seconds (preliminary results showed no change in the average heart
beat when counts were taken at either 30 second or 1 minute intervals).
Differences among embryos were analyzed with Prism Statistical Software using
one-way Analysis of Variance (1-way ANOVA, p < 0.05) for time-to-stage and heart rate
differences among embryo groups (families), respectively. A pairwise t-test (p < 0.05)
was used to test the differences of the means between families for both time-to-stage and
heart rate.
Histology
Recognition of specific organs/tissues
Decisions to refer to a structure as a specific organ or tissue were made using at least
three criteria:
1. Spatial - position, relationship to other structures;
2. Temporal- time at which the structure first appears;
3. Features of its tissue and cellular components.
All of these were made possible by the publications of earlier works, which have
and Child, 1965; Iwamatsu, 2004; Kimmel et al., 1995; Gonzales-Doncel et al., 2005).
Observations made with stereoscopic dissection microscopes at relatively low
magnification are sufficient to provide a list of structures for early cellular stages of
development. Similarly, as organ systems begin to appear, take on pigmentation and/or
move, their presence provides markers for consistent recognition of specific
developmental landmarks.
What has been less common is provision of detailed histological sections with
sufficient resolving power to recognize organs, tissues and their component cell types.
Despite the strengths of differentiating stains and greater magnification and resolution,
the ability to orient sections within the changing architectural plan of a developing
embryo is essential for accurate characterization to organ, tissue and cellular levels of
organization. In this work, we used horizontal-logitudinal sections, sagattal sections and
transverse sections. Horizontal-longitudinal sections cleave the embryo into dorsal and
ventral portions. This is analogous to the frontal sections of mammalian organisms.
However, since the embryo is curved over the yolk sac, a single plane of section is
unlikely to be maintained through the length of the embryo. Sagittal sections cleave the
embryo at the midline creating equal right and left halves of the organism. Sections to
the side of the sagittal section are referred to as parasagittal. Transverse sections separate
rostral from caudal portions of the embryo.
Due to the fact that the embryo and the outer surface of its associated yolk are
embryo being inside spherical membranes and positioned flat upon a spherical surface
subsequently maintained through processing by the cross-linking of proteins in the fixed
embryo. Given the above, histological sections yielding true planes completely defining
all of the above relationships are rare, is they exist at all. Thus, we often were faced with
sections skewed to some degree, along dorsal-ventral, lateral to contralateral, lateral to
medial, and/or horizontal to longitudinal orientations. For continuity and for overall
representation, we regard relationships seen nearly in their entirety at lower magnification
(10X objective) as valuable and these are followed by analysis of smaller areas using
higher magnification and for the most part, differentiating power (i.e., the ability to
distinguish one structure from its neighbors) giving us the potential to label organs,
tissues and cells.
Late organogenesis of Fundulus development was chosen as a representative
stage of major histological structures. During this stage, the heart chambers are fully
differentiated and all the major organ systems are developed and fully functional. Upon
confirming the stage and measuring the heart rate, the embryo pictures were taken and
catalogued, the embryos were fixed in 10% Neutral Buffer Formalin for 24-48 hours and
stored overnight in 30% sucrose. The embryos were punctured through the chorion once,
using the tip of a hypodermic needle, transferred to the mesh tissue cassettes, and allowed
to fix longer overnight due to the thickness of chorionic membrane.
Embryos were embedded in paraffin, trimmed into 100 micron blocks and
embedded for sectioning, which was done at 5 microns and placed on Silanized coated
slides. Embryos were stained with hemotoxylin and eosin. Histological sections were
viewed under a Nikon Eclipse E600 microscope, and the images were taken using
Lumenera Infinity 2 (model #2-2C) 2.0 megapixel, 12 fps, CCC color camera. Digital
images were analyzed using Eclipse Net Version 1.16.5 software.
Embryo RNA isolation, amplification, and labeling
Pools of frozen embryos collected at each developmental stage were used for
RNA isolation, labeling, and microarray hybridization. Four pools of 25 embryos were
used for stages 1-10, four pools of 15 embryos were used for stages 11-15, and 4 pools of
10 embryos were used for stages 16-40. Embryo RNA was extracted using a Trizol
buffer (Invitrogen, Carlsbad, CA, USA) followed by purification using the Qiagen
RNeasy Mini Kit (Qiagen Inc., Valencia, CA, USA). Purified RNA was quantified with
a spectrophotometer, and RNA quality was assessed by gel electrophoresis. RNA for
hybridization was prepared by one round of amplification (aRNA) using Ambion’s
Amino Allyl MessageAmp aRNA Kit to form copy template RNA by T7 amplification.
Amino-allyl UTP was incorporated into targets during T7 transcription, and resulting
amino-allyl aRNA was coupled to Cy3 and Cy5 dyes (GE Healthcare, Piscataway, NJ,
USA).
Labeled aRNA samples (2 pmol dye/ul) were hybridized to slides in 10 ul of
0.2 mg/ml bovine serum albumin, 1 mg/ml denatured salmon sperm DNA (Sigma), and 1
mg/ml RNAse free poly(A) RNA (Sigma)) for 44 hours at 42º C. Slides were prepared
for hybridization by blocking in 5% ethanoloamine, 100 mM Tris pH 7.8, and 0.1% SDS
added just before use for 30 minutes at room temperature, washed for one hour in 4x
SSC, 0.1% SDS at 50º C, and then boiled for 2 minutes in distilled water to denature the
cDNAs. Resulting 16 bit Tiff Images were quantified using ImaGene® (Biodiscovery,
Inc.) spotfinding software. Controls and any gene that did not have at least one
individual with a signal greater than the average signal from all herring sperm control
spots (non-specific hybridization signal) plus one standard deviation were removed prior
to statistical analyses. In total, 6,789 genes were analyzed.
Microarrays
Amplified cDNA sequences for 7,000 genes from F. heteroclitus cDNA libraries
were spotted onto epoxide slides (Corning) using an inkjet printer (Aj100, ArrayJet,
Scotland). Libraries were made from all 40 stages of Fundulus development,
immediately post-hatch whole larvae, and adult tissues. Each slide contained 5 spatially
separated arrays of ~7,000 spots (genes) including controls. Sequence information,
annotation and gene ontology are available for Fundulus on the FunnyBase website
Experimental Design for Microarrays
A double loop design was used for the microarray hybridizations where each
sample is hybridized to 2 arrays using both Cy3 and Cy5 labeled fluorophores (Kerr and
Churchill, 2001). The loop consisted of Cy3 and Cy5 labeled embryo aRNAs from 4
biological pools for each of 40 stages (S). In total, 160 biological pools were hybridized
to 80 microarrays. Each array had different combinations of biological pools (Altman
and Hua, 2006). The double loop formed was S1 S2 S3 … S40 S1 and S40
S39 S38 … S2 S1 S40 where each arrow represents a separate hybridization (array) with the biological pool at the base of the arrow labeled with Cy3 and the
biological pool at the head of the arrow labeled with Cy5.
Embryonic gene expression:
Log2 measures of gene expression were normalized using a linear mixed model in
SAS (JMP v3.2 with a microarray platform beta-version in SAS v9.1.3) to remove the
effects of dye (fixed effect) and array (random effect) following a joint regional and
spatial Lowess transformation in MAANOVA Version 0.98.8 for R to account for both
intensity and spatial bias (Wu et al., 2003).
The model was of the form yij = µ + Ai + Dj + (AxD)ij + εij where, yij is the signal
from the ith array with dye j, µ is the sample mean, Ai and Dj are the overall variation in
stochastic error (Jin et al., 2001; Wolfinger et al., 2001).
Residuals from the above model were used in a linear mixed model to test for
differences between stages on a gene-by-gene basis. The model was rijkm = µ + Ai + Dj +
Tk + εijkm where Tk is the kth treatment (stage 1-40). We used a similar analysis to test for
differences between pre and post-hatch embryos except the kth treatment represented
pre-hatch (stages 1-35) and post-pre-hatch (stages 36-40).
For all mixed model analyses, we used a nominal p-value cut-off for significant
genes of p < 0.01. Using this p-value reveals more genes that may be differentially
expressed but risks identifying genes that may be false positives.
Hierarchical clustering used JmpGenomics, Cluster 3.0 for Mac OS X, and Java
TreeView version 1.0.8 (de Hoon et al., 2004). Correlation analyses used Matlab version
7.2. For peak expression, genes were ordered by their time of peak expression. Separate
peaks were defined as within the 90% CI of the maximum transcript level measured and
at least 3 stages away from another peak.
These experiments were performed according to an approved Institutional Animal
Care and Use Committee at North Carolina State University.
RESULTS
Our goal was to provide detailed in vivo quality images and comprehensive stage
Armstrong and Child, 1965), which would be useful as a practical tool to clearly and
efficiently identify stages of normal Fundulus development. Atlas morphology and stage
descriptions are supplemented by time-to-stage and heart physiology data. We also
report a histological analysis of the stage 31, which is characterized by complete heart
differentiation and the formation of fully functional major organ systems (Armstrong and
Childs, 1965). Moreover, we present a statistical analysis of gene expression throughout
Fundulus development, profiling all 40 developmental stages of Fundulus development,
from an unfertilized ovum to post-hatching.
Figure 2.1 shows the 40 stages of normal embryo development in Fundulus.
Stage 1: Mature Unfertilized egg
The mature spherical ovum is on average 2 mm in diameter, although the size
varies and correlates to the size of the female, with larger females having larger but not
necessarily more eggs. The egg is enveloped by the chorion – a thick 2-layer membrane
consisting of inner protein fibrils and outer homogenous protein fibers. The micropyle
looks like a small funnel-shaped indentation on the outer layer of the chorion’s animal
(uppermost) pole. At the center of the egg is the homogenous and opaque yolk covered
with the small round cortical granules (yolk platelets) and oil droplets, which vary in size.
Stage 2: 1-cell stage
Upon fertilization, formation of pre-vitalline membrane causes the egg to shrink away
from the inner chorion membrane and the cortical granules disappear. The cytoplasm
migrates to the micopyle (animal) pole of the egg and eventually forms an elevated
blastodisc. Oil droplets migrate towards and eventually aggregate at the vegetal pole.
Stage 3: 2-cell stage
The blastodisc undergoes first cleavage resulting in two blastomeres (cells) equal in size.
Stage 4: 4-cell stage
The two blastomeres flatten and the second cleavage takes place, usually at the right
angle of the first cleavage plane, forming 4 blastomeres of equal size.
Stage 5: 8-cell stage
The third cleaveage, which is parallel to the first, divides the four blastomeres into 2
parallel rows of four, resulting in 8 blastomeres. The blastoderm elongates along the 2nd
cleavage axis, and arrangement of cells can sometimes appear slightly irregular.
Stage 6: 16-cell stage
The fourth cleavage plane, which is parallel to the second, forms 4 parallel rows of 4 cells
droplets migrate towards the vegetal pole.
Stage 7: 32-cell stage
The fifth cleavage plane divides 16 outer cells meridionally, while the inner 4 cells are
divided horizontally, crating an inner and outer layer of cells. Later in this stage the outer
cells undergo rearrangement and appears irregular with respect to each other.
Stage 8: Early Morula (64-128 cells)
The sixth cleavage, which is difficult to follow, results in the 64 smaller cells, with no
apparent increase in blastodisc size. The cells are clustered together forming 2-3 layers
in the center.
Stage 9: Late Morula (256-512 cells)
Depending on their position within a blastoderm, the cells have different cleavage planes
and undergo further divisions. The peripheral cells flatten, and the overall cell
arrangement results in the formation of 3-4 layers.
Stage 10: Early Blastula
The ongoing divisions result in smaller and more numerous cells, with central cells being
smaller than the outer. There is no apparent change in blastoderm size, which appears
yolk syncytial layer known as periblast.
Stage 11: Flat Blastula
The blastoderm sinks, flattens, and caps the yolk. The individual cells cannot be resolved
and blastoderm appears as a homogenous mass.
Stage 12: Pre-early gastrula
The circular blastoderm expands further over the yolk. The cell layers appear thicker on
one side, as the outer layer of cells migrates towards the vegetal pole. The blastoderm
appears as a biconvex disc with the upper layer being more convex. Under higher
magnification, 4-5 bands of irregular migrating nuclei can be observed at the margin of a
blastodisc.
Stage 13: Early gastrula
The blastoderm flattens and expands further to cover less than 20% of the yolk mass.
The band of cells on one side of the periblast continues to thicken, forming a dorsal lip of
the blastoderm. The fine droplets concentrate at the animal pole, the site where the
Stage 14:
The blastoderm expands further to cover about 25% of the yolk’s surface. The peripheral
cell layers of the dorsal lip thicken further, marking the future location of the embryonic
shield.
Stage 15: Pre-mid-gastrula
The blastoderm extends further over about 30% of the yolk, a process termed epiboly,
causing the relative thinning of this layer, while the embryonic shield continues to build
up increasing size around the dorsal lip.
Stage 16: The blastoderm covers more than 33% of the yolk sphere. The dorsal lip elongates and the subsequent cell divisions cause further build up of the embryonic
shield, which is greater at one portion of the blastoderm.
Stage 17: Mid-gastrula
The blastoderm covers 50% of the yolk, and the streak caused by thickening of the
embryonic shield, known as the embryonic axis, is apparent.
Stage 18. Late Gastrula
The blastoderm covers 75% of the yolk and the embryonic shield elongates and becomes
the vegetal pole.
Stage 19. Early Neurula
The blastoderm covers most of the yolk, with the small area at the vegetal pole, the
blastosphere, exposed. The embryonic axis (neural keel or neurula) broadens, with the
distinctive thickening anteriorly, forming a head (cephalic) region. The bilateral
thickening of the head region indicates the presence of rudimentary optic vesicles. Small
vacuoles (Kupffer’s vesicles) are present at the caudal (posterior) end, which is in contact
with the small blastophore.
Stage 20. Late Neurula
The blastophore is closed and the blastoderm covers the entire yolk. The upper cephalic
region widens and forms two optic buds. The further thickening of the head region results
in formation of the brain, forebrain, midbrain, and hindbrain regions. A group of
mesodermal cells aggregate ventrally to the embryonic axis, marking the location of
future anterior somite region.
Stage 21. 3-4 somites
The embryo increases in size and further mesodermal segmentation forms of 3-4 somites
apparent bilaterally in the embryo’s midline. The optic lobes in the head region are more