ABSTRACT
CLAURE SALINAS, TITO ELMER. Evaluation of Different Laboratory-Based Methods to Assess Freezing Tolerance in St. Augustinegrass (Stenotaphrum secundatum (Walt.) Kuntze). (Under the direction of Dr. Susana R. Milla-Lewis).
St. Augustinegrass is a popular lawn grass in the Southeastern US due to its excellent
shade tolerance and low input requirements. However, its sensitivity to low temperatures
reduces its potential for adaptation further north. Counting with an efficient and accurate
laboratory-based method to assess freezing tolerance in different genotypes will aid future
breeding efforts in this turfgrass. The objectives of this study were to: investigate several
laboratory-based freeze assays to develop a more consistent method to screen for differences
among St. Augustinegrass genotypes, and examine the histology of St. Augustinegrass nodes
and document how specific tissues within the node respond to freezing stress. For these
purposes, six experiments were designed using four freezing methods: complete stolons in
“rolls”, single-node stolons (SNS) in plastic containers, SNS in sponges, and SNS in conetainers.
The rolls and SNS in plastic containers methods produced much lower survival rates and were
effective at detecting differences among treatments. Desiccation seems to play an important
role during freezing. Thus, in methods where a media is surrounding the node (i.e. a sponge or
soil) this media acts as a buffer retaining moisture and reducing freezing damage. Overall,
Through all experiments, it was confirmed that Raleigh is more freezing tolerant than Seville.
Node position was found to be a determinant for freezing survival. Mid-region nodes
consistently had higher survival rates when compared with nodes from basal and apical regions.
This result will suggest structural and maybe metabolic differences that need to be determined
in order to refine freezing protocols for stoloniferous grasses. Histology results showed that
node death is linked to plugged vessels after freezing. Moreover, plugged vessels and disrupted
tissues occur at higher frequencies in the main stem than in new shoots. This would explain
why re-growth was observed to begin in new shoots, which act independently from the main
stem. Data generated from all these experiments make a significant addition to the
understanding of freezing processes and survival in St. Augustinegrass which should aid the
Evaluation of Different Laboratory-Based Methods to Assess Freezing Tolerance in St. Augustinegrass (Stenotaphrum secundatum (Walt.) Kuntze)
by
Tito E. Claure Salinas
A thesis submitted to the Graduate Faculty of North Carolina State University
in partial fulfillment of the requirements for the degree of
Master of Science
Crop Science
Raleigh, North Carolina
2011
APPROVED BY:
________________________________ ______________________________
Dr. Susana R. Milla-Lewis Dr. David P. Livingston
DEDICATION
To my Lord and Savior Jesus Christ.
To my beloved wife Dutsi and my two dear sprouts, Obed and Joel.
A mi Señor y Salvador Jesucristo.
BIOGRAPHY
Tito Elmer Claure Salinas, was born in Cochabamba, Bolivia. He studied Agricultural Engineering
at San Simon University. After graduation, he participated in an International training course for
wheat improvement at CIMMYT-Mexico. Later on, he worked as a wheat breeder for the Wheat
National Program (PROTRIGO) in Bolivia. At the same time he participated as an associate
researcher for the Durable Resistant Project in the Andean Zone (PREDUZA) in coordination
with the University of Wageningen-Netherlands. After four years of working in wheat
improvement, he got hired to work as a senior breeder for the Faba-bean program at the
Patino Foundation, where he worked for the last five years. He also taught Statistics at San
Simon University for three years, contributing in the formation of young professionals in
Agriculture and NNRR. After completing his MS degree, Tito plans to go back to Bolivia and
apply the knowledge acquired during his MS work on behalf of the resource–poor of the
ACKNOWLEDGMENTS
First, I would like to thank Dr. Milla-Lewis and Dr. Livingston, whose mentoring was
invaluable for me. Through all the ups and downs, they were always there encouraging me to
continue. I am also thankful to Dr. Arellano and Dr. Murphy for their advice and support.
I am thankful to the Fulbright Foundation, whose economical support made the
realization of this big goal in my life possible.
I want to express my gratitude to the Patino Foundation and especially to Dr. Gonzalo
Avila, for the opportunity I got to improve my professional skills.
To my dear wife Dutsi, and my lovely sons Obed and Joel. Eventhough a paragraph is not
enough to thank you; at least I want you to know that this accomplishment would never
become a reality without your support, patience and affection.
To my parents Tito and Nancy; I am thankful for their love and support.
To all the relatives and friends whom always cheered me to continue. To Tan Tuong,
Brian Hargett and family, Bob Page and family, Matias Menendez and family, Alfonso Tercio and
family, Luis Peña, and my dear Church of First Assembly, my sincere gratitude.
Finally, I am deeply in debt to God for providing me encouragement and give me the
TABLE OF CONTENTS
LIST OF TABLES ... vii
LIST OF FIGURES ... ix
CHAPTER I. LITERATURE REVIEW ... 1
Turfgrass industry ... 2
Warm-season and cool-season grasses ... 3
St. Augustinegrass distribution ... 4
Taxonomy ... 5
Morphology ... 6
St. Augustinegrass characteristics and cultivars ... 7
Low-temperature injury ... 9
Cold acclimation ... 11
Grass anatomy and freezing survival ... 15
Evaluation of freezing tolerance ... 15
References ... 18
CHAPTER II. Evaluation of Different Laboratory-Based Methods to Assess Freezing Tolerance in St. Augustinegrass (Stenotaphrum secundatum (Walt.) Kuntze) ... 26
INTRODUCTION ... 27
MATERIALS AND METHODS ... 30
Plant material ... 30
Acclimation treatments... 30
Freezing experiments ... 32
Experiment 1: Comparison of freezing temperatures and acclimation treatments ... 32
Experiment 2: Comparison of single-nodes vs. roll method ... 35
Experiment 3: Comparison of different freezing temperatures ... 36
Experiment 6: Comparison of varieties and acclimation treatments ... 39
Data collection and analysis ... 40
Histology ... 41
RESULTS AND DISCUSSION ... 42
Experiment 1: Comparison of freezing temperatures and acclimation treatments ... 42
Experiment 2: Comparison of single-nodes vs. roll method ... 49
Experiment 3: Comparison of different freezing temperatures ... 55
Experiment 4: Comparison of freezing methods ... 59
Experiment 5: Using SNS in conetainers to compare acclimation treatments.... 62
Experiment 6: Comparison of varieties and acclimation treatments ... 62
Histology ... 65
1. Nodal Structure ... 65
2. Responses to freezing ... 68
2.1 Lignin ... 68
2.2 Meristems ... 69
2.3 Vessel plugging ... 71
CONCLUSIONS ... 72
LIST OF TABLES
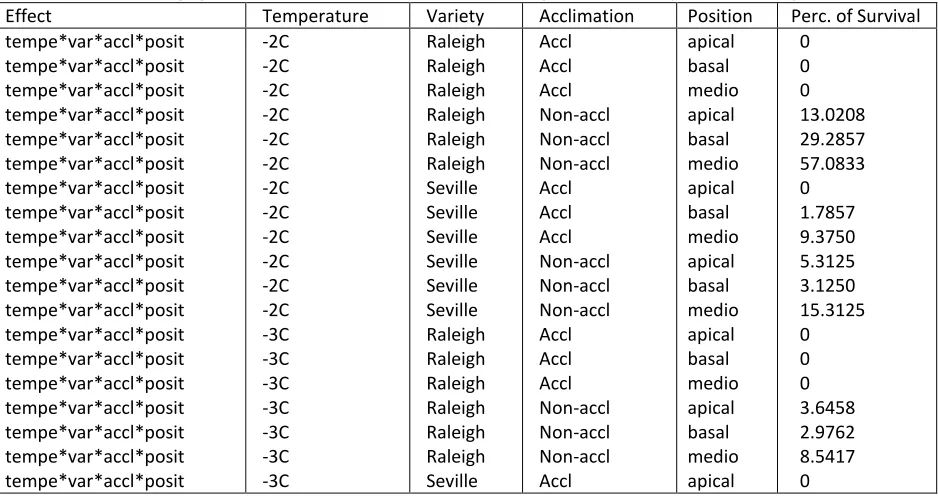
Table 1. Average percent of survival for the interaction temperature*variety*
acclimation*position ... 42
Table 2. Analysis of variance for acclimation and node-position effects on freezing survival of St. Augustinegrass cvs. Raleigh and Seville, after freezing at -2oC ... 44
Table 3. Analysis of variance on the effect of cold acclimation on node number for cvs. Raleigh and Seville ... 45
Table 4. Analysis of variance for the effect of cold acclimation on whole stolon survival of St. Augustinegrass cvs. Raleigh and Seville ... 48
Table 5. Combined analysis of variance of SNS vs. rolls freezing methods for measuring cold acclimation effects on two varieties of St. Augustinegrass ... 50
Table 6. Analysis of variance for the effect of cold acclimation on freezing survival of St. Augustinegrass cvs. Raleigh and Seville considering node position using the rolls method ... 51
Table 7. Effect of acclimation treatment and variety on node development during two weeks of cold acclimation ... 52
Table 8. Analysis of variance for the effect of freezing temperature, cold acclimation,
variety, and node-position on freezing survival of St. Augustinegrass ... 56
Table 9. Effect of variety in plant survival after freezing at -2oC as SNS in sponges ... 60
Table 10. Covariance parameter estimates for SNS in sponges’ freezing survival after
Table 11. Effect of moisture content using the sponge method for cvs. Raleigh and Seville frozen at -2oC ... 60
LIST OF FIGURES
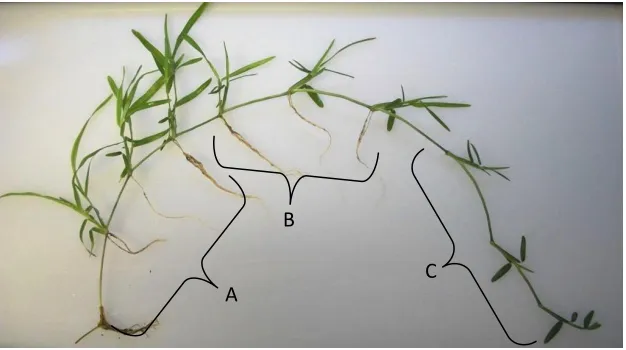
Figure 1. St. Augustinegrass stolon with three regions: A. basal, B. mid and C. apical outlined ... 32
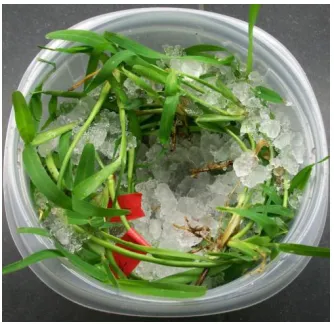
Figure 2. Preparation of ‘rolls’ for experiment 1 ... 33
Figure 3. Flat with the four stolons transplanted from a plastic container after freezing ... 34
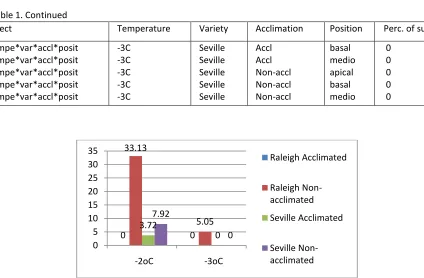
Figure 4. Effect of cold acclimation on cvs. Raleigh and Seville after freezing at -2oC
and -3oC, across the three positions ... 43
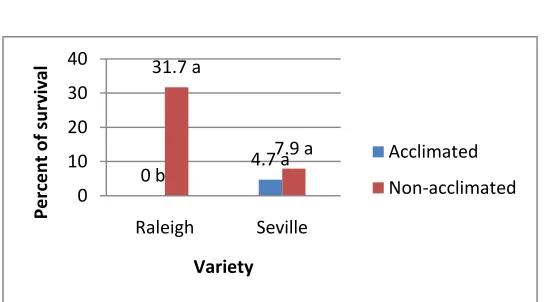
Figure 5. Effect of cold acclimation on variety survival after freezing at -2oC. ... 44
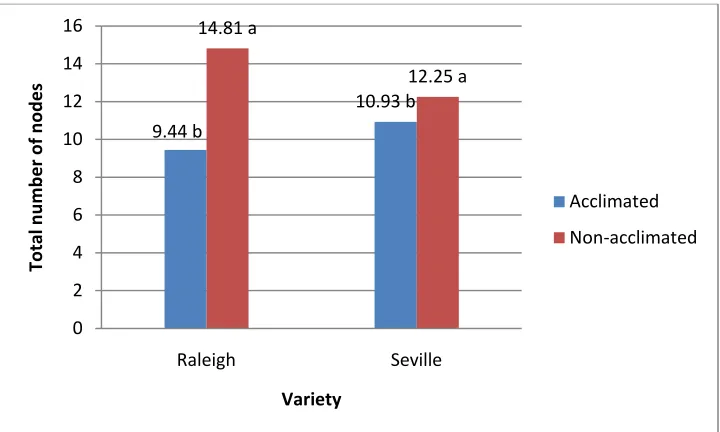
Figure 6. Effect of the interaction of cold acclimation and variety on plant growth mea-sured as total number of nodes per stolon after two weeks of acclimation ... 46
Figure 7. Percent of survival based on node-position, within the interaction of variety by acclimation treatment, after freezing at -2oC ... 47
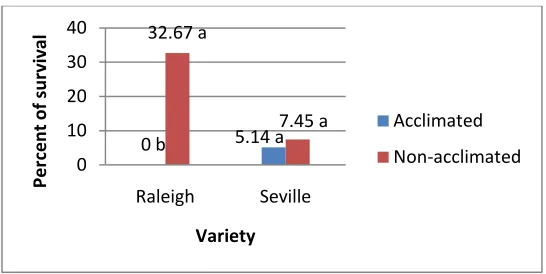
Figure 8. Effect of cold acclimation on freezing survival of St. Augustinegrass cvs. Raleigh and Seville considering whole stolon performance... 49
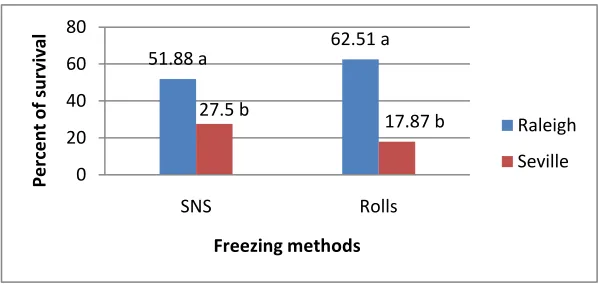
Figure 9. Effect of freezing methods over varieties for survival response after freezing at -2oC ... 50
Figure 10. Effect of cold acclimation over node position for survival response after freezing at -2oC ... 52
Figure 12. Node-position effect on plant survival across varieties and acclimation
treatments after freezing at -2oC ... 54
Figure 13. Effect of node-position on plant survival for cvs. Raleigh and Seville after
freezing at -2oC ... 54
Figure 14. Cultivar Seville showing differences in survival among the three stolon regions after freezing at -2oC ... 55
Figure 15. Effect of freezing temperature on node survival of St. Augustinegrass across varieties, temperatures, and node positions ... 57
Figure 16. Differences in survival for cv. Raleigh frozen at A) -4oC , and B) -2oC... 58
Figure 17. Effect of freezing temperature on node survival according to node position
and variety ... 58
Figure 18. Effect of sponge’s water content across varieties after freezing at -2oC. ... 61
Figure 19. Comparison of sponge’s moisture content treatments A) 45 g and B) 15 g ... 61
Figure 20. Freezing survival of five St. Augustinegrass’ genotypes across node positions and acclimation treatments after freezing at -6oC in conetainers ... 64
Figure 21. Effect of node position on freezing survival of five St. Augustinegrass’ genotypes across acclimation treatments after freezing at -6oC in conetainers ... 64
Figure 22. Cross section of (A) Seville and (B) Raleigh showing roots and shoots connections to the main stem, and (C) bundle vessels showing basic C4 structure ... 66
Figure 24. Seville’s node cross section, showing (A) a basal section compared to (B) an acropetal section where differences in lignin content are appreciated ... 68
Figure 25. Cross section of frozen Seville’s node showing (A) a basipetal section with dense lignified tissue surrounding the plugged vessels with almost intact intracellular space in the cortex, compared to (B) an acropetal section were this lignified tissues are almost absent and the damage is devastating ... 69
Figure 26. Cross section of frozen Seville node showing (A) a new shoot union to the main-stem, and (B) complete independence of the new shoot. Detailed magnification shows (C) plugged vessels, and (D) tissue disruption inside the main-stem ... 70
Turfgrass industry
In the U.S., the turfgrass industry is very important. In 2005, it represented around 50
million acres of managed turf (Shearman, 2006), and had an economic impact of $62.2 billion
dollars with a total value added impact of $37.7 Billion (representing total personal and
business net income) (Haydu et al, 2006).
In North Carolina, the economic impact of the turfgrass industry represents more than
4.7 billion dollars, having an employment effect over more than 96,465 permanent and
temporary jobs (North Carolina Dept. of Agriculture and Consumer Services, 1999). According
to the NCDA, turf maintenance expenses in 1999, estimated at more than 1.2 million dollars,
were greater than cash receipts for any agricultural commodity. The total turf-acreage in the
state, 2.1 million acres, is mainly divided among single-family dwellings, roadsides, commercial
properties, golf courses, schools, churches, airports, parks, institutions and cemeteries. Family
dwellings constitute, by far, the biggest section with more than 68% of the total acreage.
Apart from these economic benefits realized from turf grasses, their contributions in soil
and water protection, air cleansing, cooling, recreation and aesthetics are substantial. Every 2.5
acres of golf course turf sequester about one ton of carbon from the air per year. Turfgrasses
also provide safety and dust control along millions of miles of highways and thousands of
airport runways, trapping more than 12 million tons of dust and dirt annually. A 250 sq. ft. lawn
have the cooling effect of about 70 tons of air conditioning (Zhang et al., 2006b; Industry Turf
Initiative, 2010).
Warm-season and cool-season grasses
In general, turfgrasses can be divided in two major groups: warm- and cool-season.
Located in more temperate regions with optimum growth temperatures of 27-35oC,
warm-season grasses are characterized for having a C4 photosynthetic pathway and for showing
better tolerance to heat and drought. Meanwhile, their tolerance to cool temperatures is very
low, and they usually enter dormancy when temperatures are below 10oC (Emmons, 2000; Stier
and Fei, 2008). Cool-season grasses have an optimum growth temperature of 18-24oC, have a
C3 photosynthetic pathway, and, opposite to warm-season grasses, they can tolerate
cold-weather but have low tolerance to heat and/or drought conditions.
Regarding optimum weather characteristics for growing turfgrasses, Emmons (2000)
classifies the U.S. in three major regions: cool season, warm season, and transition zones. The
cool season zone consists of cool humid and cool arid regions. Located in the northern states,
this zone is characterized by very cold winters and moderate summers. Meanwhile, the warm
season zone is located in the southern part of the country. It includes warm humid and warm
arid regions, and it is characterized by moderate winters and very hot summers. The transition
zone is defined as a zone where winters could be too cold for warm-season grasses and
the warm- and cool-season zones. Because of its complex characteristics, the transition zone
results challenging for growing turfgrasses. Cool-season grasses can overwinter without major
problems, but cannot survive hot and drought summers. Meanwhile, warm-season grasses
grow comfortably during the summers, but are seriously affected by low temperatures in
winter. North Carolina is considered to be in the transition zone, having three major zones for
turfgrass development: the coastal plains, the piedmont, and the mountains. Warm-season
grasses are recommended for the coastal plains and warmer parts of piedmont, whereas
cool-season grasses are recommended for the western and piedmont regions (NC cooperative
extension service, 1992).
St. Augustinegrass distribution
Characterized as a warm-season grass, St. Augustinegrass was originally found on sandy
areas such as beach ridges, fringes of swamps and lagoons, water marshes, and limestone
shorelines. Then, the species gradually moved inland, resulting in a tolerance to a wide range of
soil types (Duble, 1989)
Although it was first discovered in South Carolina in 1788, St. Augustinegrass does not
seem to be native to North America because the other six species of the genus Stenotaphrum
are endemic and confined to shorelines from Africa to the South Pacific (Busey, 1995). Since its
first record of use in the 1880s, St. Augustinegrass has been widely used as lawn and pasture
Southern Mexico, throughout the Caribbean region, South America, South Africa, Western
Africa, Australia and the South Pacific and Hawaiian Islands (Duble, 2010). In the US, it is found
from the Carolinas to Florida, westward along the Gulf Coast to Texas, and in Southern and
Central California (Green et al, 1981; Duble, 1996; Trenholm et al, 2006; Moseley et al, 2010).
The only limiting factor for its expansion further north is its poor cold tolerance.
According to Maier et al (1994b), it is adapted to US Dept. of Agriculture hardiness zones 8, 9,
and 10. However, severe freezing injury may occur during some winters in zones 8 and 9. In the
case of North Carolina, it is recommended for the Piedmont and coastal plain regions only (NC
cooperative extension service, 1992).
Taxonomy
Characterized for having panicle or raceme inflorescences, the Stenotaphrum genus
belongs to the Paniceae tribe. Of the six species in the genus, only Stenotaphrum secundatum
(Walt.) Kuntze, commonly known as St. Augustinegrass in the U.S. and Buffalograss in Australia,
is used as a turfgrass (Emmons, 2000; Turgeon, 1999).
Kingdom: Plantae
Division: Embryophyta
Subdivision: Phanaerogama
Branch: Angiospermae
Subclass: Glumiflorae
Order: Poales
Family: Poaceae
Subfamily: Panicoideae
Tribe: Paniceae
Genus: Stenotaphrum
Species: Secundatum
Two taxonomic races exist within the species: the Breviflorus race characterized by
having a short spikelet, and the Longicaudatus race with long internodes and long leaves
(Busey, 2003).
Morphology
St. Augustinegrass is a perennial coarse-textured, stoloniferous, sod forming grass that
roots at the nodes (Green et al, 1981; Duble, 1996) with strong, thick stolons. The grass
produces a turf of medium density (Emmons, 2000). Its round-tipped leaf blades are 5 to 14
mm wide and arranged in a distichous manner (Busey 2003). Its stems (stolons) and
overlapping leaf sheaths are generally compressed. Leaf blades are generally folded, contracted
at the base, and subtended by constricted collars lighter than the blade or sheath, making the
leaves pseudopetiolate (Duble, 1996; Busey, 2003). The inflorescences are mostly terminal –
are contracted and often reduced to single spikelets, being imbedded in one face or the sides of
a corky rachis. Spikelets are lanceolate or ovate, awnless, and sesil. Glumes are membranous.
The lower glume is less than half as long as the spikelet. The lower floret is staminate or neuter,
and the upper floret is complete. The caryopsis which is ovate to oblong, 2.0 to 3.0 mm long,
often fails to mature (Duble, 1996; Busey, 2003).
As a C4 plant, St. Augustinegrass’ leaves have typical ‘Kranz anatomy’ (Laetsch, 1974).
The inner parenchyma bundle sheath is formed by a single layer of cells with centripetal
chloroplasts that facilitates compartmentalization of photosynthetic processes. Beyond this
layer lays a series of elongated mesophyll cells radiating from the vascular bundles (Turgeon,
1999; Busey, 2003).
St. Augustinegrass characteristics and cultivars
St. Augustinegrass’ importance as a lawn grass is due to its versatility and adaptability to
different growing conditions, and its relatively low maintenance requirements in comparison to
other warm-season turfgrasses (Green et al, 1980). It is a coarse textured grass with good color
and establishment rates (Emmons, 2000). It is mainly used for lawns as its tolerance to traffic is
only fair and not suitable for sport fields (Duble, 1989). Its propagation is mainly vegetative
through sprigs, plugs or sod (Beard, 1973).
Ranked among the most shade tolerant grasses, St. Augustinegrass is highly
This species also presents a very good salinity tolerance (Beard, 1973; Dudeck et al, 1993;
Emmons, 2000). It is one of the most effective turfgrasses when looking at leachate NO3-N
concentration and cumulative N leached (Bowman et al, 2002). Therefore, it has potential for
reduced environmental impact. The three main biotic problems for this species are the
southern chinch bug, St. Augustinegrass decline virus (SAD), and gray leaf spot disease
Pyricularia grisea (Cke.) Sacc. (Bussey, 2003).
Regarding St. Augustinegrass cultivars, one of the first ones mentioned in the literature
is ‘Texas Common’ which is a strain of St. Augustinegrass grown commercially in Texas since
1920 (Busey, 2003). Other selections from Florida were available prior to 1960 such as
‘Bitterblue’ and ‘Floratine’ (White and Busey, 1987; Nutter and Allen, 1960). Following the same
line, in 1972 ‘Floratam’ was released as a SAD-resistant. All three of these cultivars are coarse
textured (Horn et al., 1973). ‘Floralawn’, a chinch bug resistant cultivar, resulted as an
improvement over Floratam (Duble, 1989; Busey, 2003). In 1980 the NC Experiment Station
released ‘Raleigh’ as a cold tolerant SAD-resistant cultivar of medium texture (Emmons, 2000).
From the private sector, O.M. Scott Company released three semi-dwarf type cultivars: ‘Seville’
(Riordan et al, 1980), ‘Jade’ and ‘Delmar’ (Riordan et al, 1991), all with much finer texture but
more cold-sensitive (Busey, 2003). Another fine-texture cultivar is ‘Palmetto’, released by Mr.
Regarding the freezing tolerance of St. Augustinegrass, Philley (1998) found that
‘Raleigh’ and ‘Seville’ were among the varieties with the best and worst levels of freezing
tolerance, respectively, measured in terms of lethal temperatures and winter survival. Others
like Texas Common and Delmar were found around the average of freeze tolerance (LT50 >
-6.2oC) (Philley et al, 1995).
Duble (1996) described Seville as a SAD-resistant, fine textured variety, but with poor
levels of freezing-tolerance, and Raleigh as a freeze-tolerant, SAD-resistant variety. Maier et al
(1994) mentioned that ‘Raleigh’ had higher freezing tolerance than ‘FX-332’ or ‘Floratam’, and
was a cultivar that acclimates to cold. Therefore, Raleigh is considered the industry’s standard
for freeze tolerance among St. Augustinegrass’ cultivars. Based on this, Li et al (2010) developed
an acclimation protocol based on Raleigh’s response to freezing.
Low-temperature injury
As mentioned by Stier and Fei (2008), grasses may be injured by either chilling or ice
formation within the plant (freezing injury). Chilling injury occurs at temperatures below 12oC,
and it is usually characterized by wilting, cessation of growth, loss of chlorophyll, reduction in
photosynthetic rate, and presence of water-soaked leaf lesions (DiPaola and Beard, 1993; Stier
and Fei, 2008). Chilling injury disrupts cell membrane activity, leading to electrolyte loss from
acute (direct) if it occurs in a term of 24 h, or it can be chronic (indirect) if it takes several days
of low temperature (Stier and Fei, 2008).
In the case of freezing injury, previous studies have determined that it is caused by ice
formation rather than low temperatures per se (Fry and Huang, 2004). The process is complex
because it involves the dynamics and kinetics of water as is interacts with various tissues
(Livingston et al, 2006a). The place where ice formation occurs determines the kind of damage
produced. If intracellular, freezing produces membrane rupture and immediate cell death.
Meanwhile, extracellular freezing produces dehydration (Webb et al 1994; Guy 1999; Fry and
Huang, 2004; Zhang et al, 2006a; Fujikawa et al, 1999). Other minor factors that may cause
freezing damage are: cell death when limits to deep supercooling are exceeded, death of shoots
due to persistent embolisms in xylem vessels, and disease when pathogens enter through
lesions (Pearce, 2001).
Of all the processes referred to above, one of the most important is freezing-induced
dehydration. This can be defined as a process where the ice formed in the intercellular matrix
(extracellular ice) produces a gradient of chemical potential between the ice outside the cell
and the unfrozen solution inside the cell. As a consequence, unfrozen water inside the cells
moves out and freezes outside the cells which results in an increase of intracellular solutes
(Tomashow, 1999) but, at the same time, produces extra pressure on the cell membranes and
damage as result of freezing-induced dehydration: 1) expansion-induced-lysis (EIL), 2)
lamellar-to hexagonal- II phase transitions are known as loss of osmotic responsiveness with endocylamellar-totic
vesiculation and HII phase (LOR-HII), and 3) loss of osmotic responsiveness associated to the
fracture-jump lesion (LOR-FJL) ((Tomashow, 1999; Uemura-Steponkus, 1999; Uemura et al,
2006).
Cold acclimation
To prevent or reduce the risks of freezing injury, plants have developed numerous
mechanisms to be prepared for winter time, one of them being cold-acclimation (CA). This
process can be defined as “an enhanced ability of plants to survive freezing temperatures by
exposure to low but above freezing temperatures” (Livingston et al, 2006a). Many species are
able to acclimate, showing marked seasonal differences in cold resistance (Levitt, 1980;
Alberdi-Corcuera, 1991).
In general CA is an inducible and transient process (Guy, 1990) by which the plant
responds to temperature decreases and photoperiod changes. There are three ways to induce
CA in plants: exposure to low temperatures, photoperiod reduction, and abscisic acid (ABA)
interactions. Plants exposed to cold, non-freezing temperatures become hardened or
acclimated, allowing greater resistance to freezing stress (Alberdi-Corcuera, 1991; Thomashow,
1999; Fry and Huang, 2004; Stavang et al, 2008). The requirements for this process to take
long the low temperature persists, and the photoperiod requirements (Alberdi-Corcuera, 1991;
Gray et al, 1997; Ensminger etal, 2006).
Cold acclimation can be achieved usually in two to three stages (Gusta et al, 2005). The
first stage corresponds to temperatures below 10oC, where a reduction in growth and
up-regulation of transcriptional factors is noticeable. In the second stage, with temperatures close
to 0oC, cryoprotective compounds (such as proteins and sugars) are produced, and repair
mechanisms developed. Finally, in the third stage, also called second-phase hardening, plants
are exposed to temperatures below 0oC for a very short period of time (usually days)
(Livingston and Henson, 1998).
Evidence suggests that ABA can substitute the low temperature stimulus, and that
maybe there are ABA-dependent and ABA-independent pathways involved in the acclimation
process (Gusta et al, 2005). Even though ABA does not regulate all genes associated with
acclimation, it definitely regulates many of the genes associated with an increase in freeze
tolerance.
The relationship between photoperiod and CA is based on photosynthesis. It is clear
that photosynthetic redox interacts with other processes like sugar-signaling pathways to
regulate plant acclimation to low temperatures (Esminger et al, 2006). It is also important to
consider the seasonal variations on CA. Beard (1966) found that turfgrasses reached their
decline in April. As a morphological indicator of acclimation, it is common to see that plants
become darker green, reduced their leaf area, and become less succulent (Ebdon et al, 2002;
Ito et al., 1985). Also, the level of CA varies between the different parts of the plant; young
leaves are hardier than old leaves or the leaf apex (Beard, 1973). Many types of physiological
and morphological responses are correlated with the degree of CA achieved, including
reduction in cell size, increase in carbohydrate level, changes in types of proteins, and reduction
in cell water content (Alberdi-Corcuera, 1991; Beard, 1973).
Regarding the biochemical changes during acclimation in general, there is an increase in
cytoplasmic solutes, soluble proteins, amino acids, carbohydrates and inorganic solutes. These
compounds act as cryoprotectants and buffer any freezing-induced concentration of other
solutes that could become toxic at high levels. This solute accumulation depresses the freezing
point or ice nucleation point of cells thus increasing cell resistance to ice formation and
regulating dehydration (Fry and Huang, 2004).
In turfgrasses, many studies have been carried out on the role of carbohydrates and
proteins on freezing tolerance. In Annual Bluegrass, it has been determined that cold hardening
induces major changes in amino acid levels in overwintering crowns, with proline, glutamine,
and glutamic acid contributing the most to total amino acid accumulation after acclimation
(Dionne et. al., 1991). In addition, fructose, glucose, raffinose, and stachyose were also found to
saltgrass, Shahba et. al. (2003) found that high molecular weight fructants (DP>6) were the
most abundant carbohydrates in cold-acclimated vs. non-acclimated plants. Furthermore,
sucrose levels increased at temperatures below freezing. However, variations in fructan and
sucrose levels were not related to different freezing tolerance levels. In the case of
Zoysagrasses, higher concentrations of total reducing sugars, glucose, and proline were
positively associated with freezing tolerance, whereas higher concentrations of starch appeared
detrimental to the trait (Patton et al, 2007). In Bermudagrass, cold acclimation not only induced
accumulation of sugars and proline, but also of total nonstructural carbohydrates (TNC) and
protein. Meanwhile, catalase (CAT), and ascorbate peroxidase (APX) activity decreased in
response to cold acclimation (Zhang et al, 2006a). In St. Augustinegrass, Fry et al (1991) found
that changes in the concentration of total non-structural carbohydrates or soluble sugars did
not seem to influence freezing tolerance. Maier et al (1994) determined that neither starch nor
sucrose -the primarystorage carbohydrate in stolons- werecorrelated with freezing tolerance in
cultivars ‘Raleigh’, ‘Floratam’ and ‘FX-332’. The only significant correlation (r = - 0.80) they
found was between freezing survival and stolon water content in “Raleigh”. Therefore, it was
concluded that water content reduction in `Raleigh' stolons during the winter months could
have contributed to its freezing survival
It is generally known that warm-season grasses don’t respond well to cold acclimation
reports for Saltgrass (Shahba et al, 2003), Buffalograss (Qian et al, 2001), Zoysiagrass
(Patton-Reicher, 2007) and Bermudagrass (Anderson et al, 1988; Anderson et al, 1993, Anderson et al,
2003) indicating that these warm-season grasses can cold-acclimate and exhibit good freezing
tolerance. In St. Augustinegrass, it has also been observed that some cultivars show differences
in freezing survival when cold acclimated (Maier et al, 1994; Li et al, 2010).
Grass anatomy and freezing survival
Regarding the relationship between plant anatomy and freezing survival, Ahring et al
(1975) demonstrated that in turfgrasses internode length and rhizome depth influenced
freezing tolerance. Shorter internodes and deeper rhizomes were positively correlated with
more freezing resistant plants. Wood and Cohen (1984) found that in perennial ryegrass, crown
height -as indicated by sub-crown internode length- was negatively correlated with freezing
tolerance. These results reveal, as Livingston et al (2005) found in winter cereals, that whole
plant survival results from the ability of meristematic tissues within the crown to remain intact.
For turfgrasses it has being demonstrated that successful recovery from freezing stress depends
upon the meristematic tissues inside crowns and nodes to survive freezing damage (Harrison,
1997; Hoffman, 2010).
Evaluation of freezing tolerance
In general, there are two ways to test freezing tolerance: field observations and
observations may vary from location to location and from year to year making it difficult to
have a uniform evaluation in a short period of time. However, this is the most reliable way to
asses freezing tolerance since it deals with much more factors than the few ones controlled by
laboratory-based experiments.
In the case of laboratory-based experiments, freeze tolerance of grasses is evaluated by
two means: measuring electrolite leakage (EL), where lethal temperatures are predicted by EL
(Gusta et al, 1980; Fry et al, 1991; Maier et al, 1994a; Ebdon et al, 2002) or evaluation of tissue
re-growth after freezing (Maier et al, 1994; Li et al, 2010). However, inconsistencies in the EL
procedure might make re-growth tests a better option to determine freeze tolerance in grasses
(Patton and Reicher, 2007).
Based on the principle that different parts of the turfgrass plant have different levels of
tolerance to low temperatures (Beard, 1973), different protocols for laboratory-based freezing
tests have been tried. Most of these focused on the protocol steps and freezing temperatures.
Ahring and Irving (1969) froze 5-node rhizomes in Bermudagrass and evaluated response
through the triphenyl tetrazolium chloride (TTC) test. Anderson (1975) used conetainers to
evaluate freezing in Bermudagrass. Bush et al (2000) used single node cuttings of Carpetgrass
wrapped in paper towels. Dione et al (2001a) evaluated bluegrass tillers in tubes. Quian et al
(2001) used 10-node stolons wrapped in moist tissue paper for a Buffalograss shoot and root
freezing Saltgrass’ 2-node rhizomes wrapped in moist paper. Patton et al (2007a) evaluated
Zoysiagrasses using single-node stolons in conetainers. In the case of St. Augustinegrass,
different laboratory-based methods have been used to test freezing survival. For example, Fry
et al (1991) used the electrolyte leakage (EL) method and determined an LT50 of -6.1 for
Floratam. Philley (1995) used EL with single-node stolons, and found that Raleigh, Texas
Common and Delmar had lower LT50 (<-6.2) than Seville, Floratam and FX-33. Other studies
considered scoring survival after freezing a better way to evaluate freezing response among
genotypes. For example, Maier et al (1994b) evaluated the freezing response of 4-node stolons
placed in plastic bags and Li et al (2010) did the same using single-node stolons in plastic
containers. Differences in technique between these experiments resulted in LT50’s as high at
-4oC (Li et al, 2009) and as low as -6oC (Maier et al, 1994b).
Furthermore, there is no uniformity in cold-acclimation response results obtained by
various authors. For example, Fry et al (1991) did not observe a response to field acclimation in
Floratam. In contrast, Maier et al (1994b) froze field-acclimated Raleigh at -6oC and obtained
superior survival (>60%) as compared to non-acclimated plants. Moreover, Li et al (2010) found
higher levels of survival in laboratoryacclimated vs. nonacclimated Raleigh stolons frozen at
-4oC. To date, no St. Augustinegrass study has compared a wide spectrum of freezing protocols,
REFERENCES
Ahring, R.M.; W.W. Huffine, C.M. Taliaferro, and R.D. Morrison. 1975. Stand establishment
of Bermudagrass from seed. Agronomy Journal 67:229-232.
Alberdi, M.; and L.J. Corcuera. 1991. Cold Acclimation in Plants. Review article 62.
Phytochemistry 30(10):3177-318.
Anderson, J.A., C.M. Taliaferro, and D.L. Martin. 1993. Evaluating freeze tolerance of
Bermudagrass in a controlled environment. HortScience 28:955.
Anderson, J.A.; C.M. Taliaferro, and D.L. Martin. 2003. Longer exposure durations increase
freeze damage to turf Bermudagrasses. Crop Sci 43:973–977.
Beard, J.B. 1966. Direct low temperature injury of nineteen turfgrasses, Q. Bull. Michigan
Agr. Exp. Stn. 48:377-383.
Beard, J.B. 1973. Turfgrass: Science and Culture. Prentice Hall, Inc., Englewood Cliffs, N.J.
658 p.
Bowman, D.C.; C.T. Cherney, and T.W. Jr. Rufty. 2002. Fate and transport of nitrogen applied
to six warm-season turfgrasses. Crop Sci 42:833–841.
Busey, P. 1995. Genetic diversity and vulnerability of St. Augustinegrass. Crop Sci
35:322-327.
Busey, P. 2003. St. Augustinegrass. In: M.D. Casler and R.R. Duncan (eds). Turfgrass biology,
Dionne, J., Y. Castonguay, P. Nadeau, and Y. Desjardins. 2001. Amino acid and protein
changes during cold acclimation of green-type Annual Bluegrass (Poa annua L.)
Ecotypes. Crop Sci 41:1862-1870.
Duble, R.L. 1989. Southern turfgrasses: their management and use. Published by TexScape,
Inc. College Station, TX. 335 p.
Duble, R.L. 1996. Turfgrasses, their management and use in the southern zone. Second
Edition. Texas A&M University press.
Dudeck, A.E.; C.H. Peacock, and J.C. Wildmon. 1993. Physiological and growth responses of
St. Augustinegrass cultivars to salinity. HortSci 28(1):46-48.
Ebdon, J.S.; R.A. Gagne, and R.C. Manley. 2002. Comparative cold-tolerance in diverse turf
quality genotypes of Perennial Ryegrass. Crop Sci 43:973–977.
Emmons, R.D. 2000. Turfgrass Science and Management. Third edition. Delmar Thomson
Learning. NY. 528 p.
Ensminger, I.; F. Busch, F.; and N.P.A. Huner. 2006. Photostasis and cold acclimation: sensing
low temperature through photosynthesis. Review. Physiologia Plantarum 126: 28–44.
Fry, J.D., N.S. Lang, and R.G.P. Clifton. 1991. Freezing resistance and carbohydrate
composition of ‘Floratam’ St. Augustinegrass. HortSci 26:1537-1539.
Fujikawa, S; Y. Jitsuyama, and K. Kuroda. 1999. Determination of the role of cold
acclimation-induced diverse changes in plant cells from the viewpoint of avoidance of freezing
injury. J. Plant Res. 112: 237-244.
Green, R.L., A.E. Dudeck, L.C. Hannah, and R.L., Smith. 1981. Isoenzyme polymorphism in St.
Augustinegrass. Dep. of Omamental Horticulture, IFAS, Univ. of Florida, Gainesville, FL
32fi11. Published with the approval of the Director of the Florida Agric. Exp. Stn. as
Journal Series Paper No. 2479
Gusta, L.V.; J.D. Butler, C. Rajashekar, and M.J. Burk. 1980. Freezing resistance of perennial
turfgrasses. HortScience 15:494-496.
Gusta, L. V., R. Trischuk, and C.J. Weiser. 2005. Plant cold acclimation: the role of abscisic
acid. J Plant Growth Regul 24:308–318.
Guy, C.L. 1990. Cold acclimation and freezing stress tolerance: role of protein metabolism.
Annual Review of Plant Physiology and plant Molecular Biology 41:187-223.
Gray, G.R.; L. Chauvin, F. Sarhan, and N.P.A. Hune. 1997. Cold acclimation and freezing
tolerance: a complex interaction of light and temperature. Plant Physiol. 114: 467-474.
Harrison, J., C. Tonkinson, C. Eagles, and C. Foyer. 1997. Acclimation to freezing
temperatures in perennial ryegrass (Lolium perenne). Acta Physiologiae Plantarum
Haydu, J.J.; A.W. Hodges, A.W., and Charles R. Hall. 2006. Economic impacts of the turfgrass
and lawncare industry in the United States. EDIS document FE632, Food and Resource
Economics Department, Florida. Cooperative Extension Service, Institute of Food and
Agricultural Sciences, University of Florida, Gainesville, FL.
Hoffman,L., M. DaCosta, J.S. Ebdon, and E. Watkins. 2010. Physiological changes during cold
acclimation of Perennial Ryegrass accessions differing in freeze tolerance. Crop Sci
50:1037–1047.
Horn, G. C., A. E. Dudeck, and R. W. Toler. 1973. 'Floratam' St. Augustinegrass: A fast growing
new variety for ornamental turf resistant to St. Augustine decline and chinch bugs. Fla.
Agr. Exp. Stn. Circ. S-224.
Laetsch, W.M. 1974. The C4 syndrome: a structural analysis. Ann. Rev. Plant Physiol
25:27-52.
Levitt, J. 1980. Responses of plants to environmental stresses. Vol I. Chilling, freezing, and
high temperature stress. Academic, New York. p 67-290.
Li, R.; R.Qu, A.H. Bruneau; and D.P. Livingston. 2010. Selection for freezing tolerance in St.
Augustinegrass through somaclonal variation and germplasm evaluation. Plant Breeding
Livingston, D.P. III; and C.A. Henson. 1998. Apoplastic sugars, fructans, fructan
exohydrolase, and invertase in winter oat: responses to second-phase cold hardening.
Plant Physiol. 116:403-408.
Livingston, D.P., III, S.P. Tallury, S. Owens, J.D. Livingston, and R. Premakumar. 2006a.
Freezing in nonacclimated oat: thermal response and histological observations of
crowns during recovery. Can. J. Bot. 84: 199–210.
Livingston, D.P., III, S.P. Tallury, R. Premakumar, S. Owens, and C.R. Olien. 2005. Changes in
the histology of cold-acclimated oat crowns during recovery from freezing. Crop Sci. 45:
1545– 1558.
Maier, F. P., N. S. Lang, and J.D. Fry. 1994a. Evaluation of an electrolyte leakage technique to
predict St. Augustinegrass freezing tolerance. HortScience 29(4):316–318.
Maier, F. P., N. S. Lang, and J.D. Fry. 1994b. Freezing tolerance of three St. Augustinegrass
cultivars as affected by stolon carbohydrate and water content. J. Amer. Soc. Hort. Sci.
119:473-476.
Moseley, D., A. Patton, J. Trappe. 2010. Leaf and stolon characteristics of commercially
available and experimental St. Augustinegrass cultivars. Arkansas Turfgrass Report 2009,
Ark. Ag. Exp. Stn. Res. Ser. 579:64-68.
Nutter, G. C. and R. J. Allen, Jr. 1960. Floratine St. Augustinegrass: A new variety for
National Turfgrass Evaluation Program, (U.S.). 2003. "The National Turfgrass research
initiative : enhancing America's beauty protecting America's natural resources ensuring
the health and safety of all americans." [Beltsville, Md.] : National Turfgrass Evaluation
Program, Betsville Agricultural Research Center, [2003], 2003. Agricola, EBSCOhost.
NC Cooperative Extension Service. 1992. Selecting and Managing Lawn Grasses for Shade.
North Carolina Cooperative Extension Service. p 4.
Pearce, R.S. 2001. Plant Freezing and Damage. Annals of Botany 87:417-424
Patton, A.J. and Z.J. Reicher. 2007. Zoysiagrass Species and Genotypes Differ in Their Winter
Injury and Freeze Tolerance. CROP SCIENCE, VOL. 47:1619-1627.
Philley, H.W., C.E. Watson Jr., J.V. Krans, J.M. Goatley Jr., and F.B. Matta. 1995. Differential
thermal analysis of St. Augustinegrass. HortScience 30:1388-1389.
Philley H, Watson C, Krans J, Goatley J, Maddox V, and Tomaso-Peterson M. 1998.
Inheritance of cold tolerance in St. Augustinegrass. Crop Sci 38: 451—454.
Qian, Y.L., S. Ball, Z. Tan, A.J. Koski, and S.J. Wilhelm. 2001. Freezing tolerance of six
cultivars of Buffalograss. Crop Sci 41:1174–1178.
Reinert, J. A., B. D. Bruton, and R. W. Toler. 1980. Resistance of St. Augustinegrass to
southern chinch bug and St. Augustine Decline Strain of Panicum Mosaic Virus. J. Econ.
Riordan, T. P., V. D. Meier, J. A. Long, and J. T. Gruis. 1980. Registration of ‘Seville’ St.
Augustinegrass. Crop Sci. 20:824-825.
Riordan, T. P., V. D. Meier, and W.C. Mixson. 1991. Registration of ‘DelMar’ St.
Augustinegrass. Crop Sci. 31 (2), p. 482.
Shahba, M.A., Y. L. Qian, H.G. Hughes, A. J. Koski, and D. Christensen. 2003. Relationships of
soluble carbohydrates and freeze tolerance in Saltgrass. Crop Sci 43:2148-2153.
Stavang, J. , M. Hansen, and J.E. Olsen. 2008. Short term temperature drops do not enhance
cold tolerance. Plant Growth Regul 55:199–206.
Stier, J.C., D. L. Filiault, M. Wisniewski, and J. P. Palta. 2003. Visualization of freezing
progression in Turfgrassses using infrared video thermography. Crop Sci 43:415–420.
Stier, J.C.; and S. Fei. 2008. Cold-Stress physiology and management of turfgrasses. In:
Handbook of Turfgrass Management and Physiology. Edited by Mohammad Pessarakli.
CRC Press. Taylor & Francis Group, AZ. p. 473-495.
Tomashow, M.F. 1999. Plant cold acclimation: freezing tolerance genes and regulatory
mechanisms. Annu. Rev. Plant Physiol. Plant Mol. Biol. 50:571–99.
Trenholm,L.E., J.L. Cisar, and J.B. UnruhB. 2006. St. Augustinegrass for Florida lawns. Fact
Sheet ENH5. From series of the Environmental Horticulture Department, Florida
Cooperative Extension Service, Institute of Food and Agricultural Sciences, University of
Turgeon, A.J. 1999. Turfgrass Management, Fifth Edition. Prentice Hall. Upper Saddle River,
NJ. 392 p.
Uemura, M.; and P.L. Steponkus. 1999. Cold acclimation in plants: relationship between the
lipid composition and the cryostability of the plasma membrane. J. Plant Res.
112:245-254.
Uemura, M., Y. Tominaga, C. Nakagawara, S. Shigematsu, A. Minami, and Y. Kawamura.
2006. Responses of the plasma membrane to low temperatures. Physiologia Plantarum
126: 81–89.
Webb,M.S.; M. Uemura, and P. Steponkus. 1994. A comparison of freezing injury in oat and
rye: two cereals at the extremes of freezing tolerance. Plant Physiol. 104:467-478.
Wood, G.M. and R.P. Cohen. 1984. Predicting cold tolerance in perennial ryegrass from
subcrown internode length. Agronomy Journal 76(4):516-517.
Zhang,X; E.H. Ervin, and A.J. LaBranche. 2006a. Metabolic defense responses of seeded
Bermudagrass during acclimation to freezing stress. Crop Sci. 46:2598–2605.
Zhang, Y.; M.A.R. Mian, and J.H. Bouton. 2006b. Recent molecular and genomic studies on
Chapter II
INTRODUCTION
St. Augustinegrass [Stenotaphrum secundatum (Walt.) Kuntze] is a coarse-textured,
stoloniferous, sod forming grass (Green et al, 1981) that produces a turf of medium density
(Emmons, 2000) with strong, thick stolons. The species is popular as a lawn grass due to its
versatility and adaptability to different growing conditions, its relatively low maintenance
requirements in comparison to other warm-season turfgrasses (Green et al, 1981), and its
superior shade tolerance. However, it is the least cold tolerant of the warm season grasses
(Emmons, 2000) a characteristic that impedes the expansion of its area of adaptation further
north. According to Maier et al (1994b), it is adapted to U.S. Dept. of Agriculture hardiness
zones 8, 9 and 10. However, severe freezing injury may occur during some winters in zones 8
and 9. This low tolerance to cold temperatures represents a serious problem given that St.
Augustinegrass is a sod-produced grass and it is not commercially multiplied by seed. While
residential sites may offer some protection from cold, sod is usually produced in large open
fields rendering it more susceptible to cold injury. Improvement of cold tolerance in St.
Augustinegrass would increase the area of adaptation and potential use of this important
turfgrass species (Philley, 1998).
Freezing injury in plants is caused by ice formation rather than low temperatures per se
(Fry and Huang, 2004). The process is complex because it involves the dynamics and kinetics of
al, 2006). If freezing is intracellular, membranes are ruptured and cell death usually occurs.
Extracellular freezing can cause dehydration due to osmotic differences between the cell and
extracellular ice (Webb et al, 1994; Guy, 1990; Fry and Huang, 2004). Stier et al (2003)
demonstrated that in grasses, freezing begins in roots, progresses into the crown, and then
moves rapidly upwards into shoots and leaves. The crown contains meristematic regions from
which new roots and shoots originate to produce a new functional plant. Therefore, whole
plant survival depends on the ability of these meristematic regions to survive freeze injury
(Livingston et al, 2005a). In some turfgrasses such as St. Augustinegrass, these meristematic
regions are located in the nodes. Each node has the ability to develop leaves, roots and lateral
shoots (Duble, 1996). Ahring et al (1975) demonstrated that in turfgrasses internode length and
rhizome depth are unique morphological traits that influence freezing tolerance. Shorter
internodes and deeper rhizomes resulted in more freezing resistant plants. Moreover, Wood
and Cohen (1984) found that in perennial ryegrass, crown height –as indicated by sub-crown
internode length- is negatively correlated with freezing tolerance. While these studies point to
the importance of turfgrass crown and nodes in freezing survival, no information is available on
the histological structure of turfgrass nodes or on how specific node regions respond to
freezing stresses.
Exposure of plants to low but non-freezing temperatures enables plants to better
the fall prior to the onset of winter (Fry and Huang, 2004; Stavang et al, 2008). The temperature
and length of time required for this process vary for different species. In general, acclimation
seems to be due to changes in cell membrane properties and reductions in cell water content.
In general, warm-season grasses don’t respond well to cold acclimation and may have limited
capacity to cold-acclimate (Stier and Fei, 2008). However, there are reports for Saltgrass
(Shahba et al, 2003), Buffalograss (Qian et al, 2001), Zoysiagrass (Patton and Reicher, 2007) and
Bermudagrass (Anderson et al, 1993; Anderson et al, 2003) indicating that these warm-season
grasses can cold-acclimate and exhibit good freezing tolerance.
Studies on freezing tolerance in St. Augustinegrass are inconclusive and somewhat
preliminary compared to those for other turfgrass species. A study on the inheritance of
freezing tolerance in St. Augustinegrass (Philley et al, 1998), found that ‘Raleigh’ and ‘Seville’
were among the varieties with the best and worst levels of freezing tolerance -measured in
terms of lethal temperature and winter survival- respectively. Duble (1996) confirmed these
findings by describing Seville as a St. Augustine decline virus (SAD)-resistant, fine textured,
freeze-sensitive variety, and Raleigh as a freeze-tolerant, SAD-resistant variety. Maier et al
(1994) found that Raleigh had higher freezing tolerance than ‘FX-332’ or ‘Floratam’, and was a
cultivar that acclimates to cold. The same was found by Li et al (2010), who developed an
Different methods have been used to test for freezing survival in St. Augustinegrass. Fry
et al (1991) used electrolyte leakage (EL), Maier et al (1994b) measured survival rates after
freezing, and Li et al (2010) used a similar method as Maier, but with single nodes. Differences
in technique between these experiments resulted in LT50’s as high at -4oC (Li et al, 2010) and as
low as -6oC (Maier et al, 1994a). Moreover, no information is available on how different
freezing methods may result in differences in LT50.
The objectives of this study were: (1) to investigate several laboratory-based freeze
assays to develop a more consistent method to screen for differences among St. Augustinegrass
genotypes, and (2) to examine the histology of St. Augustinegrass nodes in order to document
how specific tissues within the node respond to freezing stress.
MATERIALS AND METHODS Plant Material
Given that St. Augustinegrass is mostly propagated asexually, all experiments were
performed utilizing vegetative materials. Flats of cultivars Raleigh and Seville were maintained
at the North Carolina State University Greenhouse facilities (Raleigh, NC). These were
considered to be the “mother plants” (sources of vegetative material) for all experiments. Flats
were grown at 25 ± 5oC with regular irrigation every other day. Fertilization was performed
48.8 g m-2, and every two weeks with Scotts® Starter Fertilizer (The Scotts Company LLC,
Marysville, OH). Plants were mowed weekly to a 3–inch height. Terminal single stolons (apical
stolon with three leaves plus the following node and internode) were collected from mother
plants. Stolons were planted in flats filled with Fafard® 2 potting mix (Conrad Fafard Inc.,
Agawam, MA), and grown in the greenhouse during the months of May through December at
27 ± 5oC. During these months, stolons were propagated every two weeks to ensure a constant
supply of materials for the freezing tests. For every experiment, stolons were grown for two
months without mowing, under the same watering and fertilization regimes as mother plants.
No additional lighting was provided.
St. Augustinegrass stolons were divided into three regions: apical, mid and basal (Fig. 1).
The apical region consisted of nodes that had young, not fully expanded leaves and no roots.
The mid region was composed of nodes with well developed roots and fully expanded leaves
but with no secondary shoots. The basal region consisted of the oldest nodes with fully
Figure 1. St. Augustinegrass stolon with three regions: A. basal, B. mid, and C. apical outlined.
Acclimation Treatments
Plants were acclimated by transferring flats with two month-old plants to a 13oC growth
chamber with a 12 h photoperiod at 300 mmol m-2 s-1 PAR (80% cool fluorescent and 20%
incandescent bulb illumination) for one week. After that, flats were transferred to a 3oC
chamber with a 10 h photoperiod at 300 mmol m-2 s-1 for one more week. Non-acclimated
plants remained under greenhouse growing conditions for the two week period.
Freezing Experiments
Experiment 1: Comparison of Freezing Temperatures and Acclimation Treatments.
To test the effects of cold acclimation on stolon survival, 2-month old stolons of Raleigh and
Seville were acclimated and frozen. Whole stolons (with 9 to 14 nodes) were harvested from
acclimated and non-acclimated flats of Raleigh and Seville. Roots and leaves were trimmed at
0.5 cm and 4 cm, respectively. Once trimmed, stolons were washed with cold water, rolled, and
A B
placed in a 4 cup Good Sense® circular plastic container (Chelsea Industries, Inc. Peabody, MA).
Four stolon-rolls (from same variety and acclimation treatment) were placed in each container,
which constituted an experimental unit (Fig 2). Ice shavings were added to each container to
promote nucleation and prevent supercooling. To monitor temperature, a thermocouple was
inserted in the middle of a single-node stolon and placed in the middle of the container.
Containers were randomly placed on the same shelf inside a modified commercial freezer. This
method of using whole, rolled stolons will hereon be referred to as the “rolls method”.
Figure 2. Preparation of ‘rolls’ for experiment 1.
Two modified commercial freezers were calibrated and pre-programmed to reach the
initial temperature of -1Co the night before the freezing test. The day of the test, plants were
placed in freezers and remained at -1oC for 4.5 h. Then, freezers were programmed to decrease
and -3oC for treatments 1 and 2, respectively. Once at the target temperatures, freezers
maintained them for 3 h, and then temperatures were increased to 3oC at a rate of 2oC h-1.
Once thawed, stolons were cut into single-nodes, and planted in order according to
their position (apical, mid or basal) in rows in flats filled with Fafard® 2 potting mix (Fig. 3).
Stolons were allowed to recover in the greenhouse for 30 days and rated for survival. The
experimental design was a randomized complete block design with two repetitions and a
factorial structure for treatments (two varieties x two acclimation treatments x two freezing
temperatures x three node-positions). There were four stolons within each experimental unit
and the percent survival correspond to the number of cutting that survived over the total
number of “cuttings” per node position in each stolon.
Experiment 2: Comparison of single-nodes vs. rolls method.
In this experiment, the rolls method was compared to the ‘Single-node method’
described by Li et al (2010) in order to assess whether or not stolon integrity has an effect on
freezing tolerance. Complete stolons (CS) for the rolls method were obtained as outlined for
experiment 1. Single-node stolons (SNS) were obtained from the mid-region of complete
stolons, and placed on trays as described by Li et al (2010). Acclimation treatments were
performed as outlined for experiment 1. After the acclimation period, CS were treated as in
experiment 1 while SNS were removed from trays, their roots and leaves trimmed, washed with
cold water, and placed in plastic containers with air tight lids. Ten SNS were placed in each
container. Ice shavings were added to both CS and SNS containers to promote nucleation and
prevent supercooling. Each container represented a replicate with 10 SNS for the SNS method
and with 4 rolls for the rolls method. Containers for both methods were randomized and each
replication was placed on the same shelf inside the freezer. The experimental design for the
combined analysis was a 2x2x2 (two varieties x two acclimation treatments x two freezing
methods) factorial with 4 replications. For the CS in rolls, only mid position was considered for
the combined analysis. Additionally, position effect was analyzed on the CS in rolls, following a
completely randomized experimental design with a factorial structure for treatments(two
varieties x two acclimation treatments x 3 node positions) with 4 replications. Freezers were
After thawing, SNS were transplanted in flats intact, while CS were cut into single-nodes
at three different node positions (apical, mid, basal) prior to transplantation. Both were allowed
to recover under greenhouse conditions for 30 days and then scored for survival.
Experiment 3: Comparison of different freezing temperatures.
To determine the temperature that allows a better appreciation of differences between
freeze-tolerant and freeze-sensitive cultivars, four freezing temperatures were tested: -1oC,
-2oC, -3oC and -4oC and the experiment was run twice. Plant materials were taken from trays of
Raleigh and Seville utilizing the rolls method as outlined in experiment 1. Given that each
freezing temperature was assigned to a different freezer, the experimental design used was a
mixed-nested design with 2 replicates, where the replicates were nested within each
temperature, and the factors variety and position were crossed with temperatures (4
temperatures x 2 varieties x 3 positions x 2 replicates). Plants were maintained at -1oC in the
four freezers for 4.5 h, and then the temperature was decreased to -1, -2, -3 or -4oC at a rate of
-1oC h-1. After 3 h at the target temperature, temperatures were raised to 3oC at a rate of 2oC
h-1.
The stolons were thawed, cut into single-nodes, and planted in order (from apical to
basal) in rows in flats filled with Fafard® 2 potting mix. The trays were then transferred to the
greenhouse at 25 ± 5oC where they recovered for 30 days before survival scores were taken
Experiment 4: Comparison of Freezing Methods.
The objective of this experiment was to compare different methods for assessing
freezing survival in St. Augustinegrass. Three methods were evaluated: ‘rolls’, SNS in sponges,
and SNS in conetainers (2.5 cm in diameter by 16 cm high plastic tubes with holes in the
bottom). For all three methods, plant material was obtained from non-acclimated plants of
Raleigh and Seville. Material for the roll method was prepared as outlined in experiment 1. For
the sponge method, SNS of 4 cm in length were obtained from “mother plants” and placed in a
slot cut in a moisturized sponge as described by Livingston et al (1989) and Santos et al (2006).
Sponges containing the SNS were placed in plastic bags with ice shavings. Bags were sealed with
a twist wire and inserted onto steel plumbing flanges to promote thermostability. Sponges
were placed randomly according to position on the same shelf of the freezer. For the
conetainers method, SNS were obtained as described in experiment 2. After roots and leaves
were trimmed, each SNS was planted in Fafard® 4P potting-mix in an individual conetainer
placed in a 12”x12” rack (100 conetainers per rack). For each replicate and variety 20 SNS were
obtained from 4 plants: 2 SNS from apical region, 2 SNS from mid region and 1 SNS from basal
region (5 SNS x 4 plants=20 SNS). SNS were grown under greenhouse conditions for one week
to allow root development. They were then transferred to cold chambers for acclimation in the
placing it inside a plastic bag. Ice shavings were added to the surface of each tube, and then the
bag was sealed with a twist wire and placed in the freezer.
The experimental design for analyze each method was a randomized complete block
design with four repetitions and a factorial structure (2 varieties x 2 acclimation treatments).
In the case of the rolls method, each variety was assigned to a different plastic container, with
one container (4 rolls) per replicate. For the sponge method, each sponge contained four SNS
from Raleigh and four from Seville placed alternately in the sponge. Four sponges constituted
one replicate because they came from the same tray of Raleigh and Seville (acclimated and
non-acclimated). For the conetainers method, SNS from each variety were randomly
distributed in the grid within each replicate (20 SNS per variety and acclimation treatment for
each replicate).
Due to differences in time-length to reach the freezing point, each method was assigned
to a separate freezer and maintained at -1oC for different periods of time (4.5 h for the rolls
method, 8 h for sponges, and 9h for the conetainers). After the soil/plants froze, the freezers
were programmed to go to -2oC in one hour, stay there for 3 h, and then increase to 3oC at 2oC
h-1. After thawing, SNS from the sponges were transplanted intact into flats, rolls were cut into
SNS and transplanted into flats, and SNS in conetainers, were transferred to the greenhouse
without transplanting or cutting. Both flats and conetainers were grown under greenhouse
Experiment 5: Using SNS in conetainers to compare acclimation treatments.
In order to further evaluate the use of SNS in conetainers, an experiment was designed
to compare acclimated and non-acclimated Raleigh and Seville materials. Plant material was
obtained from both cultivars, and prepared as described in experiment 4. One week after
transplanting, plants were transferred to acclimation chambers or the greenhouse depending
on the acclimation treatment assigned to each. After two weeks of acclimation, tubes were
placed in racks.
The experimental design was a 2x2x3 factorial (two genotypes x two acclimation
treatments x three node regions) with four replicates. Each experimental unit consisted of six
SNS in tubes representing each of the three regions (two apical, two mid and two basal ). All
treatments were randomized within racks (one replicate per rack). Each rack was placed in a
plastic bag, ice shavings were added to each tube, and the bag was sealed with a twist wire and
placed in a freezer at -1oC. After 9 h at -1oC, the temperature was lowered to -4oC at a rate of
-1oC h-1. After 3 h at -4oC, the temperature was increased to 3oC at 2oC h-1. Once conetainers had
thawed, racks were transferred to the greenhouse where plants were allowed to recover for 30
days before scoring them for survival.
Experiment 6: Comparison of varieties and acclimation treatments.
To evaluate the SNS in conetainers method’s ability to detect differences in freezing