Development of Jordan Elman Neural
Network for Classification of Pollen Grains
Using Histogram based Features
V. R. Dhawale, J. A. Tidke, S. V. Dudul
Asst. Professor and Head, Dept. of MCA, Vidya Bharati Mahavidyalaya, Amravati, Maharashtra, India
Professor and Head, Dept. of Botany, Sant Gadge Baba Amravati University, Amravati, Maharashtra, India
Professor and Head, Dept. of Applied Electronics, Sant Gadge Baba Amravati University, Amravati,
Maharashtra, India
ABSTRACT: A new classification algorithm is proposed for pollen grains, which play an important role in
classification of plants from pollen SEM images.The traditional method of pollen classification is tedious and needs experts from the field of palynology. As pollen grain is a complex pattern, its recognition and classification is a challenging problem and hence neural network and computational intelligence approach may be suitable.In this context, neural network and computational approach might prove more suitable.
Jordan Elman Neural Network based classifier is found to be optimal with regard to average classification accuracy on CV dataset. A novel scheme of feature extraction comprising of image histogram coefficients has been suggested. The performance of JE NN has been compared with that of MLP NN and SVM. It is shown that the proposed strategy of classification could provide an efficient alternative to the prevalent method of plant taxonomy.
KEYWORDS: Pollen SEM images, palynology, Jordan Elman, Multi-layer Perceptron, SVM, Neural Network,
Classifier.
I. INTRODUCTION
Pollen grains are widely used as a fingerprint for classification of plant species. From its very beginning, palynologists faced tremendous barriers in pollen morphological studies. Traditionally, pollen morphological characters are used for plant classification and identification of plants [1].
The shape of pollen grain is an important morphological character. The shape of pollen grain varies in different views, namely, polar view and equatorial view [10]. The outline in polar view has circular, triangular, square shaped, pentagonal, rounded or any other geometrical shape. In the present study, SEM images of pollen samples were considered prominently showinggeometrical shapes such as circular, triangular, rectangular, squared and elliptical. Due to availability of SEM high resolution digital images of sample pollen grains showing above prominent characters, they were used for classification.
The current study mainly emphasizes the improved Histogram coefficient based neural classifier and other computational intelligence techniques.The architecture of neural classifier is optimized by identifying minimum number of neurons (Processing Elements (PEs)) which reduces the time required for training the network without compromising on the classification accuracy,thusreducing the time-space complexity. For reducing the number of neurons (PEs) sensitivity analysis of the neural network is done to identify the insignificant histogram coefficients from the dataset, also, reducing the size of the dataset. The systematicneural network growing approach is employed for the selection of number of hidden layers and hidden layer PEs.In the present experimentation,the neural network architecture of JE NN (132-08-10) having 1 hidden layeryieldsclassification accuracyof 90% on CV dataset.
The image data includes ten different plant species, such as, Brassica nigra, Callistemon citrinus, Erythrinasuberosa,
A neural network performs pattern classification by first undergoing a training session, during which the network is repeatedly presented a set of input patterns along with the category to which each particular pattern belongs. Later, a new pattern is presented to the network for CV that has not been seen before, but which belongs to the same population of patterns used to train the network. The network is able to identify the class of that particular pattern because of the information it has extracted from the training data. Pattern recognition performed by a neural network is statistical in nature, with the patterns being represented by points in a multidimensional decision space. The decision space is divided into regions, each one of which is associated with a class. The decision boundaries are estimated by the training process. The construction of these boundaries is made statistical by the inherent variability that exists within and between classes.
Therefore, a computational intelligence approach comprising of image processing, statistics, neural networks, support vector machine, etc is proposed with a view to design an efficient classifier. The rest of the paper has been organized in three sections comprising of Pollen Classification, Experimental Setup, Result and Discussion.
II. RELATEDWORK
From the related work reported so far, it is observed that researchers used neural network for pollen identification
and classification. Li et al. [2, 3] identified pollen grain microstructure using neural networks. Rodriguez-Damian M. et
al.[4, 5]employed brightness and shape descriptors for pollen classification. Travieso C M. et al. [6] developed contour
feature based classification, using an HMM kernel. SVM was used as classifier in that system. P. Carrion et al. [7] had
proposed improved classification of pollen texture images using SVM and MLP. N R Nguyen et al.[8] proposed
improved pollen classification with less training effort by introducing new selection criterion to obtain the most valuable training samples. Kalvaet al. [9] used combination of neural network classifier with Naïve Bayes classifier that used features like color, shape and texture extracted from web images giving meaningful improvement in the correct image classification rate relative to the results provided by simple neural network based image classifier, which does not use contextual information.
III. POLLENCLASSIFICATION
A general flowchart of NN-based classifier is shown in the Figure1
Fig.1. Flowchart of NN based classifier
Acquisition of SEMPollenImages
Image Processing for getting ROI
Feature Extraction
Formation of knowledge-base with partitions
Design of NN based Classifier
Train/ Retrain NN on Training and Cross Validation datasets
Choose optimal combination of Transfer Function and Learning Rule
Feature Extraction
SEM images captured by Leo – 430are segmented and cropped by using image processing software in order to get the region of interest (ROI). Cropped images are stored in .jpg format. ROI is located and separated to extract features.
The main issuesencountered in the design of NN are the selection of significant inputs, number of hidden layers, number of neurons in hidden layer, choice of activation function of neurons in each layer, learning algorithm and how to optimize different NN parameters in order to create the highly accurate network. Hence, Pollen image is represented by a feature vector F; which is comprised of 128 different parameters. The dataset contains 51 instances (exemplars) for ten different plant species. It is partitioned into training and cross validation or testing dataset. The training dataset constitutes 34 exemplars and the remaining 17 exemplars are used for cross validation or testing.
The neural network based classifier is trained from the training dataset, where a feature vector is mapped onto a particular pollen class or name of plant species. The neural network learns from data (trainingexemplars) and the appropriate connection weights and biases are estimated as a result of this learning. After training of the neural network, its connection weights are frozen and latter; it is tested on a different cross-validation (CV) dataset, which was not earlier presented to the neural network. The performance of the classifier based on neural network is evaluated on the basis of some performance measures, such as, MSE, NMSE, Classification Accuracy and Confusion Matrix. In this work, the prototype model of the classifier is developed with a view to discriminate between 10 different pollen species. However, the proposed strategy can be easily modified for classification of more than 10 pollen species provided that one has enough computational resources.
The feature vector, which is to be extracted from the separated ROI of pollen image, is as follows.
F=[H128,H129,….,H146,H148,...,H181,H183,…,H192,H194,…,H199,H201,…,H213,H215,…H225,H227,…,H249,H2
51,…,H255, Average, Standard Deviation, Entropy, Contrast, Correlation, Energy, Homogeneity, Shape];
Where H128,…,H255denote the two dimensionaldiscrete Histogram domaincoefficients. The shape descriptor consists
of five different softfeatures describing shape of pollen grain such as circular, triangular, rectangular, squared and elliptical.
Image Histogram
An image histogram is a type of histogram which acts as a graphical representation of the tonal distribution in a digital image and histogram equalization (HE) is one of the common methods used for improving contrast in digital
images. The histogram (H) coefficients were obtained by Histogram Equalization, a technique that aims to maximize the
“information efficiency” of the image, in the sense that more frequent pixels should be entitled to a larger intensity range. Surprisingly, the function that does this transformation is cumulative distribution function of the image histogram. This technique is implemented for pollen SEM images, for feature extraction. Figure 7 shows SEM images of the pollen grains of 10 different plant species used to develop the proposed strategy.
Initially, 264 features were computed comprising of 256 H coefficients and 8 other image features. However,
with a view to reduce the dimensionality of the input space, a computer simulation experiment has been carried out,
where the number of H coefficients are varied from 2 to 256 in the octave, that is, 2, 4, 8, 16, 32, 64, 128 and 256. In
each case, a feature vector is generated for a pollen image and a dataset isformed. As a result of these experiments, 128 H
coefficients seem to be the most appropriate choice.
One problem that appears after feature extraction is that there are too many input features that would require significant computational efforts to calculate and may result in low classification accuracy. To confront with the issue of curse of dimensionality, sensitivity analysis is carried out so as to identify the most significantfeatures and to discard the 08insignificant features including H147, H182, H193, H200, H214, H226, H250 and H256; finally 120 H features were selected along with 8 other features.
IV. EXPERIMENTALSETUP
Histogram equalization approach is used, where a pollen SEM image is subjected to histogram equalization algorithm through MATLAB code and the results are assembled into an output image. An environment accessible from MATLAB (Mathworks Inc., USA) is used to implement the algorithm that processes the input image resulting in 2D discrete feature extraction.Neuro Solutions (NeuroDimensions, Inc. USA) 5.07 was used to implement various NN based classifiers on pollen image which is represented by a Feature Vector containing 132 different elements.
In this paper, the analysis is made by exploring three classifiers based on JE NN, MLP NN and SVM. They are compared and studied with respect to the performance measures.
A. JORDAN/ELMAN NETWORK
Jordan and Elman network extend the Multi-layer Perceptron with context units, which are processing Elements (PEs) that remember past activity. Context units provide the network with the ability to extract temporal information from the data. In the Elman network, the activities of the first hidden PEs are copied to the Context Units, while the Jordan network copies the output of the network.
Fig.2. Average of Min. MSEs in JE NN with 1 Hidden Layer
The default configuration feeds the context units with the inputs samples, providing an integrated part of the input (memory traces). A second configuration creates memory traces from the first hidden layer (as proposed by Elman). A third possibility is to use the part of the last hidden layer activations as input to the context units. The final choice is to use the past of the output layer to create the memory traces, as proposed by Jordan.
The context unit forgets the past with an exponential decay. This means that events that just happened are stronger than the ones that have occurred further in the past. The context unit controls the forgetting factor through the time constant. Useful values are between 0 and 1. A value of 1 is useless in the sense that all of the past factored in. On the other extreme, a value of zero means that only the present time is factored in (i.e. there is no self-recurrent connection). The closer the value is to 1, the longer the memory depth and the slower the forgetting factor. The transfer functions of the context units are linear and nonlinear context units and linear and nonlinear integrators. The integrators are the same as context units except that they normalize the input based on the time constant.
The number of PEs in the context layer is defined by the number of PEs in the layer that feeds the context layer (i.e. the network will assign one context unit per input connection). As with the other neural models, the number of hidden layers must be defined.
0 0.05 0.1 0.15 0.2
2 3 4 5 6 7 8 9 10 11
A
v
era
g
e
o
f
M
in
M
S
E
s
Hidden 1 PEs
JE NN: Average of Minimum MSEs with Standard Deviation Boundaries
Training
+ 1 Standard Deviation
- 1 Standard Deviation
Cross Validation
+ 1 Standard Deviation
- 1 Standard Deviation
TableI. Numberof PEs in JE NN for HL#1
Best Networks Training Cross Validation
Hidden 1 PEs 7 8
Minimum MSE 0.0019832 0.0696559
Fig. 3. Architecture of JE NN #1 Hidden Layer
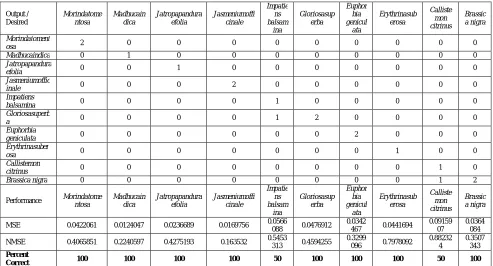
Table II. Confusion Matrix and Performance Measures of JE NN Based Classifier on CV Dataset
Output / Desired Morindatome ntosa Madhucain dica Jatropapandura efolia Jasmeniumoffi cinale Impatie ns balsam ina Gloriosasup erba Euphor bia genicul ata Erythrinasub erosa Calliste mon citrinus Brassic a nigra Morindatoment
osa 2 0 0 0 0 0 0 0 0 0
Madhucaindica 0 1 0 0 0 0 0 0 0 0
Jatropapandura
efolia 0 0 1 0 0 0 0 0 0 0
Jasmeniumoffic
inale 0 0 0 2 0 0 0 0 0 0
Impatiens
balsamina 0 0 0 0 1 0 0 0 0 0
Gloriosasuperb
a 0 0 0 0 1 2 0 0 0 0
Euphorbia
geniculata 0 0 0 0 0 0 2 0 0 0
Erythrinasuber
osa 0 0 0 0 0 0 0 1 0 0
Callistemon
citrinus 0 0 0 0 0 0 0 0 1 0
Brassica nigra 0 0 0 0 0 0 0 0 1 2
Performance Morindatome
ntosa Madhucain dica Jatropapandura efolia Jasmeniumoffi cinale Impatie ns balsam ina Gloriosasup erba Euphor bia genicul ata Erythrinasub erosa Calliste mon citrinus Brassic a nigra
MSE 0.0422061 0.0124047 0.0236689 0.0169756 0.0566
088 0.0476912
0.0342
467 0.0441694
0.09159 07
0.0364 084
NMSE 0.4065851 0.2240597 0.4275193 0.163532 0.5453
313 0.4594255
0.3299
096 0.7978092
0.88232 4
0.3507 343 Percent
Correct 100 100 100 100 50 100 100 100 50 100
Various combinations of Transfer Functions and Learning rules were tested for which the performance analysis is shown in Table III. The choice of transfer function in this case should be “Tanh” in hidden as well as output layer. Average Minimum MSE on training and CV dataset is compared in this table.
Table III. Variation of Transfer Function of PEs
JE NN Avg. Min MSE Avg CA
TrnfrFunct Train CV Train CV
Tanh 0.021070615 0.040597048 94 90
LinTanh 0.038999049 0.070995422 55.83 55
B. MULTILAYER PERCEPTRON (MLP) NN
For the selection of hidden layer PEs, network growing approach is employed. Initially,a single hidden layer is introduced in the neural network with only one neuron (processing element) in it. The number of neurons in the input layer will be 128, because, there are 120 different real numeric-valued input features, seven image statistics based parameters and one symbolic shape descriptor feature represented by five bit binary amounting to 132. Similarly, number of neurons in the output layer will be ten corresponding to ten different plant species. Gradually, number of PEs in the first hidden layer is increased from 1 to 20 in the increment of one. A neural network is created and retrained five times with different random initialization of connection weights and biases. This random initialization ensures true learning and proper generalization. This also alleviates the affinity of neural network towards the initialization of connection weights.
Fig.4.Architecture of MLP NN #1 Hidden Layer
Fig.5. Average of Min. MSEs in MLP NN with 1 Hidden Layer
Fromthe experimentation as shown in Figure5, it is noticed that, the number of PEs in the first hidden layer should be 10; hence selected parameters for designing optimum MLP NN classifier are given below:
No. of inputs= 132, No. of hidden layers = 01, No. of output PEs = 10, No. of exemplars = 34, Input layer = Axon, Thus the architecture of the proposed MLP NN is (Input Layer PEs) – (Hidden Layer #1 PEs) – (Output Layer PEs), i.e. 132-10-10.
0 0.02 0.04 0.06 0.08 0.1 0.12 0.14 0.16 0.18
1 2 3 4 5 6 7 8 9 1011121314151617181920
A
v
er
ag
e
o
f
M
in
M
S
E
s
Hidden 1 PEs
MLP NN: Average of Minimum MSEs with Standard Deviation Boundaries
Cross Validation
+ 1 Standard Deviation
- 1 Standard Deviation
Table IV. Number of PEs in MLP NN for HL#1
Best Networks Training Cross Validation
Hidden 1 PEs 16 10
Minimum MSE 0.0025 0.0627
Table V. Confusion Matrix and Performance Measures of MLP #1HL based Classifier on Cross Validation Dataset
C. SUPPORT VECTOR MACHINE (SVM)
The Support Vector Machine (SVM) is implemented using the Kernel Adatron algorithm, which maps inputs to a high-dimensional feature space, and then optimally separates data into their respective classes by isolating those inputs which fall close to the data boundaries. Therefore, it is especially effective in separating sets of data which share complex decision boundaries. Figure 6 shows the graph of average Mean Squared Error (MSE) in Training and Cross Validation dataset.
Fig.6.Average MSE in Training and CV dataset
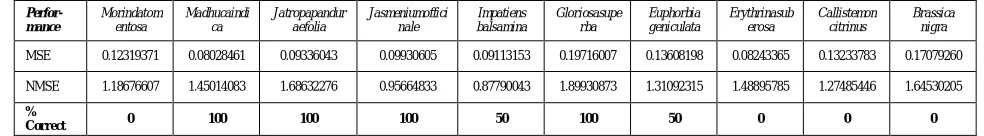
Table VI: Performance Measures of SVMbased Classifier on Cross Validation Dataset
Perfor-mance
Morindatom entosa
Madhucaindi ca
Jatropapandur aefolia
Jasmeniumoffici nale
Impatiens balsamina
Gloriosasupe rba
Euphorbia geniculata
Erythrinasub erosa
Callistemon citrinus
Brassica nigra
MSE 0.12319371 0.08028461 0.09336043 0.09930605 0.09113153 0.19716007 0.13608198 0.08243365 0.13233783 0.17079260
NMSE 1.18676607 1.45014083 1.68632276 0.95664833 0.87790043 1.89930873 1.31092315 1.48895785 1.27485446 1.64530205
%
Correct 0 100 100 100 50 100 50 0 0 0
0 0.1 0.2 0.3 0.4 0.5 0.6
1 500 999 14981997249629953494399344924991
A
v
era
g
e
M
S
E
Epoch
SVM: Average MSE with Standard Deviation Boundaries for 5 Runs
Training
+ 1 Standard Deviation
- 1 Standard Deviation
Cross Validation
+ 1 Standard Deviation
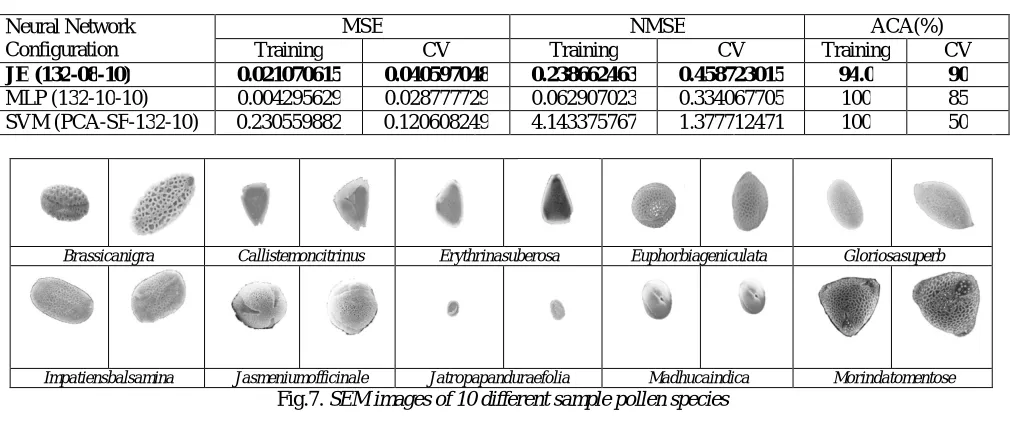
Table VII. Performance Comparison of MLP NN, JE NNandSVM Networks
Brassicanigra Callistemoncitrinus Erythrinasuberosa Euphorbiageniculata Gloriosasuperb
Impatiensbalsamina Jasmeniumofficinale Jatropapanduraefolia Madhucaindica Morindatomentose
Fig.7. SEM images of 10 different sample pollen species
V. RESULT AND DISCUSSION
Figure8 shows, a typical scatter plot drawn in the input features space and it has been noticed that there exists overlapping of features among different plant species because of the nonlinear and complex nature of decision boundaries required to be estimated for separating out different species. Thus, estimation of such complex decision boundaries for accurate classification of pollen grains is indeed a challenging task.
Fig. 8. Scatter Plot of Image Feature Vs Energy
It is observed that the proposed improved pollen classification approach based on computational intelligence works very well. From the analysis of the performance obtained byJE NN classifiers shown in Table VII, it is learned that the Maximum Classification Accuracy of JE NN (90%) is superior to that of MLP NN and SVM classifier. The classification accuracy of JE NN is 90%, which is found to be reasonable and consistent with regard to rigorous testing on training and cross-validation dataset. The simulation results show that computational complexity is reduced in the proposed classifier by using lesser neurons and parameters in the feature dataset
The proposed approach is effective, stable and reliable for training a classifier with large number of pollen samples. It is seen that the JE NN architecture 132-08-10 clearly outperforms the other classifiers, based on results of pollen image classification accuracy.
0.2 0.3 0.4 0.5 0.6 0.7 0.8 0.9 1
0 0.1 0.2 0.3 0.4 0.5 0.6 0.7
E
n
er
g
y
F248
Euphorbia geniculata
Gloriosa superba
Jasmenium officinale
brassica nigra
callistemon citrinus
erythrina suberosa
impatiens balsamiana
jatropa panduraefolia
madhuca indica
Morinda tomentosa
Neural Network Configuration
MSE NMSE ACA(%)
Training CV Training CV Training CV
JE (132-08-10) 0.021070615 0.040597048 0.238662463 0.458723015 94.0 90
MLP (132-10-10) 0.004295629 0.028777729 0.062907023 0.334067705 100 85
ACKNOWLEDGMENT
The principal author records special thanks to his research colleague, Dr. Ajay Rajurkar from SGBAU University Department of Botany for the help in getting pollen SEM images.
REFERENCES
[1] S.N. Agashe, Palynology and its applications. Pp. 16-48, 2006.
[2] P. Li and J.R. Flenley, Pollen texture identification using neural networks. Grana, pp. 59-64, 1999.
[3] P. Li, W.J. Treloar, J.R. Flenley, L.Empson, Towards automation of palynology 2: the use of texture measures and neural network analysis for automated identification of optical images of pollen grains, Journal of Quaternary Science, vol.19, issue 8, pp.755 – 762, Dec.2004. [4] M. Rodriguez-Damian, E. Cernada, A. Formella, R. Sa-Otero,Pollen Classification using brightness-based and shape-based descriptors.
Proceedings of the 17th International Conference on Pattern Recognition ICPR, vol.2, Aug.2004, pp.212-215.
[5] Rodriguez-Damian M., Cernadas E., Formella A., Gonzalez A, Automatic Identification and Classification of Pollen of “The Urticaceae Family”, Proceedings of Acivs (Advance Concepts for Intelligent Vision Systems), Ghent, Belgium, Sept.2-5, 2003.
[6] TraviesoC.M., Bnceno, J.C., Ticay-Rivas, J.R., Alonso, J. B., “Pollen classification based on contour features”, 15th International Conference on Intelligent Engineering Systems (INES), Jun 2011, pp.17-21.
[7] P. Carrion, E. Cernadas, P. Sa-Otero, and E. Diaz-Losada, Improved classification of pollen texture images using SVM and MLP.
[8] N. R. Nguyen, M. Donalson-Matasci, M.C.Shin, Improving pollen classification with less training effort, IEEE Workshop on Applications of Computer Vision (WACV), Tampa, FL, 2013, pp.421 – 426.
[9] P. R. Kalva, F. Curitiba Enembreck, A.L. Koerich, Web Image Classification using Classifier Combination. IEEE Latin America Transactions, vol.6, Issue 7, Dec. 2008, pp. 661 – 671.
[10] M.I. Hidalgo and M.L. Bootello, About physical characteristics of the pollen loads collected by Apismellifera L. Apicoltura, 6:179-191, 1990.
[11] V.R. Dhawale, J.A. Tidke, S.V. Dudul, Neural Network Based Classification of Pollen Grains. IEEEPublicationonInternational Conference on Advances in Computing, Communications and Informatics (ICACCI), 2013, pp.79-84.
[12] Sa´-Otero, M. P. de, Gonza´ lez, A. P., Rodrı´guez-Damia´n, M. andCernadas, E, Computer-aided identification of allergenic species of Urticaceae pollen. – Grana 43: 224–230. ISSN 0017-3134, 2004.
[13] C. Cortes and V. Vapnik, Support Vector Networks. Machine Learning, (20): 273-297, 1995.
[14] M. Langford, G.E. Taylor, J.R.Flenley, Computerized identification of pollen grains by texture analysis, Elsevier B.V. Review of Palaeobotony and Palynology, vol. 64, Issues 1-4, pp. 197-203, Oct.1990
[15] K. Holt, G. Allen, R. Hodgson, S. Marsland, J. Flenley, Progress towards an automated trainable pollen location and classifier system for use in the palynology laboratory. Review of Palaeobotany and Palynology, Vol. 167, Issues 3-4, pp. 175-183, Oct. 2011.
BIOGRAPHY
V.R. Dhawaleis Assistant Professor and Head, Department of MCA, Vidya Bharati Mahavidyalaya, Amravati,
Maharashtra. He received Doctorate degree in 2015 from SGBAU, Amravati, MS, India. His research interests are Computational Intelligence, Artificial Intelligence, and Algorithms etc.
J.A. Tidke (Former-Pro-Vice Chancellor, SGBAU,Amravati) is a Professor and Head, Department of Botany, Sant Gadge Baba Amravati University, Amravati, Maharashtra. He received Doctorate degree in 1999 from SGBAU, Amravati, MS, India. He has done Post-doctoral Fellowship at Laboratory of Pollination Ecology, Institute of Evolution, Haifa University, Haifa (Israel). His research interests are Aeropalynological studies and Paleobotany, etc.
S.V. Dudulisa Professor and Head, Department of Applied Electronics, Sant Gadge Baba Amravati University,