University of Windsor University of Windsor
Scholarship at UWindsor
Scholarship at UWindsor
Electronic Theses and Dissertations Theses, Dissertations, and Major Papers
5-11-2018
High Resolution Imaging and Digital Characterization of Skin
High Resolution Imaging and Digital Characterization of Skin
Pathology By Scanning Acoustic Microscopy
Pathology By Scanning Acoustic Microscopy
Sarah Youssef University of Windsor
Follow this and additional works at: https://scholar.uwindsor.ca/etd
Recommended Citation Recommended Citation
Youssef, Sarah, "High Resolution Imaging and Digital Characterization of Skin Pathology By Scanning Acoustic Microscopy" (2018). Electronic Theses and Dissertations. 7439.
https://scholar.uwindsor.ca/etd/7439
This online database contains the full-text of PhD dissertations and Masters’ theses of University of Windsor students from 1954 forward. These documents are made available for personal study and research purposes only, in accordance with the Canadian Copyright Act and the Creative Commons license—CC BY-NC-ND (Attribution, Non-Commercial, No Derivative Works). Under this license, works must always be attributed to the copyright holder (original author), cannot be used for any commercial purposes, and may not be altered. Any other use would require the permission of the copyright holder. Students may inquire about withdrawing their dissertation and/or thesis from this database. For additional inquiries, please contact the repository administrator via email
High-Resolution Imaging and Digital
Characterization of Skin Pathology
by Scanning Acoustic Microscopy
By
Sarah Youssef
A Thesis
Submitted to the Faculty of Graduate Studies
through the Department of Physics
in Partial Fulfillment of the Requirements for
the Degree of Master of Science
at the University of Windsor
Windsor, Ontario, Canada
2018
High Resolution Imaging and Digital Characterization of Skin Pathology by Scanning Acoustic Microscopy
by
Sarah Youssef
APPROVED BY:
______________________________________________ A. Hubberstey
Department of Biological Sciences
______________________________________________ W. Kedzierski
Department of Physics
______________________________________________ R. Maev, Advisor
Department of Physics
iii
DECLARATION OF ORIGINALITY
I hereby certify that I am the sole author of this thesis and that no part of this thesis
has been published or submitted for publication.
I certify that, to the best of my knowledge, my thesis does not infringe upon anyone’s
copyright nor violate any proprietary rights and that any ideas, techniques,
quotations, or any other material from the work of other people included in my
thesis, published or otherwise, are fully acknowledged in accordance with the
standard referencing practices. Furthermore, to the extent that I have included
copyrighted material that surpasses the bounds of fair dealing within the meaning of
the Canada Copyright Act, I certify that I have obtained a written permission from
the copyright owner(s) to include such material(s) in my thesis and have included
copies of such copyright clearances to my appendix.
I declare that this is a true copy of my thesis, including any final revisions, as
approved by my thesis committee and the Graduate Studies office, and that this
thesis has not been submitted for a higher degree to any other University or
iv ABSTRACT
Skin cancer represents the most common worldwide malignancy with a widely
varying prognosis. Most of the diagnostic tools used for skin imaging are still
limited to provide a definite diagnosis of skin cancer, especially melanoma. Easy
access to the skin to biopsy and excision made skin underexplored using ultrasonic
diagnostic imaging. Given the fact that speed of sound and acoustic impedance are
related to elastic modulus, quantitative acoustic microscopy shows great potential as
a useful tool for skin cancer diagnosis. The high-frequency acoustic microscopy
method was used to evaluate properties of the cancer lesions for melanoma, basal
cell carcinoma, and squamous cell carcinoma. The algorithm for quantitative
characterization of individual cells in the histological slices has been developed. All
cancer cells regardless of the cancer type have lower sound speed comparing to
healthy skin cells. The melanoma cells have the lowest values of sound speed (1360
± 50 m/s) comparing to basal cell carcinoma and squamous cell carcinoma. It was
demonstrated on thickly cut skin specimens that melanoma lesions have lower
acoustic impedance compared to healthy skin. These findings may become the basis
for a new ultrasonic method for melanoma diagnosis or for margin status verification
during the surgery helting to reduce the mortality rate from melanoma and improve
v
vi
ACKNOWLEDGEMENTS
First and foremost, I would like to mention my gratitude to my parents for always
being with me and supporting my efforts. They have raised me in an environment
where human values are the most promoted. I was proudly inspired by their
sacrifices through life for both my siblings and I. Especially my mother who is
always praising me and making me feel more confident with my accomplishments
by keeping me in her prayers.
I would like to express the deepest appreciation to my supervisor Dr. Roman Gr.
Maev, who believes in my academic skills and provides me with the wisdom to
improve my academic and career life. Without his spirit of adventure in regards to
research, his excessive support, kind words, and sweet smiles, this thesis would not
be achieved.
To my exceptional mentor Dr. Ina Seviaryna, thank you for your extreme effort with
me and your hard work on trying to make every single aspect able to work. Her
motivation motivated me to get involved in multiple projects and get wide
experience within short time. One of the unforgettable experiences that I have gained
from her is to learn how to deal perfectly with the acoustic microscope. For instance,
she tried her best to get the samples from the hospital in order to examine and
evaluate them.
I would also like to thank Dr. David Shum for preparing samples with their
vii
cancer diagnoses is really appreciated since it helps me to understand acoustic image
features.
I would like to thank my committee members, Dr. Wladyslaw Kedzierski and Dr.
AndrewHubberstey for sparing time and putting effort to evaluate my work. Their
comments and inputs ultimately help to increase the clarity of the thesis.
Last but not least, I would like to express thanks to all members of the Physics
Department for their valuable advices and assistance throughout my graduate
studies, especially to Dr. Steven Rehse and Mrs. Kimberly Lefebvre. I would like to
extend my gratitude to Sarah Beneteau for her support especially in my last toughest
viii TABLE OF CONTENTS
DECLARATION OF ORIGINALITY ... iii
ABSTRACT ... iv
ACKNOWLEDGEMENTS ... vi
LIST OF TABLES ... xi
LIST OF FIGURES ... xii
LIST OF ABBREVIATIONS ... xvi
LIST OF SYMBOLS ... xviii
CHAPTER 1 INTRODUCTION: SKIN STRUCTURE AND SKIN CANCER ... 1
1.1 Structure and Function of the Skin ... 1
1.2 Skin Cancer ... 3
1.2.1 Basal Cell Carcinoma ... 3
1.2.2 Squamous Cell Carcinoma ... 4
1.2.3 Melanoma ... 4
1.3 Clinical Diagnosis of Skin Cancer ... 5
1.3.1 Visual Inspection ... 5
1.3.2 Biopsy for Diagnosis Confirmation ... 6
1.3.3 Dermoscopy ... 6
1.4 Goals and Structure of the Thesis ... 7
CHAPTER 2 LITERATURE REVIEW: SKIN IMAGING METHODS ... 9
2.1 Non-Invasive Skin Imaging Methods ... 9
2.1.1 Ultrasonography ... 9
2.1.2 Optical Coherence Tomography ... 11
2.1.3 Confocal Microscopy ... 13
2.1.4 Magnetic Resonance Imaging ... 14
ix
2.2 Scanning Acoustic Microscopy ... 16
2.2.1 Biological Applications and Tissue Characterization ... 17
CHAPTER 3 SCANNING ACOUSTIC MICROSCOPE ... 20
3.1 Imaging Principle ... 20
3.2 General Description of Acoustic Lens ... 22
3.2.1 Design of the Transducer ... 22
3.2.2 Beam Pattern for a Focused Transducer ... 23
3.2.3. Resolution ... 25
3.3 Data Acquisition and Quantitative analysis ... 26
3.3.1 Speed of Sound Algorithm ... 26
3.3.2 Acoustic Impedance Algorithm ... 32
CHAPTER 4 MATERIALS AND METHODS ... 37
4.1 Honda Scanning Acoustic Microscope ... 37
4.2 High-Frequency Imaging Experimental Setup ... 39
4.2.1 320 MHz Transducer ... 40
4.2.2 Histological Thin Skin Samples ... 42
4.3 Low-Frequency Imaging Experimental Setup ... 44
4.3.1 50 MHz Transducer ... 45
4.3.2 Thickly Sliced Skin ... 46
CHAPTER 5 EXPERIMENTAL RESULTS AND DISCUSSION ... 48
5.1 Evaluation of Speed of Sound and Attenuation of Skin Histological Slices ... 48
5.1.1 Healthy Skin... 48
5.1.2 Squamous Cell Carcinoma ... 51
5.1.3 Basal Cell Carcinoma ... 54
5.1.4 Melanoma ... 58
5.1.5 Discussion of Sound Speed and Attenuation Data ... 61
5.2 Evaluation of the Acoustic Impedance of Human Skin ... 66
5.2.1 Estimating AI of Skin from Experimental SOS Values ... 66
5.2.2 Acoustic Impedance Measurements on Thickly Sliced Skin ... 67
5.2.3 Surface Treatment of Polystyrene Substrate ... 69
x
CHAPTER 6 CONCLUSIONS AND RECOMMENDATIONS ... 74
BIBLIOGRAPHY ... 77
xi LIST OF TABLES
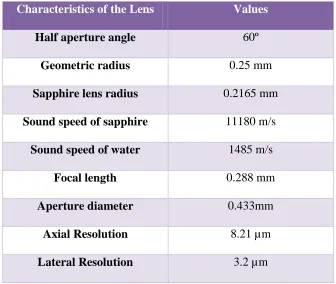
Table 4.1: Characteristics of the sapphire lens at 320 MHz. ... 42
Table 4.2: Deparaffinization protocol [88]. ... 43
Table 4.3: Characteristics of 50 MHz Transducer. ... 46
Table 5.1: Average SOS and AOS for main layers of healthy skin. ... 51
Table 5.2: Acoustic properties of healthy skin structures and skin cancers. .. 62
Table 5.3: Acoustic impedance estimation for healthy skin and melanoma skin cancer. ... 66
Table 5.4: The acoustic impedance of healthy skin measured with the untreated PS. ... 68
xii LIST OF FIGURES
Figure 1.1: Anatomy of the skin showing main layers with their essential
constituents [2]. ... 2
Figure 3.1: Schematic illustration of two modes of the scanning acoustic
microscope. Left: sound speed mode, right: acoustic impedance mode [98]. .. 21
Figure 3.2: Design of PVDF transducer (A) and buffer rod transducer (B). R is
the radius of curvature of the lens. ... 23
Figure 3.3: Schematic representation of the beam pattern formation for the
transducer-lens system [99]. R is the radius of curvature of the lens surface,
and h is the edge thickness of the lens. ... 24
Figure 3.4: Reflection pattern in sound pressure. ... 25
Figure 3.5: Resolution of the focused single element transducer [33]. ... 26
Figure 3.6: Illustration of the signal reflection in sound speed mode. c0, c and
Sref are the sound speed in water and tissue, and the reference signal
respectively. Ss and Sd are the signals from the front and rear surface of the
specimen, and d is the thickness of the specimen. ... 27
Figure 3.7: Illustration of waveforms from the glass substrate and specimen
respectively in time - domain. ... 27
Figure 3.8: Frequency domain analysis of the interfered waveform [103]. ... 28
Figure 3.9: Representation of the signal reflection in AI mode assuming vertical
xiii
Figure 3.10: Illustration of reflected waveforms from the reference and the
target respectively in time- domain [107]. ... 34
Figure 3.11: Frequency domain analysis of the target and reference signals
[107]. ... 35
Figure 4.1: Block diagram of the biological acoustic microscope system, Honda
Electronics Co. Ltd. [109]. ... 37
Figure 4.2: Detailed diagram of the 320 MHz transducer. ... 41
Figure 4.3: Histological skin samples, paraffinized (left) and deparaffinized
(right). ... 44
Figure 4.4: Holder chamber used for a fixed tissue for acoustic impedance
imaging. ... 45
Figure 4.5: Formalin fixed thick skin tissue. ... 47
Figure 5.1: The acoustic image of healthy skin tissue (right) and its
corresponding light microscopic image with H&E staining (left). E: epidermis,
PD: papillary dermis, RD: reticular dermis. The black rectangle indicates
papillary dermis region. ... 49
Figure 5.2: Images of sound speed (SOS) and attenuation of sound (AOS) in
healthy skin referred to the Figure 5.1... 50
Figure 5.3: Acoustic intensity image of healthy skin with a scan area of 0.6×0.6
mm2 by 500×500 pixels. SC: stratum corneum, SG: stratum granulosum, SS:
xiv
Figure 5.4: Comparison of acoustic image of well- differentiated squamous cell
carcinoma (right) with its corresponding H&E image (left). KP: keratinous
pearls, AC: abnormal squamous cells cluster, HF: Hair follicle. ... 52
Figure 5.5: Abnormal squamous cells cluster (AC) with keratin formation at
higher magnification. ... 52
Figure 5.6: Acoustic images of the squamous cell carcinoma: the active
carcinoma cells (left column) and the keratinized region (right column).
Intensity (A, D), sound speed (B, E) and attenuation (C, F). Yellow arrow:
squamous cell carcinoma. Green arrow: desmoplastic stroma. Red arrow:
keratin formation. KP: keratinous pearls. ... 53
Figure 5.7: Basal cell carcinoma. H&E image (left) and the acoustic image of
the same area (right). BC: basaloid cell, G: sebaceous glands... 55
Figure 5.8: Acoustic images (A, D), sound speed (B, E) and attenuation (C, F)
of basal cell carcinoma. Yellow arrow: basal cell carcinoma. Black arrow:
epidermal dysplasia. Green arrow: elastotic sun damaged collagen fibres. E:
epidermis, PD: papillary dermis, RD: reticular dermis. BC: basaloid cell, G:
sebaceous glands... 56
Figure 5.9: Palisading arrangement of cancer cells at the periphery of tumor.
... 57
Figure 5.10: Comparison of acoustic image of malignant melanoma (right) with
its corresponding H&E image (left). ... 58
Figure 5.11: High-resolution acoustic image (B) of nodular malignant
xv
(A) represents the corresponding optical and its higher magnified image (C).
Red arrow: tumour cells. Black arrow: follicular squamous cells. Green arrow:
stroma... 60
Figure 5.12: The plot representing ultrasonic properties of the healthy and skin
cancer structures. SCC: squamous cell carcinoma, BCC: basal cell carcinoma,
Normal E, PD, RD: normal epidermis, papillary dermis, reticular dermis
respectively. ... 63
Figure 5.13: Intensity image (left) and the acoustic impedance distribution
(right) of healthy skin made with PS substrate. ... 67
Figure 5.14: Acoustic image (left) and the acoustic impedance distribution
(right) of melanoma lesion. The red box with a field of view 2.4×2.4 mm2 marks
the melanoma tumour region where the measurement is acquired. ... 68
Figure 5.15: Intensity image (left) and the acoustic impedance distribution
(right) of healthy skin made with plasma treated PS substrate... 70
Figure 5.16: Measured and estimated acoustic impedance of the healthy and
melanoma skin. E: epidermis, PD: papillary dermis, RD: reticular dermis, PS:
xvi
LIST OF ABBREVIATIONS
ABCDE Asymmetry, Border, Colour, Diameter, Evolving
AM 50SI Acoustic Microscope 50SI
AOS Attenuation of Sound
AI Acoustic Impedance
AC Abnormal Squamous Cells
BCC Basal Cell Carcinoma
BC Basaloid Cell
B to Z Brightness to Acoustic Impedance
BCC Basal Cell Carcinoma
CM Confocal Microscopy
CLSM Confocal Laser Scanning Microscopy
dB Decibel
E Epidermis
HF Hair Follicle
H&E Hematoxylin and Eosin
HFUS High-Frequency Ultrasound
KP Keratinous Pearl
MRI Magnetic Imaging Resonance
MM Malignant Melanoma
NMSC Non-Melanoma Skin Cancer
OCT Optical Coherence Tomography
xvii
PS Polystyrene
PBS Phosphate-Buffered Saline
PD Papillary Dermis
P Papillae
RI Refractive Index
ROI Region of Interest
REB Research Ethics Board
RCM Reflectance Confocal Microscopy
RD Reticular Dermis
T1 Spin-Lattice Relaxation Time
T2 Spin-Spin Relaxation Time
SAM Scanning Acoustic Microscope
SC Stratum Corneum
SG Stratum Granulosum
SS Stratum Spinosum
SB Stratum Basale
SCC Sqaumous Cell Cracinoma
SOS Speed of Sound
SD Standard Deviation
3D Three-dimensional
US Ultrasonography
WRH Windsor Regional Hospital
xviii LIST OF SYMBOLS
𝛿𝑎𝑥𝑖𝑎𝑙 Axial Resolution [m]
L Amplitude of the reflected wave [dB]
Z Acoustic impedance [Rayl]
𝛼 Absorption coefficient [dB/m]
K Bulk modulus [Pa]
𝜌 Density [kg/m3]
D Diameter Aperture [m]
z Distance from the transducer [m]
h Edge thickness of the lens [m]
E Elastic modulus [Pa]
𝑓0 Focal length [m]
F F-number of the lens
𝑓 Frequency [Hz]
𝜃 Half aperture angle
N Length of Fresnel region [m]
𝛿𝑙𝑎𝑡𝑒𝑟𝑎𝑙 Lateral Resolution [m]
n Non-negative integer
𝜎 Poisson ratio
𝜙 Phase angle [degrees]
R Radius of curvature [m]
r Radius of the lens [m]
xix
c Speed of sound [m/s]
A Slope of attenuation [dB/m. Hz]
S Signal amplitude [dB]
G Shear modulus [Pa]
P Sound power [W]
𝜂𝑠 Shear viscosity [Pa.s]
𝑣𝑠 Sound velocity in Buffer Rod [m/s]
𝛿 Thickness of the crystal [m]
d Thickness of the tissue [m]
𝜂𝑣 Volumetric viscosity [Pa.s]
𝜆 Wavelength [m]
1
CHAPTER 1
INTRODUCTION: SKIN STRUCTURE AND SKIN CANCER
1.1 Structure and Function of the Skin
Human skin is the largest organ in the body, accounting for approximately 16% of total
bodyweight [1]. It has many functions. One of the most important is to protect the body
from external aggressions (injuries, infections, ultraviolet radiation and water loss). It is a
highly organized complex tissue composed of several distinct layers and components. The
three primary layers are the epidermis, the dermis, and the hypodermis.
The superficial layer, the epidermis, is a stratified squamous epithelium layer consists of
four types of cells. The predominant type is the keratinocytes (95%) [2] which are formed
by the division of cells in the basal layer of the epidermis. They produce keratins that are
the major structural proteins of the outer layer of the epidermis known as stratum corneum
or horny layer. Deep in the epidermis are cells called melanocytes. Melanocytes make
melanin pigment source for skin and hair colour.
Below the epidermis is the dense fibroelastic connective tissue layer, the dermis. It is
mainly made of collagen and elastin fibres which exhibits the viscoelasticity behaviour of
the skin. These proteins are synthesized by fibroblasts cells that formed the most numerous
dermal cells. Also, it contains blood and lymph vessels, nerve endings and skin appendages
such as hair follicles, sebaceous and sweat glands. Its vital role is to provide energy and
nutrition to the epidermis and to regulate the temperature of the body. The dermis
comprises of two sub-layers, the papillary dermis (thin layer) and the reticular dermis (thick
2
The third layer is the hypodermis, called as well subcutaneous fat, lies immediately under
the dermis layer. It contains loose fatty connective tissue, and it is used mainly for fat
storage. Thus, adipocyte cells represent a large number of cells in the hypodermis.
There are two main kinds of human skin, glabrous skin, and hairy skin. The first is found
on the palms and soles with a relatively thick epidermis and lack of hair follicles. However,
hair follicles are present in the hairy skin.
3
1.2 Skin Cancer
Skin cancer is a group of cancers with increasing incidence rate that appears predominantly
in Caucasian and elder people yielding to increase the incidence of mortality and
therapeutic expenses as a burden to the health-care system [3]. The most common
malignant skin tumours are composed of two categories: malignant melanoma (MM) and
non-melanoma skin cancer (NMSC) with different diagnostic types. In this study, we will
consider keratinocyte types of non-melanoma skin cancers, basal cell carcinoma and
squamous cell carcinoma, as they relate to 99% of skin cancer cases [4], [5] along with
cutaneous melanoma as it relates to 90% of deaths associated with skin cancer [6].
1.2.1 Basal Cell Carcinoma
Basal cell carcinoma (BCC) is the large common skin cancer type. It starts to develop in
the basal cells of the epidermis at the basement membrane and proliferates into atypical
basal keratinocytes known as basaloid cells [4]. They are typically surrounded by collagen
fibres. Nevertheless, at progressive cancer stage, stroma in the dermis is reduced (about
30%) with the enlargement in size and number of tumour nests [7], [8]. These cancer
clusters present various histological types of BCC depending on the different configuration
of atypical cells. In the present study, superficial BCC was considered that is characterized
by spreading of peripheral palisaded basaloid cells in the nest all over the epidermis with
well-defined border [4].
BCC is typically diagnosed during a clinical examination with subsequent confirmation of
the diagnosis by histopathological analysis. In spite of its low mortality rate, BCC can
cause metastasis if kept untreated for a long-time and mainly if the first treatment was
4
surgical excision of a tumour with a large margin for advanced stage or by cryotherapy or
laser therapy for superficial BCC [7], [9] .
1.2.2 Squamous Cell Carcinoma
Squamous cell carcinoma (SCC) is malignant cutaneous tumour that can metastases and
cause death. Meanwhile, BCC could be invasive with normally not metastasizing while
melanoma has a unique ability to metastasize very fast comparing to SCC [10]. The
invasive type of SCC discussed in this study forms 20% of all skin malignancies [4], [11].
However, many different types of SCC exist and ranging from low to more aggressive
attitude.
Usually, SCC originates from in situ neoplasms such as actinic keratosis, and Bowen’s
disease where it is characterized by the proliferation of squamous keratinizing cells through
the epidermis and its appendages. For more invasive growth, these non-pigmented atypical
cells infiltrate into the dermis as tumour clusters from further mutation. The tumour clusters
are surrounded by reduced stroma with lymphocytes and are transformed later to keratinous
pearls for the well-differentiated SCC type. Despite of that, keratinization is not always
apparent what may leads to misdiagnosis of SCC with melanoma. Similarly to BCC, sun
and ultraviolet light exposure are significant risk factors for SCC and particularly in the
elderly population [12]. Also, SCC can develops from irradiated or inflamed skin [11].
1.2.3 Melanoma
Cutaneous malignant melanoma (MM) is the less frequent skin cancer that constitutes
about 2% of cases [13]. However, it causes the vast majority of deaths comparing to
5
It can vastly invade in the lymph node and over the body through the lymphatic and blood
vessels [16] . It has the highest ability to be cured at an early stage that increases the five
year survival rate to 95% [6]. Nevertheless, the early prognosis of MM is poor and presents
clinical defiance for dermatologists because of the same features are seen in melanoma and
in dysplastic or melanocytic nevi.
There are many subtypes of melanoma, but we focus on malignant melanoma in our study.
Melanoma cells begin at the basal layer in the melanocytes that produce melanin. Those
atypical melanocytes proliferate irregularly either as a single cell or as clusters along the
epidermal-dermal junction and invade into the dermis with a different shape. Also, they
can form a “Pagetoid” spread into the epidermis [17]. Environmental risk factors are
related to the previous history of melanoma, and multiple moles in the body are associated
with developing MM. Other factors are the ultraviolet and chemical exposure and from
scars also [15].
1.3 Clinical Diagnosis of Skin Cancer
1.3.1 Visual Inspection
The primary skin assessment typically occurs at the primary points of care with the visual
inspection as the most common type of evaluation.Although it is frequently used, naked
eye examination poses some challenges in prognosis to differentiate between benign and
malignant lesion [13]. Therefore, traditional biopsy or excision is required to confirm the
diagnosis [6], [16]. The histopathology procedure increases the diagnosis as it provides a
6
1.3.2 Biopsy for Diagnosis Confirmation
Two types of biopsy are used depending on tumour size and treatment method. An
incisional biopsy where a small piece of a tumour is cut out surgically by incision, punch
or shave issued when the diagnosis is not certain. Otherwise, an entire removal of the lesion
and some healthy tissue around it is carried out and is known as an excisional biopsy,
followed by a preoperative assessment of the maximum tumour thickness measured with a
micrometer on the histology slide [18]. Sometimes, the tumour shows many recurrent
lesions and demands repetitive biopsy that could be limited by health conditions of the
patient or by the lesion position.
Recently, Mohs surgery is suggested as a treatment for BCC and SCC clinically where the
surgeons cut out a thin layer of a tumour with a surgical knife through local anesthesia and
examine the tumour layer under a microscope during the surgery. This operation is repeated
until no more cancer cells are seen in the removed tissue. The advantageous of this
technique over the standard excision is the ability to save as much normal skin as possible
around the lesion especially in the aesthetically and functionally critical sites (ear, face,
feet, and finger). However, all these conventional methods for diagnosis are slow to
process, required many hours to be completed, expensive, and present many risks for
patients such as pain, infection, bleeding and medical care after surgery [2], [11], [19],
[20].
1.3.3 Dermoscopy
A non-invasive technique called dermoscopy is used to enhance lesion visualization under
the skin surface by combining oil immersion and light magnifying device and to prevent
7
[20]–[22]. Nonetheless, dermoscopic images are still limited to use by skin artifacts (hair,
oil bubbles, and skin structures) that create a disparate light. Also, the method requires
additional training for the clinician [23], [24].
For melanoma diagnosis, ABCDE rule or 7-point checklist or Menzie rule is adopted by
physicians. The ABCDE criteria of dermoscopy are mostly used in clinical practice as the
simplest one where it is based on the Asymmetry, Border irregularity, Colour variegation,
Diameter> 6mm and Evolving of the lesion [2], [13], [16], [17], [24].
The clinical appearance of SCC using dermoscopy can be detected with different
diagnostic features such as white structures and circles, glomerular vessels that help to
recognize this type of cancer. However, for invasive SCC non-keratotic type, different
biological markers are used to avoid false negative diagnosis with BCC and to see tumour
extension [11], [20].
1.4 Goals and Structure of the Thesis
The majority of skin cancer are underestimated that causes severe morbidity and increases
in mortality rate [25]. Clinical assessment of the lesion by visual inspection is often not
enough, and biopsy stays the standard diagnostic reference for diagnosis confirmation.
Therefore, a diagnostic technology to support clinician’s decision could potentially
increase the accuracy and lower morbidity and mortality associated with MM.
Though the ultrasound is used for estimation of the tumour thickness of the primary
melanoma, the diagnostic potential of the conventional ultrasound to identify specific skin
pathologies is rather limited. Easy access to the skin for biopsy and excision made skin
underexplored using ultrasonic diagnostic imaging. At the same time, numerical
8
have distinct elastic properties compared to benign lesions and healthy skin. As the speed
of sound and acoustic impedance measured by the acoustic microscopy are the indirect
measurements of the elastic modulus, it is worthwhile to explore if the high-resolution
acoustic microscopy has the potential for identifying and classifying skin cancers.
This study aims: 1) to provide a methodology for high-resolution imaging of human skin
using an acoustic microscopy method and to find a correlation of the ultrasonic images
with traditional stained optical images, 2) quantitatively characterize acoustic properties of
cancer neoplasms emphasizing significant features for diagnostics in daily practice.
The thesis is divided into six chapters. Chapter 1 describes the structure of skin and outline
the major skin cancer types. Chapter 2 presents a complete literature review of the
non-invasive skin imaging techniques and the proposed scanning acoustic microscope method.
Chapter 3 offers the principle of scanning acoustic microscope, general description of the
acoustic lens and the theory behind acoustic properties calculation. Chapter 4 illustrates the
experimental setup and materials used. Chapter 5 displays the results and the analysis of
acoustic properties of melanoma and non-melanoma comparing to normal and
9
CHAPTER 2
LITERATURE REVIEW: SKIN IMAGING METHODS
2.1 Non-Invasive Skin Imaging Methods
Many non-invasive skin imaging methods have been created in order to examine tissue in
its native state in order to avoid biological biopsies and related timely preparation work.
Thus, many selected skin sites will be monitored over time to visualize various skin lesion
structures and their changes due to ageing and/or medication treatment. These modalities
comprise ultrasonography, optical coherence tomography, confocal microscopy, and
magnetic resonance imaging.
2.1.1 Ultrasonography
Ultrasonography (US) is an acoustic technique used to image vertical sections in the tissue.
A gray scale image is obtained from the reflection of sound waves and depends on the
difference in acoustic impedance and, therefore, on the acoustic properties of the tissue
[26].
Conventional ultrasonic devices with a frequency ranging from 7.5 up to 15 MHz are used
for measuring skin tumour thickness in clinical practice before the surgical excision as it
appears hypoechogenic. However, in some cases, it’s hard to determine the margins when
the tumour exceeds the dermal layer and invades the subcutis that looks hypoechoic too
[18], [27].
B-mode scanners with 20 MHz transducers are used in real-time mode to identify all skin
layer morphology and cutaneous lesions. They can penetrate to a depth of 3.8 mm into the
10
respectively. In skin cancer, especially melanoma, the thickness is a prognostic factor for
dermatologists. Several former studies for evaluation of skin lesions at this frequency (20
MHz) have shown that the thickness of melanocytic skin tumour (> 1mm) strongly agrees
with histologic thickness while for thin (<1mm), it is considered overestimated comparing
to Breslow thickness. The inflammatory infiltrate around the tumour is one of the causes
that lead to overestimation [6], [18], [27]–[30]. This issue can be resolved by using higher
frequency probes which have a higher resolution, although the resolution is inversely
related to penetration depth.
It has been demonstrated that thickness of melanocytic and non-melanocytic skin cancer
measured with 100-MHz US provide better correlation with histologic measurements than
20-MHz US with an axial and lateral resolution of 9.9 µm and 84 µm respectively [31]–
[33]. High- frequency ultrasound (HFUS) can discriminate between basal cell carcinoma
as it appears non-homogeneous with low defined pattern and melanoma where it shows
homogeneous hypoechoic echo with well-delimited pattern [26], [27], [31], [34]–[37].
Also, BCC and SCC were able to be distinguished with HFUS by the presence of
hyperechoic spots in the first carcinoma [26], [38]. However, HFUS is limited in the
epidermis and upper dermis layers of the skin with a penetration depth of 1.1 mm but it is
insufficient for thicker tumours [32]. New ultrasonic devices were combined with Doppler
to increase the sensitivity to differentiate between melanoma and benign pigmented lesions
by evaluation of tumour vascularization [18], [26].
In skin imaging, variations of ultrasonic reflections depend on tissue composition (keratin,
11
Many quantitative ultrasonic methods were developed to provide additional information
related to skin composition and intrinsically to visco-elastic characteristics since
conventional ultrasound image is restricted [6], [8], [13], [24], [28], [39]–[42]. Among all
acoustic parameters, frequency-dependent attenuation and backscatter coefficients are
discriminating factors for specific tumour types [43]. Malignant melanoma is more
attenuated than melanocytic nevi [6]. Also, highly keratotic cancer (BCC, SCC) is
attenuated stronger than normal [40].
Also, for 20 to 30 MHz US, the speed of sound, attenuation and backscatter coefficients
were calculated for epidermis and dermis layer of healthy human skin [40]. Ultrasound
velocity rises with more collagen or keratin and decreases with more water content. A study
on melanoma tissue demonstrates that sound speed is lower compared to human skin and
ranging from 1553-1588 m/s [28].
Some works currently have shown the use of ultrasound elastography as a method to
characterize skin cancers especially cutaneous melanoma, indicating that the melanoma
lesion is stiffer than the surrounding tissue [44]. Malignant neoplasms offers very low
elasticity comparing to benign lesions [38]. While HFUS is used to evaluate skin cancer
especially malignant melanoma and BCC, it cannot provide cellular resolution, and
therefore it cannot be used alone to confirm the diagnosis. Nevertheless, this is a safe,
non-radioactive and non-expensive technique comparing to CM, MRI, and OCT.
2.1.2 Optical Coherence Tomography
Optical coherence tomography (OCT) is an interferometry method that provides lateral
scanning high resolution two-dimensional cross-sectional images of the internal
12
light in the human skin is focused on the superficial skin layers, backscattered and
recombined with the reflected reference signal from the scanning mirror. Coherent
interference occurs only if the path length of both beams agree within the short coherence
length of the light source. Therefore, the resolution of OCT system is determined by the
coherence length and the power of the light source used, the focal spot size of the lens and
the step width[45], [46]. It is mainly based on the emission of near-infrared light in the
wavelength range from 700 nm to approximately 1300 nm where the absorption and
scattering into the tissue are relatively low, especially in the human skin that is considered
as a non-transparent and high scattering medium. So that light penetrates deep into the skin
in the order of 1- 2 mm yielding to an axial and lateral resolution of approximately 15 µm
much higher than that of 20 MHz transducers [47], [48]. Hence, at that detection depth
only superficial layers of the skin could be visualized, and thus epidermal thickness could
be measured easily. Also, in cross-sectional images, the dermo-epidermal junction in the
skin could be sharply demarcated as well as adnexal structures and blood vessels. However,
conventional OCT is not able to detect cellular details since multiple light scattering and a
coherence length larger than most cell diameters [47], [49]–[52].
For thin NMSC, OCT could evaluate the tumour thickness that correlates well with
histology thickness in all cases, especially for BCC [31]. Nevertheless, it is still less
accurate than clinical diagnosis, and it is hard to differentiate between a benign and
malignant tumour as well as cancer margins could not be delineated by OCT [20], [46],
13
2.1.3 Confocal Microscopy
Real-time confocal microscopy (CM) is an optical imaging technique with high
determination and contrast that shows horizontal planes of the skin surface without
physically dissecting the tissue, to obtain the so-called ‘optical sectioning’. Thus, a 3-D
profile can be reconstructed by scanning and combining sequentially many confocal planes
at different depths in the skin where it becomes comparable to the reconstruction of
magnetic resonance and computed tomography images. This imaging technique is based
on the emission of incoming light from a point source aperture or laser pulse that is focused
by an objective lens in order to irradiate a small volume inside the tissue. The light from
the illuminated spot is reflected back to the same objective and split from the excitatory
light by a dichroic mirror. Unlike the conventional light microscopy, the resulting or
fluorescent light is detected by a detector through a pinhole that operates as a spatial filter
where only the light signal from the focal point is registered [55]–[58]. The quality of the
confocal image is not only marked by resolution but also by contrast. So, signal contrast
originates from the difference of the refractive index (RI) of various cell types and the size
of organelles. In skin imaging, a strong signal is gathered specifically from keratin,
melanin, and collagen that render a light contrast [56], [57], [59]. A remarkable advance in
the optimization of the illumination and detection system of the CM is generated in order
to improve confocal microscopy images quality of the human skin and to reduce scanning
time. Therefore, the most useful and beneficial clinical one is confocal laser scanning
microscopy (CLSM) that presents a high lightening power and a specific wavelength
selectivity [57], [59]. With this method, the nuclear and cellular morphology of the human
14
structures of the entire epidermis and part of the dermis can be clearly identified [60]. It
shows dermal papillae, collagen fibres and blood cells flowing through the capillary loops
of the papillary dermis as well as sweat ducts, sebaceous glands and hair follicles [56],
[58], [59]. Also, the thicknesses of the different epidermal layers and the sizes of the
cellular nuclei can be obtained. For melanocytic skin tumours imaging, CLSM can
discriminates malignant melanoma from benign through the identification of
morphological changes features that come to an accurate presurgical diagnosis and to
determine their margins before biopsy [61]–[63]. For the diagnosis of BCC, a study has
evaluated the clinical applicability of reflectance confocal microscopy (RCM) with high
sensitivity. Limitations include the failure to visualize the depth invasion of skin tumours
on horizontal sections and inability to evaluate lesions with significant hyperkeratosis.
Nonetheless, the assessment of confocal images imposed a high training level and
experience of the dermatologists and examining physician [56]. Another limitation, the
expensive cost of CM and the inability to assess hyperkeratosis lesions [64]. Moreover, the
vertical invasion of the lesion deeply into the skin cannot be evaluated reliably as CM
detects horizontal section only in contrast to OCT, MRI and US technique [58][65].
2.1.4 Magnetic Resonance Imaging
Magnetic resonance imaging (MRI) is a technique that presents cross-sectional imaging
analogous to optical and ultrasound techniques and reflects the bulk magnetic properties of
the tissue by the use of radiowaves. The magnetic resonance image is obtained from the
transition energy of atoms to their ground state and acquired by a surface receiver coil,
15
In dermatology, 1.5 T MRI allowed the visualization of healthy skin structure and
differentiate between skin layers in function of water contrast [66]–[68]. Different
parameters such as T1 and T2 relaxation times, density of protons, gradient and spin echoes
are evaluated by high resolution MRI technique for diagnosis of skin abnormalities that
correlate well with histological findings. Therefore, for skin carcinomas (BCC and SCC),
it provides information about the tumour morphology as well as it determines the margin
and the depth of the tumour [20], [69], [70].
Other studies shows that it could be used for in-vivo to evaluate different melanoma types
and detect metastasis stage in relation to the surrounding structures [67], [70], [71]. In
contrast to ultrasound imaging, MRI potentially localized inflammatory infiltration into the
dermis [68]. Although some studies shows the advantageous of MRI to assess tumor
invasions equally to clinical findings, the diagnostic role is still limited comparing to CM,
US, and OCT in addition to its very high cost.
2.1.5 Comparison of Skin Imaging Methods
While non-invasive imaging techniques may aid dermatologist in the diagnosis of
melanoma and non-melanoma skin cancer, they pose several limitations. OCT, HFUS, and
MRI lack the resolution to detect early stage skin cancers especially melanoma whereas
RCM is not able to image in depth, therefore invasive SCC and other cancers cannot be
detected. For that reason, there is still need for other imaging techniques providing high
resolution for diagnosis of different skin cancers at the cellular level and help to select the
16
2.2 Scanning Acoustic Microscopy
The scanning acoustic microscopy (SAM) is a method that utilizes high-frequency focused
sound waves to image an object and investigate its elastic properties. The sound wave is
emitted from a transducer and focused at a small point on a target object. The sound is
transmitted and reflected at the coupling/tissue interface and scattered and absorbed inside
the tissue. The reflected signal is received by the transducer and analyzed. The transducer
is moved along the sample to create the image. The contrast of the image is based on the
specimen’s stiffness, viscosity, morphology and geometry. This method permits the
imaging not only the surface but also the internal structure of tissues. At the operating
frequency in the range of several GHz, it has a sub-micron resolution comparable to an
optical microscope [72]. Although the higher frequency provides higher spatial resolution
image, the depth of visualization and signal level in this case dramatically reduced due to
sound attenuation.
Lemons and Quate for the first time demonstrated in 1974 working acoustic microscope in
the transmission mode and used it for biomedical applications [73]. This acoustic
microscopy method was later extended theoretically and experimentally by observing
various biological tissues by Maev et al. [74] as well as other research groups. However,
the transmission acoustic microscopy poses some limitations such as the thickness of the
specimen where it is placed between the two acoustic lenses (one for emitting and another
for receiving the ultrasound) and some technical difficulties compared to the reflection
mode [75]. Thus, the reflection scanning acoustic microscopy, where one acoustic lens has
been utilized as a transmitter and a receiver, becomes accepted and widespread for its
17
2.2.1 Biological Applications and Tissue Characterization
The basic design of scanning acoustic microscope remains the same for years, while its
practical realization has been improved in a wide variety of devices produced by
commercial companies and developed in research laboratories. They are mainly used in
two areas: industrial quality control and for biomedical applications [76]–[79]. The use of
acoustic microscopy in medicine and biology has three main advantages. First, it can
visualize with high-resolution tissues and cells in natural condition without the need for
staining and fixation process. Second, it can successfully characterize micromechanical
properties of biological objects by measuring the acoustic properties such as speed of
sound, attenuation, and backscattering coefficient. Third, intensity images and echographic
images were analogous for clinical ultrasound imaging study.
Since many physiological changes in tissues during diseases result in the modification in
its characteristics, including elastic properties, detecting variations in these properties can
provide insight into tissue’s physiological state. Therefore, an acoustic microscope could
be a powerful tool for differential medical diagnosis of diverse types of cancer. Liver
carcinoma, gastric cancer, lesions of lymph nodes, breast and renal cancer were actively
investigated by many research and groups [72], [77], [78], [80], [81]. It was discovered
that tumour tissues exhibit distinct velocity and attenuation values comparing to healthy
tissues, in spite of that the magnitude and indication of these pathological modification
change for a various tumour. While cancer cells themselves show a decrease in sound speed
and attenuation, the averaged values of these parameters for a tumour can be higher than
the surrounding healthy tissue. This effect can be explained by the dynamic inclusion of
18
approximately higher than 300 MHz, individual cells can be resolved while at a frequency
ranging from 1-1.5 GHz detailed information about their internal structure becomes
apparent [83], [85], [74]. Many research groups has used acoustic microscopy for the
observation of living or cultured cells in order to measure mechanical properties of the cells
and derived elastic parameters of subcellular structures (Hela cell, leukemia, glial and
glioma cells and others) [43], [74], [86], [87]. For instance, it was found that cancer cells
(glioma cells) are less stiff than glial (normal cells) and that is related to less existence of
cytoskeleton material around the nucleus in the tumour cells [87]. This result is proved by
other studies on breast cancer cells that indicates low acoustic impedance and therefore
lower stiffness than healthy cells [83].
Human skin is the largest organ that carries significant biomechanical functions and has a
complex microstructure. The acoustic microscopy was used to investigate normal,
melanoma skin cancer, wounded skin , inflammatory processes, regenerated skin, burn
scars, and photodamaged skin [79], [88]–[92]. In-vivo studies of human skin done by
Hozumi et al. using 100 and 120 MHz transducers, show the ability of acoustic microscopy
to visualize microvessels, hair follicles and sebaceous glands at up to 1.2 mm depth.as echo
poor density area in the 3D model. Skin morphology with all layers was also clearly
visualized by this system. This 3D method is more advantageous than OCT and 20 MHz
US. OCT cannot go deeper than approximately 600 µm in the skin and 20 MHz cannot
visualize fine structures (hair follicles, microvessels, and sebaceous glands), respectively
[93]–[95].
An ex-vivo study using SAM with 600 MHz demonstrates the ability to see individual cells
19
especially determining components of the inflammatory cell, and therefore early stage of
the lesion cannot be identified. In this study, the diagnosis was limited with acoustic images
without quantifying acoustic properties of individual cells that are related to its
visco-elastic behaviour and thus SAM was not able to provide a definite diagnosis [96]. A recent
study at 400 MHz has studied thin melanoma and differentiate between abnormal and
normal based on tissue morphology and measured values of ultrasound velocities. In the
same study, thick melanoma was evaluated by 50 MHz transducer and shows very high
attenuation comparing to healthy tissue.
To the best of our knowledge, very few quantitative studies have reported ultrasonic
imaging of different types of skin cancer (BCC, SCC, and melanoma) at ultra- high
frequency (>300 MHz) measuring acoustic properties of individual cells, and therefore
evaluating its elastic behaviour. Also, no study has been done before that calculates the
20
CHAPTER 3
SCANNING ACOUSTIC MICROSCOPE
3.1 Imaging Principle
An overall review of acoustic microscopy principle is given in Brigg’s book [97]. Here, we
briefly describe the imaging technique that will be utilized in the present study. The
operation of Honda SAM is based on a pulse-echo mode where the same transducer is used
for transmission and reception of ultrasonic waves. This setup allows accomplishing
frequency-domain analysis of the pulse resulting in a quantitative measurement or
characterization of the reflection by power spectrum analysis.
An ultrasonic pulse wave is produced by the vibration of a piezoelectric transducer and
transmitted to biological tissues through a coupling medium, i.e. deionized water.
Biological tissues have an acoustic impedance close to that of water, and practically no
contrast caused by the mismatch in reflection coefficient are displayed. Primarily, the
contrast in the acoustic images is produced from the difference in attenuation across the
tissues. For that reason, it is essential for the sample to be mounted onto substrates
composed of highly reflective materials. The emitted sound wave is focused on a specific
region of the target and is reflected from the interface between the substrate and the target.
The focusing procedure was performed by moving the acoustic lens along its Z-axis
towards the sample. The maximum amplitude of the reflected signal obtained during this
motion means that reflecting surface is located precisely at the focal distance. The reflected
ultrasonic beam is returned to the transducer and is converted into an electric signal. To
21
the gate system is registered and represented as the brightness of the corresponding pixel.
The scanning along sample surface (X- and Y- axis) allows to sequentially pass all pixels
within square scanning area and to create corresponding two dimensional image (C-scan).
Figure 3.1: Schematic illustration of two modes of the scanning acoustic microscope. Left: sound speed mode, right: acoustic impedance mode [98].
The Honda microscope can operate in two modes of visualization: sound speed and
acoustic impedance. The imaging mechanisms for both modes will be described
underneath.
Figure 3.1 shows the schematic illustration of the beam propagation in the tissue for these
operation modes. The left drawing displays the speed of sound mode used for accurate
imaging when an ultrasonic wave propagates through the thinly sliced specimen
(approximately about 10 µm of thickness) that is in direct contact with the transducer
through the coupling medium. The ultrasonic wave reflects back at the interface between
the sample and the glass. The right figure illustrates the impedance mode where the
specimen is covered by the thin plastic plate, and the beam reflected from the plastic/tissue
22
special preparation. The positioning of the substrate (plastic plate) between the transducer
and the sample prevents contamination of the equipment. This is a significant advantage
allowing to examine fresh or fresh-frozen tissues.
3.2 General Description of Acoustic Lens
The acoustical lens that emits and focus the sound wave is vital element of the acoustic
microscope. Focusing diminishes the lateral dimension of the beam in the focal point which
dramatically improves lateral resolution. Accordingly, the intensity will be higher at the
focal zone, and the signal to noise ratio will increase as well [99].
3.2.1 Design of the Transducer
The core of acoustic lens is a piezoelement-layer of material exhibit change in the thickness
in response for the applied electrical field. It converts the electrical signal into pressure
waves and vice versa. Longitudinal waves are produced from the oscillations of the crystal.
The most effective excitation happens at the resonant frequency (f) when its thickness 𝛿 is
half the wavelength. Thus, f is given by this equation [99]:
𝑓 =𝐶2𝛿𝑇 (1)
Where 𝑐𝑇 is the sound speed of the crystal.
In a frequency range 30-100 MHz, the most convenient material for piezoelement is
polyvinylidene fluoride (PVDF) - a soft plastic which is produced in the form of thin film
and can be formed into necessary shape. Acoustical lens usually contains PVDF film on
the surface of spherical cavity directly in contact with a coupling liquid (Figure 3.2 A). The
backing material, in this case, should have high attenuation in order to absorb all the
23
For higher frequencies (above 100 MHz), the thickness of piesoelement becomes too small,
and it is fabricated by vacuum deposition of piezoelectric material (usually ZnO) at the flat
surface of hard buffer (fused quartz or sapphire). Sound wave is emitted into buffer volume,
passes the buffer length and transmits into coupling liquid. The opposite surface of the
buffer has a spherical cavity, creating a focusing lens (Figure 3.2 B) [100].
Figure 3.2: Design of PVDF transducer (A) and buffer rod transducer (B). R is the radius of curvature of the lens.
3.2.2 Beam Pattern for a Focused Transducer
The sound field of the transducer for focused and unfocused cases is presented in Figure
3.3. Theoretical description of this field is simplified for two regions which are Fresnel and
24
Figure 3.3: Schematic representation of the beam pattern formation for the transducer-lens system [99]. R is the radius of curvature of the lens surface, and h is
the edge thickness of the lens.
The near-field is the region that comes up directly in front of the acoustic transducer. The
length of the Fresnel region (N) is defined by the wavelength at certain frequency (f) in the
medium and by the diameter aperture (D). The corresponding expression will be given by
[99]:
𝑁 =𝐷4 𝑐2𝑓=𝐷4𝜆2 (2)
For our particular high-frequency transducer 320 MHz with diameter 0.433mm we can
estimate distance of near field equal 9.7 mm. As the focal distance for this transducer is 0.3
mm, we always working deep in near field area.
The Fraunhofer region is the area where the whole transducer can be considered as a point
source. Here, the beam diverges, and the sound field pressure gradually decreases ~ 1 𝑧⁄ 2
25
Figure 3.4: Reflection pattern in sound pressure.
Resolution- Along x: 1um/pt and along z: 2um/pt [thanks to Dr. Hozumi].
3.2.3. Resolution
The lateral resolution 𝛿𝑙𝑎𝑡𝑒𝑟𝑎𝑙 of the transducer is determined by the diameter of the focal
spot. This diameter is limited by diffraction phenomena and at level -3 dB this theoretical
limit equal:
𝛿𝑙𝑎𝑡𝑒𝑟𝑎𝑙 = 1.03𝜆𝑓𝐷0 (3)
Where 𝐹 = 𝑓𝐷0 is called F-number, characteristic of the lens.
The axial size of the focal point is referred as the depth of the field 𝛿𝑎𝑥𝑖𝑎𝑙 and can be
calculated by the equation [101]:
𝛿𝑎𝑥𝑖𝑎𝑙 = 4𝜆 𝑓0 2
𝐷2 (4)
Where 𝑓0 is the focal length of the lens.
26
Figure 3.5: Resolution of the focused single element transducer [33].
3.3 Data Acquisition and Quantitative analysis
3.3.1 Speed of Sound Algorithm
In the speed of sound (SOS) mode AM 50SI acoustic microscope calculates the speed of
sound in the thinly sliced sample. The pulses reflected from the front (𝑆𝑠) and from the
back (𝑆𝑑) sides are overlapping as shown in Figure 3.6. This fact makes standard methods
– measuring the time of flight- inapplicable [102].The analysis of the interfered wave (𝑆𝑠+
𝑆𝑑) by Fourier transform the time domain into frequency domain calculate the intensity
and phase spectra that are normalized by the reference waveform (𝑆𝑟𝑒𝑓). In the
frequency-domain analysis, the sound speed is calculated at the maximum and minimum frequency
27
Figure 3.6: Illustration of the signal reflection in sound speed mode. c0, c and Sref are
the sound speed in water and tissue, and the reference signal respectively. Ss and Sd are
the signals from the front and rear surface of the specimen, and d is the thickness of the specimen.
3.3.1.1 Frequency Domain Analysis for Sound Speed
28
The example of the reflected waveforms is seen in Figure 3.7. Part (a) shows the reflection
from the glass surface without the tissue. This signal was used as a reference waveform,
and the point being defined as the reference point. Part (b) is the waveform from the tissue
area that includes two components cannot be separated in time- domain. So, we can switch
into frequency-domain and consider interference between the two reflections. Intensity and
phase spectra were calculated by Fourier Transform. The position of the maximum and
minimum points at these diagrams are key parameters. However, they cannot be precisely
determined without the normalization of the intensity and phase spectra by the reference
signal as given in Figure 3.8.
Figure 3.8: Frequency domain analysis of the interfered waveform [103].
29
The 𝑓𝑚𝑖𝑛is the minimum frequency in the normalized intensity spectrum with ∅𝑚𝑖𝑛the
corresponding phase angle as expressed in the graph above. The phase difference between
the two reflections at the minimum point is (2𝑛 − 1)𝜋 that refers to a destructive
interference yields to:
2𝜋𝑓𝑚𝑖𝑛 ×2𝑑𝑐
0 = ∅𝑚𝑖𝑛+ (2𝑛 − 1)𝜋 (5)
Where d, c0, and n are the tissue thickness, sound speed in water, and a non-negative
integer, respectively.
Assuming now 𝑓𝑚𝑎𝑥 is the maximum frequency in the intensity spectrum and ∅𝑚𝑎𝑥 as the
corresponding phase angle, the phase difference at the maximum point is 2𝑛𝜋 for a
constructive interference giving:
2𝜋𝑓𝑚𝑎𝑥 ×2𝑑𝑐
0 = ∅𝑚𝑎𝑥 + 2𝑛𝜋 (6)
Then, the phase angles ∅𝑚𝑖𝑛𝑎𝑛𝑑 ∅𝑚𝑎𝑥 can be expressed as follows by:
2𝜋𝑓𝑚𝑖𝑛× 2𝑑 (1 𝑐0−
1
𝑐) = ∅𝑚𝑖𝑛 (7)
2𝜋𝑓𝑚𝑎𝑥 × 2𝑑 (𝑐1
0−
1
𝑐) = ∅𝑚𝑎𝑥 (8)
Where c is the speed of sound in the sample.
Since ∅𝑚𝑖𝑛 𝑎𝑛𝑑 ∅𝑚𝑎𝑥 is the phase difference between the wave that passed a distance 2d
in the tissue with a sound speed c and the wave that passed in water through the
corresponding distance with sound speed c0. By solving the simultaneous equations of (5)
and (7), the thickness value at the minimum point is given by:
𝑑 =4𝜋𝑓𝑐0
𝑚𝑖𝑛{∅𝑚𝑖𝑛+ (2𝑛 − 1)𝜋} (9)
30 𝑐 = (𝑐1
0−
∅𝑚𝑖𝑛 4𝜋𝑓𝑚𝑖𝑛𝑑)
−1
(10)
For the maximum point, by resolving (6) and (8) yields to:
𝑑 =4𝜋𝑓𝑐0
𝑚𝑎𝑥{∅𝑚𝑎𝑥 + 2𝑛𝜋} (11)
Thence, the sound speed at this frequency will be given as [103]:
𝑐 = (𝑐1
0−
∅𝑚𝑎𝑥 4𝜋𝑓𝑚𝑎𝑥𝑑)
−1
(12)
The slope of attenuation is subsequently obtained from the thickness (9) and the amplitude
(15) equations at the minimum points as:
𝐴 =𝑓 𝐿
𝑚𝑖𝑛 𝑑=
𝐿 𝑓𝑚𝑖𝑛(
𝑐0
4𝜋𝑓𝑚𝑖𝑛{∅𝑚𝑖𝑛+ (2𝑛 − 1)𝜋}) −1
(13)
And at the maximum points form equations (11) and (15), the slope of attenuation will
be: 𝐴 =𝑓 𝐿 𝑚𝑎𝑥 𝑑= 𝐿 𝑓𝑚𝑎𝑥( 𝑐0
4𝜋𝑓𝑚𝑎𝑥{∅𝑚𝑎𝑥 + 2𝑛𝜋}) −1
(14)
Where
𝐿 = −10 𝑙𝑜𝑔 (𝑃𝑃 0)
2
(15)
is the amplitude of the reflected wave [76]. P is the sound power of reflection from the
tissue and P0 is the sound power of reflection from the glass [104].
3.3.1.2 Viscosity and Elasticity Estimation
The longitudinal wave velocity resulting from the frequency-dependent characteristics of
31
𝑐 = √(𝐾+4𝐺 3𝜌 ⁄ ) (16)
Where 𝐾 is the elastic bulk modulus, G is the shear modulus, and 𝜌 is the density of the
sample.
In human tissues, shear modulus is much smaller comparing to the bulk modulus and
therefore cam be neglected. Thus, the relation between the sound speed and the bulk
modulus for the liquid-like material will be simplified in the form below:
𝑐 = √𝐾𝜌 (17)
On the other hand, the tissue’s bulk modulus 𝐾 could be expressed in function of the elastic
modulus E (Young’s modulus) by:
𝐾 =(1+𝜎)(1−2𝜎)(1−𝜎) 𝐸 (18)
Where 𝜎 is the material Poisson’s ratio [105]. Poisson’s ratio is considered to be equal
approximately 0.5 in human soft tissues that corresponds to incompressibility condition
[106].
Attenuation of sound is an important parameter that contributes to the contrast in an
acoustic image. In the skin tissue, the viscosity is one of the main factors responsible for
the attenuation of sound. For soft materials, the viscosity is given by the absorption
coefficient as:
𝛼 =2𝑓 2𝜋2
3𝜌𝑐2 (𝜂𝑣 + 4
32
Where 𝜂𝑣 is the volumetric viscosity and 𝜂𝑠 is the shear viscosity [98].
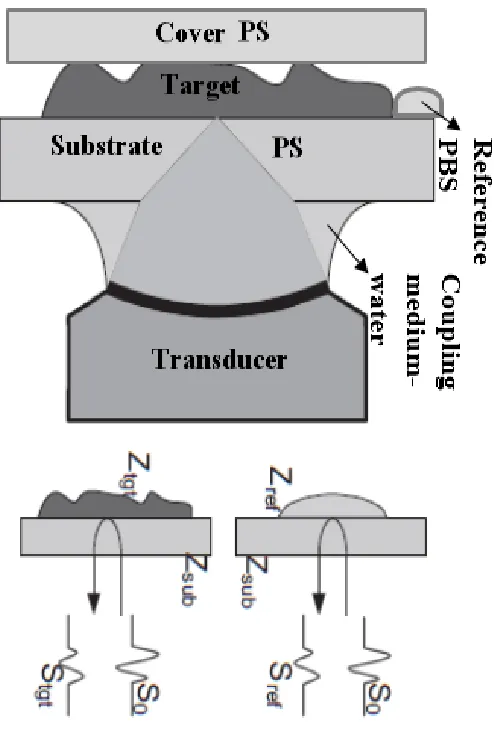
3.3.2 Acoustic Impedance Algorithm
The acoustic impedance (AI) was calculated for the thickly cut skin specimens examined
in the acoustic impedance mode. For acoustic impedance determination, vertical incidence
analysis of the returned waves from the target and the reference material was applied to
obtain the acoustic intensity waveforms from a small angle of the focused transducer.
These two reflections may be seen in the same field of view; however, if this is unrealistic,
they may be observed independently under similar conditions, as shown in figure 3.9. The
system is calibrated prior to the observation by a reference signal from the substrate
material only without the tissue. The reflections from the reference substance (Sref) and the
tissue (Stgt) were compared and explicated into the characteristic acoustic impedance (Ztgt)
by a numerical analysis of the sound field in the frequency domain using Fourier Transform
33
34
3.3.2.1 Frequency Domain Analysis for Acoustic Impedance
Figure 3.10: Illustration of reflected waveforms from the reference and the target respectively in time- domain [107].
The upper waveform on the Figure 3.10 shows the reflected response from the plastic
substrate with phosphate buffer solution present and reflected waveform from the cross-
section of the skin tissue in the time domain. The reflected waveform from the skin is very
similar but slightly smaller to that reference waveform. One can conclude that skin tissue
has the acoustic impedance similar to PBS solution. Frequency domain analysis of these
![Figure 1.1: Anatomy of the skin showing main layers with their essential constituents [2]](https://thumb-us.123doks.com/thumbv2/123dok_us/1366381.1169400/22.612.113.538.252.567/figure-anatomy-skin-showing-main-layers-essential-constituents.webp)

![Figure 3.3: Schematic representation of the beam pattern formation for the transducer-lens system [99]](https://thumb-us.123doks.com/thumbv2/123dok_us/1366381.1169400/44.612.120.508.82.273/figure-schematic-representation-beam-pattern-formation-transducer-lens.webp)
![Figure 3.8: Frequency domain analysis of the interfered waveform [103].](https://thumb-us.123doks.com/thumbv2/123dok_us/1366381.1169400/48.612.168.451.336.590/figure-frequency-domain-analysis-interfered-waveform.webp)
![Figure 3.10: Illustration of reflected waveforms from the reference and the target respectively in time- domain [107]](https://thumb-us.123doks.com/thumbv2/123dok_us/1366381.1169400/54.612.185.493.110.346/figure-illustration-reflected-waveforms-reference-target-respectively-domain.webp)
![Figure 3.11: Frequency domain analysis of the target and reference signals [107].](https://thumb-us.123doks.com/thumbv2/123dok_us/1366381.1169400/55.612.202.478.96.345/figure-frequency-domain-analysis-target-reference-signals.webp)