Division VIII
Development of the Eddy Current Array Probe to evaluate the integrity
of the Steam Generator tubes
Dong-Hyun Jee1, Chan-Hee Cho2, Tae-Hun Lee3
1 Principal Research Engineer, Central Research Institute, KHNP, Korea 2 Chief Research Engineer, Central Research Institute, KHNP, Korea 3 Senior Research Engineer, Central Research Institute, KHNP, Korea
1. INTRODUCTION
The steam generator (SG) in nuclear power plants has several thousands of Inconel tubes with about 1mm thickness which make a pressure boundary between the primary and secondary coolant system. The integrity of the SG tubes are evaluated every outage, and the eddy current test is mainly used as a non-destructive examination method due to its inspection speed and the reliability for thin tube.
The tubes are inspected by eddy current bobbin probe having a pair of circumferential coils as a basic inspection. For more detailed information of the bobbin probe technique, rotating probe having pancake and +point coil is used as an additional test. The rotating probe is used to detect circumferential crack, to confirm the abnormal signal of the bobbin probe, and to characterize the type of a defect.
The array probe was developed more than ten years ago and the probe has been used in some countries. The probe has multi-arranged coils around its body, which makes the eddy current formation and rotate the probe electrically to have both high inspection speed and detectability.
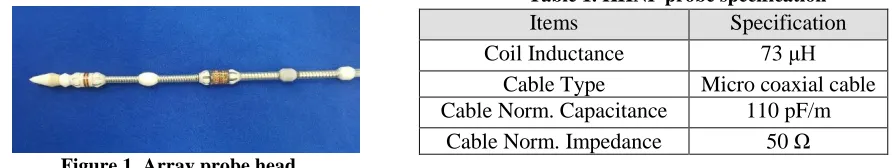
KHNP had developed array probe which has 2 rows×16 coils, transmits and receives the eddy current by sequence between coils as shown in Figure 1. The array probe specification was as Table 1.
Table 1. KHNP probe specification
Figure 1. Array probe head
The performance of the KHNP array probe was verified according to the EPRI SG examination guideline and compared with the qualified probe in this paper.
2. SYSTEM CONFIGURATION
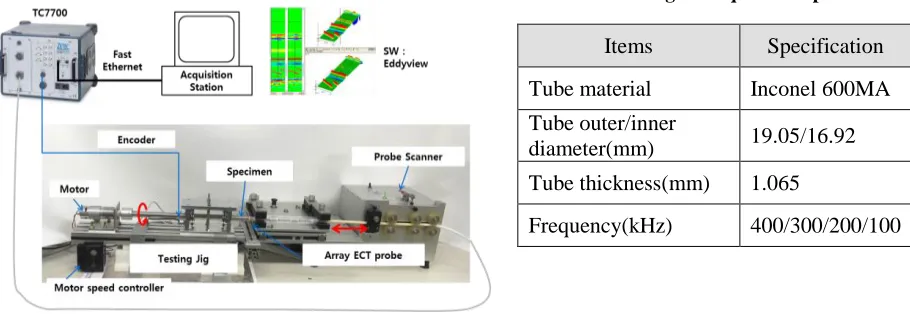
The developed array probe was moved by probe pusher through various specimens, and the system configuration of the test was as Figure 2. The eddy current signal was acquired by eddy current generator TC-7700 and its software EddyView 1.5B5(Zetec, Inc.).
The probe was connected to the equipment without an additional extension cable, and the moving speed of the probe was 45mm/sec. The signal acquisition specification was as Table 2.
Items Specification
Coil Inductance 73 μH Cable Type Micro coaxial cable Cable Norm. Capacitance 110 pF/m
Table 2 Table 2: Signal acquisition specification
3. PERFORMANCE RESULT
3.1 Relative Current Density
The relative current density is a measure of eddy currents which is generated within the tube wall. The value is expressed as a remaining eddy current density in terms of percentage in relation to the available at the tube wall ID.
The standard depth of penetration(SDP) is as follow Eq. (1) which uses units of inches.
SDP (δ) = 1.98√𝜌/𝑓 (1)
In equation (1), ρ is the material resistivity (μΩcm), f is the frequency(Hz).
The relative current density (Jx/Jo) is approximated by
𝐽𝑥⁄ = 𝑒𝐽𝑜 −𝑥/𝛿 (2)
In equation (2), Jx/Jo is the approximate ratio of the current density at the relative distance of x versus o, and is expressed as a percentage. The x is the relative position within the tube wall(x is the distance between the full wall thickness and o, expressed in inch), o is at the surface of the coil.
The tube material was Inconel 600 which has resistivity of 103 μΩcm. The relative current density was calculated at the OD surface of the tube, and the comparison of the relative current density between reference and KHNP probe was as Table 3 in which the difference was within ±10%.
Table 3 : Relative current density of KHNP & Reference probe
Item KHNP Probe Reference probe Comment
x (in) 0.076498 0.076744 -
SDP (in) 0.036687927 0.03668 based at 300kHz
Relative current density 12.429% 12.346% Difference is 0.7% Items Specification
Tube material Inconel 600MA
Tube outer/inner
diameter(mm) 19.05/16.92
Tube thickness(mm) 1.065
Frequency(kHz) 400/300/200/100
3.2 Center Frequency
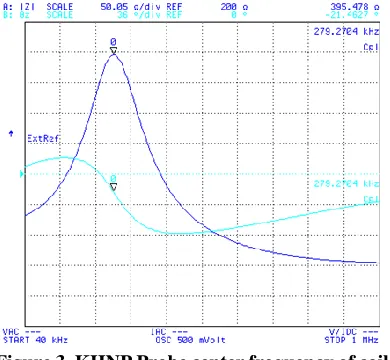
Center frequency was measured at the receiver coil while the array probe is located on the no flaw region of the calibration standard, and the start and stop frequency of the analyser was 40Hz ~ 1MHz. The electric characteristic test was performed by impedance analyser Agilent 4294A(Rev1.11) which is connected to computer via USB port.
The swept frequency plot of the coil was as Figure 3, the peak point of the frequency was called center frequency. The comparison of the center frequency between reference and KHNP developed probe was as Table 4, the difference was within ±10%. To compare both probes, the frequency was averaged among coils respectively.
3.3 Coil Configuration Sensing Area
This test was to measure the signal change of the probe according to the interaction between artificial notch and coil sensing area. The specimens have many artificial notches which have various depth, length, width, and diametral offset as mentioned in Table 5. The array signal was basically calibrated using array probe calibration standard which have 30% through wall OD spiral 360 degree groove.
Table 5: Specimens for coil sensing area affected by notches
Specimens Notches depth Notes
Depth Coefficient OD
OD 100/80/2*60/4*40
/6*20% All Ax. Notches have 30mm length, 0.2mm width
Depth Coefficient ID ID 80/2*60/4*40/6*20% All Ax. Notches have 30mm length, 0.2mm width
Diametral Offfset
Value 100% TW(Through Wall)
All Ax. Notches have 30mm length, 0.2mm width at specimen (fill factor* 90/91/92%)
Axial Length
Coefficient 100% TW
All Ax. Notches have 15/12.5/10/7.5/5/2.5mm length and 0.2mm width
Transverse Width
Coefficient 100% TW
All Notches(Ax/Cir) have 8.2mm/5.9mm length and 0.19/0.29/0.39/0.49/0.59mm width
Tube Circumference
Coverage ID 60%
All Notches(Ax/Cir) have 2mm length and 0.5mm width
* fill factor means the distance between the coil and inner surface of the tube Figure 3. KHNP Probe center frequency of coil #1
Table 4: Center frequency comparison between probes
Items KHNP
Probe
Reference Probe Center frequency
(kHz) 279.512 296.244
Frequency gap with reference
probe
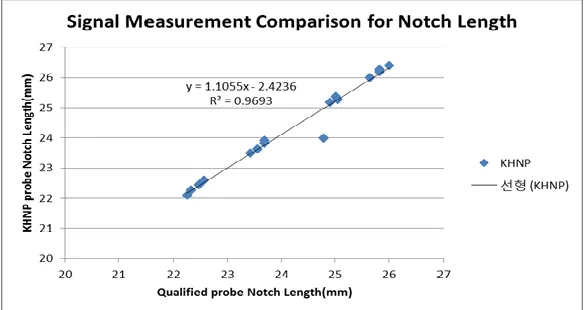
3.3.1 Effective Scan Field Width (ESFW)
The ESFW is a measure of the extent of the effective sensing area in the specimen direction. The signal amplitude drops when the sensing area scans past the defect at increasing sensing distances. A 100% TW notch of 0.19mm width and 30mm long (using Depth Coefficient OD specimen of Table 5) was scanned perpendicular to the direction of the induced eddy current.
The signal amplitude and phase was setup to calibrate all channels of the array probe as Table 6.
Table 6: Array probe signal setup (1)
The measured notch length was compared between KHNP and reference probe. Figure 4 showed 1:1 scale measured notch length, the both probe had very similar behaviour.
Figure 4. Comparing notch length measurement between KHNP & reference prone
3.3.2 Diametral Offset Value (DOV)
The DOV is a measure of the effective sensitivity drop when the distance between eddy current source and the inner surface of the tube increases. Three 100% TW notches had 0.19mm width and 30mm length, and the notches were located on different tubes which had different fill factor of 92/91/90% according to its inner diameter of 17.3/17.1/16.9mm separately.
The signal amplitude and phase was setup to calibrate all channels of the array probe as Table 7. And the Diametral Offset Value specimen of Table 5 was used.
Table 7: Array probe signal setup (2)
The eddy current signal on different tubes were compared between KHNP and reference probe. Figure 5 showed 1:1 scale measured signal amplitude, the both probe had very similar behaviour.
Items Value Target
Signal amplitude 5 Volts 360 degree OD groove @ array calibration standard
Phase degree 90 degree 100% TW notch @ DC OD specimen
Items Value Target
Figure 5. Comparing probe signals according to fill factor of tube
The signal amplitude drop was used as decibel (dB), and it meant that how the eddy current signal measured the notch relatively to the peak. See Equation (3) below:
Decibel = 20 × log (𝑀𝑒𝑎𝑠𝑢𝑟𝑒
𝑃𝑒𝑎𝑘 ) (3)
The eddy current signal was affected by notches that were on three different tubes, and was peaked at the tube of the highest fill factor (92% in this test). The number of (.92/.91/.90) at the legend of Figure 7 means fill factor of (92/91/90%) respectively. And the Z means reference probe, and K means KHNP probe.
The signal drop was decreased in the order of (.92 TO .90) (.92 To .91) (.91 TO .90), and the behaviour of both probe was similar as Figure 6. From the point of DOV, KHNP probe had less signal drop according to the fill factor of the tube than reference probe.
Figure 6. Comparing signal drops of different fill factor notches
3.3.3 Depth Coefficient (DC)
The DC is a measure of the influence of the flaw depth and eddy current density within the wall thickness of the specimen. All notches had different depth and arrangement on inner and outer surface of the specimen as below (using Depth Coefficient OD/ID specimen of Table 5), and all apart notches were on the same cross section.
- One notch of 100% TW depth - One notch of 80% TW depth
The signal amplitude and phase was setup to calibrate all channels of the array probe as Table 7. The result of measurement was normalized to 10 Volt at the 100% TW notch which had peak amplitude.
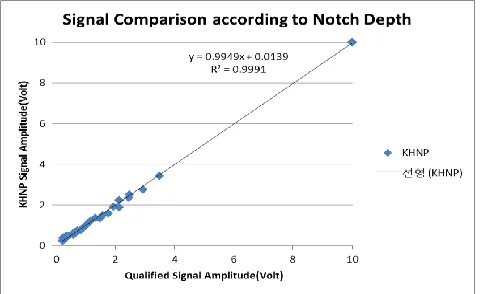
The signals on different notches were compared between KHNP and reference probe. Figure 7 showed 1:1 scale measured signal amplitude, the both probe had very similar behaviour.
Figure 7. Comparing probe signals according to notch depth
The relative signal change of notch depth was measured in dB. The signal amplitude drop meant that how the eddy current signal measured the notch depth at a certain amplitude relatively to the peak.
The Figure 8 showed that the signal drop due to the notch depth was similar between two probes regardless of the notch side (OD and ID). The Deeper of the notch depth, the lesser of the signal drop, and the ID notches had less signal drop than OD notches.
Figure 8. Comparing DC signal drops of different notch depth
3.3.4 Axial Length Coefficient (ALC)
The ALC is a measure of the influence of the axial notch length on the amplitude of the eddy current signal. Six 100% TW notches have 0.2mm width with different length (using Axial Length Coefficient specimen of Table 5).
The signal amplitude and phase was setup to calibrate all channels of the array probe as Table 7. The peak signal amplitude was set to 10 volt, and the other signals were normalized.
The signals of different length notches were compared between KHNP and qualified reference probe. Figure 9 showed 1:1 scale measured signal amplitude. The both probes had very similar behaviour, and KHNP probe had slightly higher amplitude on most notches.
Figure 9. Comparing probe signals according to notch length
The signal amplitude drop was used as dB, the different notch length was affected relatively to the peak signal. The Figure 10 showed that the signal drop has similar behaviour between both probes. The number followed by Z and K in the legend means the length of the notch (mm).
The higher of the frequency, the more signal drop, and the longer of the notch length, the less of signal drop. From the ALC view point, KHNP probe had less signal drop according to the length of the notch.
Figure 10. Comparing ALC signal drops of different notch length
3.3.5 Transverse Width Coefficient (TWC)
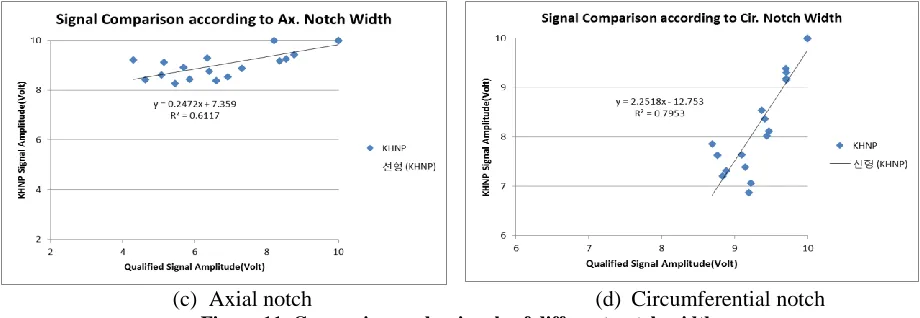
The TWC is a measure of the transverse crack width on the amplitude of the eddy current signal. All notches had 100% TW depth and were scanned perpendicular to the sensing area direction (using Axial Length Coefficient specimen of Table 5).
Figure 11 showed 1:1 scale measured signal amplitude, the both probe had slightly different behaviour according to notch orientation (axial and circumferential). KHNP probe had bigger signal at the axial notch width than reference probe, and the other way the reference probe had slightly bigger signal at circumferential notch.
Figure 11. Comparing probe signals of different notch width
The relative signal change according to the notch width was measured in dB. The signal amplitude drop meant that how the eddy current signal was affected by the notch width at a certain amplitude relatively to the peak. The Figure 12 showed that the signal drop had similar behaviour between both probes. The wider of the notch width, the smaller of signal drop, and the axial notches had more signal drop as the frequency was increased. But the level of signal drop from notch width is lower among coil sensing area characteristics.
From the TWC view point, KHNP probe had less signal drop according to the length of the axial notch, and little more signal drop at circumferential notch. But the overall trend was similar and was not that different.
Figure 12. Comparing TWC signal drops of different notch width
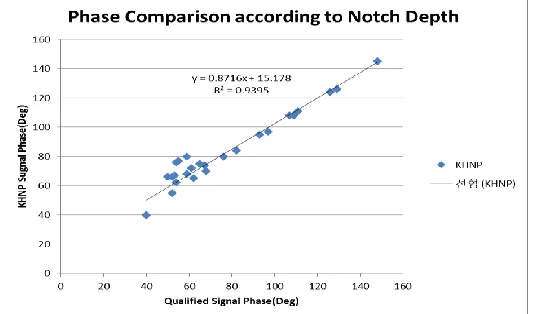
3.3.6 Phase to Depth Curve (PDC)
The PDC is to measure the phase of the eddy current signal on the axial notch depth. The notches had 0.2mm width and 30mm long with different depth and were located on inner and outer surface of the specimen (using Depth Coefficient OD/ID specimen of Table 5).
The signal amplitude and phase was setup to calibrate all channels of the array probe as Table 8. (c) Axial notch (d) Circumferential notch
Table 8: Array probe signal setup (3)
Figure 13 showed 1:1 scale measured signal phase degree between KHNP and reference probe, the both probe had very similar behaviour.
Figure 13. Comparing probe signal phases of different notch depth
There is no need to use amplitude drop to compare the result, because the phase is measured by discrete integer value.
3.3.7 Tube Circumference Coverage (TCC)
The TCC is measured by the amplitude response signal cross at the adjacent sensing area in an array (using Tube Circumferential Coverage specimen of Table 5). The amplitude crossover was the point below the peak amplitude response, the peak signal amplitude of the coils was set to 1 volt. The signal around the specimen was displayed in a polar plot. While the specimen was rotated at a speed of 50rpm with sample rate of 1,000Hz, the probe was inserted into the specimen to acquire the signal.
(a) Axial coil (b) Circumferential coil Figure 14. KHNP probe Tube Circumferential Coverage
Items Value Target
The amplitude crossover attributes to flaw resolution, signal repeatability, and minimum detection capability of the probe. The KHNP probe had the crossover of average 79.07% for the axial coils and 74.79% for the circumferential coils as shown in Figure 14.
The probe satisfied the acceptance criteria for the amplitude crossover, in which the Probe Quality of EPRI guidelines requires the 70% and over.
CONCLUSION
The array probe performance could be affected by many design factors such as coil variables (diameter, resistance, inductance, coil turns, distance between coils, etc.), cable variables (resistance, capacitance, etc.), and the others (frequency, material, and wall thickness, etc.). These variables could be checked by relative eddy current density, center frequency, circumferential tube coverage, and other characteristics of coil sensing area affected by artificial notch.
KHNP developed an array probe for the SG tube inspection, and the probe was verified the performance comparing with the qualified reference probe based on EPRI guidelines Rev. 7. The design had been revised to meet the requirement by modifying coil and cable variables.
The performance results between KHNP and reference probe were very similar. The relative current density, center frequency, and tube circumference coverage were satisfied the criteria of EPRI guideline. And the other test results from the coil sensing area (scan field width, length, diametral offset, depth, axial length, transverse width, phase to depth) are too much alike.
The array coils send and receive eddy current in consecutive order, and make the axial and circumferential combination. In the case of the tube circumference coverage, the axial coils have 32 coil combination (16 X 2) for axial notch, and the circumferential coils have 16 coil combination for circumferential notch. So the tube coverage of the circumferential coils in this test was decreased than in the case of axial coil.
Besides, the array probe had been checked the detectability of several standards (flat bottom hole, wear, notch, and foreign objects), demonstrated the operating performance at the steam generator mock-up. And the other array eddy current system (eddy current generator and operating software for array inspection) has been developed, the system has been compared the performance in conjunction with the array probe. The array inspection system is expected to be applied in the field of SG tube inspection in Korea by stages.
ACKNOWLEDGEMENT
This work was supported by the Nuclear Power Core Technology Development Program of the Korea Institute of Energy Technology Evaluation and Planning (KETEP) granted financial resource from the Ministry of Trade, Industry & Energy, Republic of Korea (No. 20131510200380).
REFERENCES
EPRI(2007), “Pressurized Water Reactor Steam Generator Examination Guidelines, Rev. 7(1013706)”
KEPIC(2007), “MIZ Supplement Supplement 1”
AECL(1995), “Eddy Current Probe Characterization & Design”
KHNP(2014), “Integrated Guidelines of Steam Generator Management Program (Rev.3)”