ABSTRACT
LEE, WILLIAM MORGAN. Dynamic Microstructural Characterization of High Strength Aluminum Alloys. (Under the direction of Professor Mohammed A. Zikry).
Dynamic Microstructural Characterization of High Strength Aluminum Alloys
by
William Morgan Lee
A thesis submitted to the Graduate Faculty of North Carolina State University
In partial fulfillment of the Requirements for the degree of
Master of Science
Mechanical Engineering
Raleigh, North Carolina 2008
APPROVED BY:
_______________________________ ______________________________ Professor Mohammed A. Zikry Professor Kara Peters
Committee Chair
ii
DEDICATION
iii BIOGRAPHY
iv
ACKNOWLEDGMENTS
I would like to acknowledge and thank those who assisted me in my efforts in this research. A special thanks to Professor Mohammed A. Zikry is necessary for his support and guidance through the research. I would also like to thank the committee members for their guidance, Professor Kara Peters and Professor Alina Chertock. Also, none of this would have been possible without the support and guidance of Dr. Bryan Cheeseman at the Army Research Laboratory, Dr. Alex Cho at ALCAN, Dr. Bruce Lamattina at the Army Research Office, and Dr. James Wargo at JIEDDO.
v
TABLE OF CONTENTS
LIST OF FIGURES... vi
LIST OF TABLES ... viii
1. BACKGROUND and RESEARCH OBJECTIVES...1
1.1 MICROSTRUCURAL CHARCTERISTICS ...1
1.2 DYNAMIC FAILURE MODES ...6
1.3 RESEARCH OBJECTIVES ...7
2. METHODS of CHARACTERIZATION ...9
2.1 INTRODUCTION ...9
2.2 COORDINATE SYSTEM ...10
2.3 SECTIONING ...10
2.4 OPTICAL MICROSCOPY (OM) ...10
2.5 ORIENTATION IMAGING MICROSCOPY (OIM) ...11
2.6 TRANSMISSION ELECTRON MICROSCOPY (TEM/STEM)...12
2.7 SCANNING ELECTRON MICROSCOPY (SEM)...13
2.8 X-RAY ANALYSIS (EDS) ...14
3. RESULTS and DISCUSSION ...21
3.1 DYNAMIC FAILURE...21
3.2 COMPARISON OF REGIONS PENETRATED and NOT PENETRATED ...23
3.3 GRAIN SIZE AND SHAPE ...23
3.3.1 2” PLATE and 1.5” PLATE...24
3.3.2 1.5” SHOT PLATE, FAR FIELD REGION ...24
3.3.3 1.5” SHOT PLATE, PENETRATED REGION...25
3.3.4 ROLLING DEFORMATION...25
3.3.5 DISCUSSION...25
3.4 PRECIPITATE CHARACTERIZATION ...26
3.4.1 STEM, 2” UNDEFORMED PLATE...26
3.4.2 1.5” SHOT PLATE, PENETRATED REGION...27
3.5 CHARACTERIZATION OF HIGH ANGLE GRAIN BOUNDARIES...28
3.6 DISPERSED PARTICLES ...28
3.6.1 2” UNDEFORMED PLATE ...28
3.6.2 1.5” SHOT PLATE, PENETRATED REGION...29
4. CONCLUSIONS...64
5. FUTURE RESEARCH OBJECTIVES ...66
vi
LIST OF FIGURES
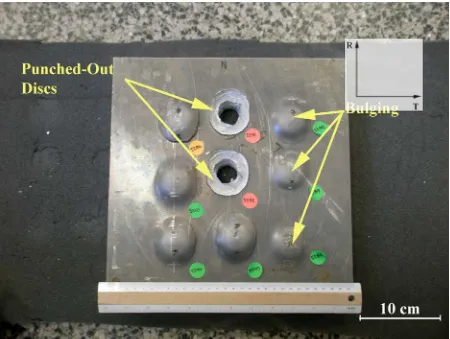
Figure 1: Backside of Shot 1.5” Plate Showing Bulging ...16
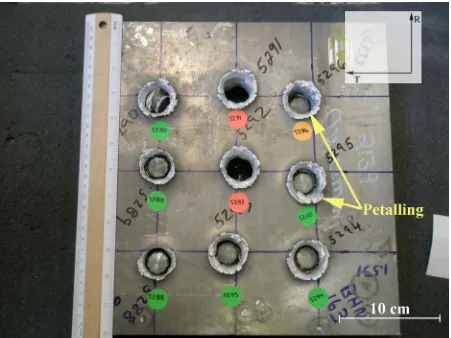
Figure 2: Impact Side of Shot 1.5” Plate Showing Petalling...17
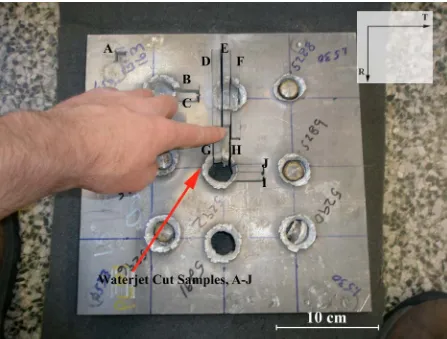
Figure 3: Shot 1.5” Plate After Waterjet Sectioning, with Samples Labeled A-J ...18
Figure 4: Coordinate System ...19
Figure 5: Comparison of a) Milled Surface, R-S Plane vs. b) Polished Surface, R-T Plane, both from 2” Plate ...19
Figure 6: Comparison of Waterjet Cutting vs. Mechanical Sectioning, Grain Boundaries Hand Drawn, both from 2” Plate...19
Figure 7: STEM Sample Dimensions...20
Figure 8: Polished Cross-Section of Penetrated Section (Sample GI, R-S Plane) ...30
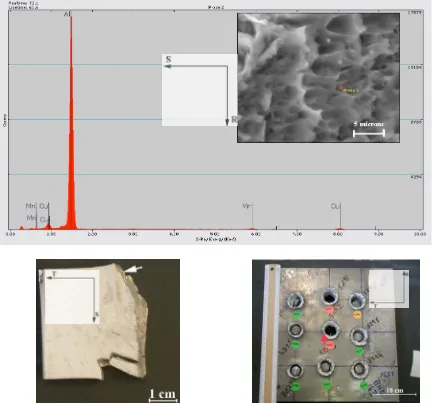
Figure 9: EDS Investigation of Dispersed Particles, Confirming Al, Mn, Cu, and Possibly Fe at a Tensile Fracture Surface of a Penetrated Region (Sample I) ...31
Figure 10: Polished Cross-Section of Not Penetrated Section (Sample CI, T-S Plane)...32
Figure 11: Crack Bifurcation and Shear Banding Indicating that Cracking is Due to Heavy Shear, Penetrated Region (Sample JI, T-S Plane) ...33
Figure 12: OM Image of Showing GB Cracking in Shear Bands (Sample GI, R-S Plane)...34
Figure 13: Arrested Crack Showing the Transition Between Shear Failure and Bending Failure (Sample JI, T-S Plane)...35
Figure 14: Grain Boundary Cracking Near Spall Plane, No evidence of Localized Shear (Sample JI, T-S Plane) ...36
Figure 15: SEM Image of Fracture Surface, (Sample B, R-T Plane) ...37
Figure 16: SEM Image of Transition from Bending Failure to Shear Punchout in Penetrated Region (Sample I)...38
Figure 17: Polished Cross-Section of a Penetrated Region (Sample JI, T-S Plane) ...39
Figure 18: Cross-Section after Etching of a Non-Penetrated Region (Sample FI, R-S Plane)39 Figure 19: Effect of Impact Velocity on Bulge Height ...40
Figure 20: Comparison of Cracking in Penetrated (V= 995 m/s) and Non-Penetrated (V= 959 m/s) Regions, T-S Plane, 63.5 mm in Penetrated, 49.5 mm in Non-Penetrated ...41
Figure 21: Comparison of Cracking in Penetrated (V= 995 m/s) and Non-Penetrated (V= 961 m/s) Regions, R-S Plane, 98 mm in Penetrated, 80.5 mm in Non-Penetrated...42
Figure 22: Diffuse Shear in Non-Penetrated Region, T-S Plane (Sample CI)...43
Figure 23: Localized Shear in Penetrated Section, Similar Location in Cross-Section as Figure 22 ...44
Figure 24: Grain Size Data, 2" Plate, T-S Plane, 95% CI in Red, Undeformed...45
Figure 25: Grain Size Data, 2" Plate, R-Direction, 95% CI in Red, Undeformed...46
Figure 26: Grain Size Data, 1.5" Plate, T-S Plane Near Edge, 95% CI in Red, Undeformed.47 Figure 27: Grain Size Data, 1.5" Plate, T-S Plane Near Middle, 95% CI in Red, Undeformed ...48
Figure 28: Grain Size Data, 1.5" Plate, R-S Plane Near Edge, 95% CI in Red, Undeformed 49 Figure 29: Grain Size Data, 1.5" Plate, R-S Plane Near Middle, 95% CI in Red, Undeformed ...49
vii
Undeformed...50
Figure 32: a) R-S Plane, Face; b) R-S Plane, Middle, Showing Larger, More Elongated Grains in the Middle Section, Both Undeformed...50
Figure 33: a) Kernal Average Misorientation; b) Grain with Deformation Bands, both T-S Plane Undeformed 2” Plate...51
Figure 34: a) Kernal Average Misorientation; b) Grain with Deformation Bands, both R-T Plane Undeformed 2” Plate...52
Figure 35: Linescan Data of Precipitates Along Dislocation Line in 2” Undeformed Plate (S-T Plane)...53
Figure 36: Apparent Grain Boundary in Undeformed 2” Plate (S-T Plane), Showing Heterogeneous Precipitation ...54
Figure 37: Images of Distorted Precipitates from Milling Undeformed 2” Plate (R-S Plane)54 Figure 38: TEM Image Showing some Distortion in Precipitates due to Dislocation Interactions...55
Figure 39: TEM Image of Dislocations Interacting with Precipitates ...56
Figure 40: Relationship Between Dislocations and Omega Precipitates ...57
Figure 41: TEM Image of Dislocations Continuing Through an Omega Precipitate ...58
Figure 42: Grain Boundary Characterization Using OIM, Showing High Angle Grain Boundaries, Undeformed 2” Plate...59
Figure 43: BF STEM Images of Mn-Containing Dispersoids in 2” Plate, a) S-T Plane; b) R-T Plane; c) R-S Plane; d) S-T Plane, all Undeformed 2” Plate ...60
Figure 44: Representative EDS Spectrum Confirming Presence of Al, Cu, Mn and Fe...60
Figure 45: TEM Image of Dispersed Particles, Showing Preferred Orientation, (Sample I, T-S Plane) ...61
Figure 46: EDS Investigation of Dispersed Particle, Confirming Al, Mn, Cu, and Fe at a Shear Fracture Surface of Penetrated Region (Sample I) ...62
Figure 47: SEM Image of Dispersed Particles (Sample B, R-T Plane) ...63
viii
LIST OF TABLES
1
1. BACKGROUND and RESEARCH OBJECTIVES
Aluminum can be alloyed with small amounts of elements such as Cu, Mg, Mn, Li, Zn, or Si to increase the strength of the naturally soft material. The relatively low density of aluminum makes it beneficial in comparison with other metals for numerous civilian and military applications. Aluminum has been used for packaging, electrical, automotive, and aerospace applications. Its high strength makes it suitable for shock loading, and its toughness at different temperatures makes it beneficial for aerospace applications (Altenpohl 1999).
Aluminum alloys have been developed since age hardening was discovered by Wilm in 1906. The natural aging phenomenon observed by Wilm was due to microstructural changes within the Al-Cu-Mg based alloy (denoted as 2*** series). Different heat treatments and artificial aging can alter the microstructure (Altenpohl 1999). Recent observations show that small additions of Ag to the ternary alloy lead to the precipitation of , which significantly increases mechanical properties such as creep resistance and thermal stability (Polmear 2004). Recently, emphasis has been placed on using aluminum alloys in high strain-rate impact situations. Through advances in heat treatments and metallurgical techniques, precipitate and dispersoid hardening has been used in aluminum alloys such as Al 2139 (Cho and Bes 2006).
1.1 MICROSTRUCURAL CHARCTERISTICS
2
precipitation is due to the decrease in solid solubility with the decrease in temperature in the alloys of the Al-Cu system (see, for example, Polmear 2004). Al 2139 falls into the +S+ region of the Al-Cu-Mg phase diagram, which has been shown to produce a precipitate with the addition of small amounts of Ag (Lach and Domack 2003). This region is representative of high Cu/Mg ratios, known for maximum strength of quaternary alloys (Teleshov, Kaputkin et al. 2005).
Recently, several efforts have focused on enhancing the precipitation by limiting competing precipitates such as S’ and ’, which also form in quaternary alloys, and enhance the coarsening resistance of (Gable, Shiflet et al. 2006). The precipitate forms on the {111} planes in the Al-Cu-Mg system (Cu:Mg ratio of 4-10) (Chester and Polmear; Polmear and Chester 1989; Gable, Shiflet et al. 2004; Wang and Starink 2005). Plate-like precipitates on this plane have a greater impact on strengthening than precipitates on other planes of aluminum alloys (Nie, Muddle et al. 1996).
The precipitation sequence in a quaternary alloy with a high Cu:Mg ratio has been reported (Hono, Sano et al. 1993) as
GP zones''' (on {110}) SSSS
CoClustering (on {111})
, (1)
3
Metastable copper rich Guinier-Preston (GP) zones form on the {100} planes of Al-Cu based alloys with full coherency. The GP zones are on the order of tens of nanometers (Ringer and Hono 2000). Precipitation of ” follows and is said to be two layers of Cu separated by three layers of Al on the {001} planes which precedes precipitation of ’ (Ringer and Hono 2000). The phase forms from ’ in overaged alloys and is incoherent with {100} planes (Wang and Starink 2005). The order of the formation of the precipitates during the aging process of Al-Cu-Mg-Ag alloys is GP Zones, ”, , ’, S’ and (Ringer, Hono et al. 1996; Zahra and Zahra 2004). The precipitation of the S’ phase expected in Al-Cu-Mg based alloys is reduced by the high Cu:Mg ratio (Del Castillo and Lavernia 2000). Cho and Bes reported that the precipitates and ’ were present in the Al 2139 alloy (2006).
4
et al. 1993). Stability up to 250° C has been observed for ; above 250° C, the precipitate becomes metastable (Ringer, Hono et al. 1996). Transmission electron microscopy (TEM) measurements have led to reports of the length of the precipitate to be from 70 to 200 nm, with aspect ratios as high as 100:1 (Chester and Polmear 1980; Polmear and Chester 1989; Beffort, Solenthaler et al. 1995; Gable, Shiflet et al. 2004; Zahra and Zahra 2004; Wang and Starink 2005). The most common thickness measurement has been 2-3 nm (Chester and Polmear; Knowles and Stobbs 1988). The most common shape of the precipitate is hexagonal, with a less common octagonal form (Fonda, Cassada et al. 1992).
The ’ precipitate forms on the {100} planes and is approximately the same order of length as the precipitate (~100nm) (Hono, Sano et al. 1993; Gable, Shiflet et al. 2004). The structure of ’ has been reported as octagonal platelets of body centered tetragonal unit cells (Muddle and Polmear 1989; Ringer and Hono 2000).. Precipitate ’ has also been reported as ellipsoidal (Garg, Chang et al. 1990). The ’ precipitate has been termed semi-coherent, and Silcock’s atomic model is the accepted one (Wang and Starink 2005). The reported make up is Al2Cu, and has been confirmed by APFIM tests (Hono, Sano et al. 1993). It is reported that ’ tends to precipitate on dislocation lines (Polmear and Chester 1989) and low-angle GB’s (<9-12 deg) (Vaughan 1968). Unlike precipitation, there is no tendency for Ag or Mg to segregate to the interface of ’ (Hono, Sano et al. 1993).
5
dislocation multiple cutting with small (angstrom level) steps, increasing the interfacial area (Li and Wawner 1998).
The S’ precipitate formed in Al-Cu-Mg based alloys is of concern, because as it grows into an S precipitate, it takes Mg away from the / interface, reducing coarsening resistance and eventually leading to dissolution (Gable, Shiflet et al. 2006). After prolonged aging, Mg and Ag atoms can segregate to S instead of in a quaternary alloy. The S precipitates have also been reported to form at the expense of in a quaternary alloy with low Cu:Mg ratio (Del Castillo and Lavernia 2000). Like the ’ precipitate, S’ also tends to form on dislocation lines (Polmear and Chester 1989), but will also form away from dislocation lines inside the matrix (Wang, Starink et al. 2006). TEM images show that the semi-coherent S’ precipitate is on the same order of length as the ’ precipitates (Wang and Starink 2005). The S’ laths have been observed on the {210} planes (Polmear and Chester 1989).
Another key aspect to the increasing the strength of Al 2139 alloy is the dispersed particles. Dispersed particles lead to resistance of recrystallization and grain size control (Wang and Starink 2005). High strain rate experiments have shown that large particles resist localized shear, whereas small particles lead to higher flow stress (Dai, Liu et al. 2004). Cho and Bes found that Mn produced larger particles than Zr, thus allowing for more resistance to planar slip (Cho and Bes 2006).
6
Amateau et al. 2005) for 7***). This Al20Cu2Mn3 dispersoid is reported as orthorhombic and rod-like in the <010> direction. The reported size of these particles is from 20 to 500 nm (Wang and Starink 2005), with TEM micrographs showing particles from 200 to 500nm (Cho and Bes 2006). This dispersoid has been reported to produce fiber-like reinforcement (Sharma, Amateau et al. 2005). Other particles of Al7Cu2Fe and Al5CuZr2 have also been reported in a similar alloy (Lach and Domack 2003).
1.2 DYNAMIC FAILURE MODES
For metals subjected to high rates of loading there can be numerous failure modes such as dynamic fracture, shear strain localization, shear plugging, discing, and spall.
Adiabatic shear banding is highly localized shearing where the work of plastic deformation is converted into heat, lowering the flow stress of the material (Zukas 1987; Meyers 1994). Shear banding is critical in dynamic loading, because it can lead to shear plugging in some materials at impact velocities near the ballistic limit (Zukas 1987). Shear band formation is hindered by high strain and strain rate hardening and promoted by high thermal softening (Dormeval 1987). Shear banding is also promoted by low specific heat, low thermal conductivity, low density, and high shear yield strength (Woodward 1978). It has been reported that the high density of cutting in precipitates should increase resistance to dislocation motion and reduce slip localization (Li and Wawner 1998).
7
investigated the failure modes of Al 7001 and found that they were highly dependent on the extrusion direction. It was observed that targets impacted parallel with the extrusion
direction failed by shear plugging, whereas targets impacted normal to the extrusion direction failed by discing (Woodward 1979).
Spalling is a mode of dynamic failure caused by the interaction between impact waves and reflection waves from the free surface. This interaction can cause tensile fracture if the tensile pulse after reflection is sufficiently large. Spalling damage has been shown to be dependent on the microstructure of the material, and it can originate at GB’s and
inclusions. Spall strength is higher for monocrystals than for polycrystals (Meyers 1994). The microstructure of aluminum has been shown to play a significant role in the spall behavior of aluminum at low shock stress. Spall behavior at high stresses for aluminum alloys has been reported as similar to the single crystal spall behavior of the [111] plane (Chen, Asay et al. 2006).
1.3 RESEARCH OBJECTIVES
The microstructural behavior of Al 2139 alloy at different strain-rates spanning the quasi-static to the high strain-rates has not been characterized in terms of identification of the toughening and strengthening mechanisms that control failure behavior. Hence, the major objective of this research is to characterize the effect of microstructure on failure modes and impact behavior of Al 2139.
8
have been investigated, with emphasis placed on characterizing the length scales,
orientations, and dislocation interactions with precipitates, dispersoids, and grains. A 2” thick undeformed plate and a 1.5” thick plate that was impacted by 4340 steel fragmentation stimulating projectiles (FSPs) at impact velocities ranging from 813 to 1043 m/s have been investigated. The effects of plate thickness and high strain-rate deformation on the
microstructure have been assessed. Damage modes in the plate have been characterized, and mechanisms for the defeat of the projectile have been proposed.
This paper is organized as follows: Chapter 2 has the methods and procedures used for the characterization, Chapter 3 contains the results and discussion, Chapter 4 has the conclusions from the research, and Chapter 5 outlines future research objectives.
9
2. METHODS of CHARACTERIZATION
2.1 INTRODUCTION
Two plates of Al 2139 were analyzed. One 1.5” plate was waterjet cut to 12” x 12” and shot in nine locations, while the other 2” plate was not shot. Figure 1 and Figure 2 show the shot plate prior to sectioning. Figure 3 shows the same plate after waterjet sectioning. The overall objective of this experiment was to characterize and understand the microstructure of the alloy during projectile impact and penetration, and to investigate differences between plates of different thickness. Observations were made of the undeformed plate as well as deformed and undeformed (far-field) regions of the shot plate.
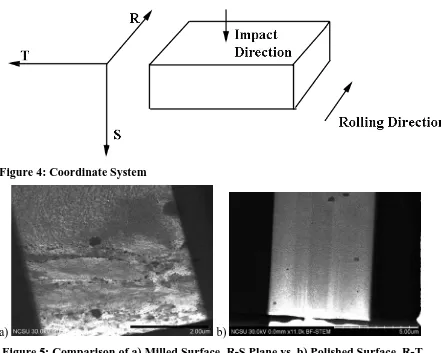
10 2.2 COORDINATE SYSTEM
The rolling axis (R) is parallel to the rolling direction. The transverse axis (T) is normal to both the impact and rolling directions. The short transverse axis (S) is parallel to the impact direction. Figure 4 illustrates the coordinate system. Observations were made with respect to each orientation.
2.3 SECTIONING
We chose the methods of sectioning as to minimize the effect of heat distortion and residual effects on the microstructure of the alloy. Waterjet cutting minimizes this effect. Figure 5 contains STEM images of a milled and a polished surface. It is apparent that there is heat distortion caused by milling. Further sectioning was accomplished using a low-speed diamond saw. Figure 6 is an optical microscopic comparison of a waterjet cut sample vs. a milled sample after polishing. There appears to be no significant difference.
2.4 OPTICAL MICROSCOPY (OM)
Optical microscopy was used to investigate grain shapes and sizes in both the undeformed and shot plates. Observations of shear bands and slip traces were made possible by proper polishing and etching. Grain boundary cracking was also observed using OM.
11
polishing grits (>600 grit). All samples were then polished for at least 5 minutes with a 1 μm alumina abrasive. A Buehler polishing wheel was used at NCSU AIF and South Bay and Leco Polishers were used at NCSU Materials Science Department. Excess abrasive was removed with a Simple Green cleaner or ethanol, sonic cleaned for 5 minutes in water, and rinsed with water. Samples were etched using a 10g NaOH to 100mL H2O mixture for an adequate time. The best results were obtained using a two-step etch with durations of 35 and 45 seconds.
Polarized light optical microscopy was used for analysis of the grain size and shapes. A Nikon Eclipse upright microscope was used at NCSU AIF, and a Carl Zeiss Axiovert 40 MAT optical microscope was used for imaging at NCSU Materials Science Department. Act-1 image acquisition software at NCSU AIF and Axiovision LE software at NCSU Materials Science Department were used is used to obtain digital images.
2.5 ORIENTATION IMAGING MICROSCOPY (OIM)
12
2.6 TRANSMISSION ELECTRON MICROSCOPY (TEM/STEM)
Transmission Electron Microscopy and Scanning Transmission Electron Microscopy were used to view the microstructure of the alloy down to the nano-scale. The main emphasis was the size and distribution of the dispersed particles, precipitates, and the dislocation interactions with these. A JEOL JEM-200FX Electron Microscope was used for TEM imaging. A Hitachi S-5500 Ultra High Resolution SEM with a TEM detector was used for STEM imaging.
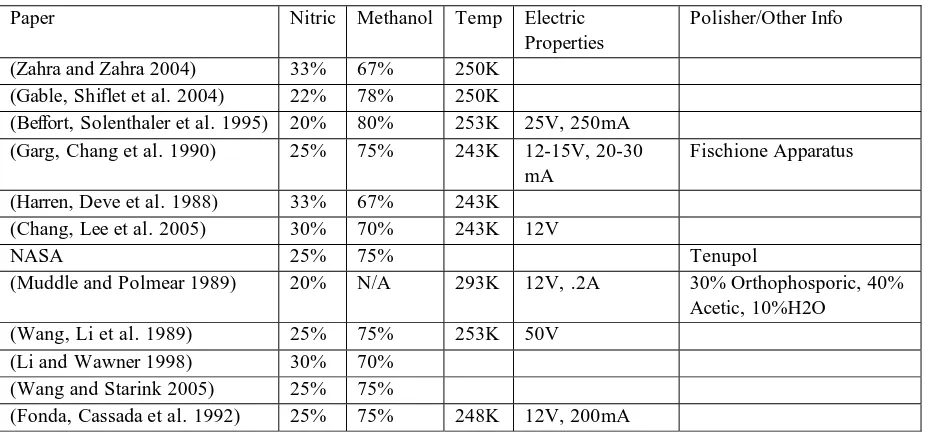
Samples for TEM/STEM observation of the 1.5” plate were cut from waterjet cut samples to approximately 0.125 mm foil using a Leco VC-50 diamond saw. Samples were taken from at least 1/8” away from any waterjet cutting surface to eliminate any doubts about the residual effects of sectioning on the microstructure. Disks of 3mm were then punched from the foil using an Eckert FWT punch. Mechanical polishing down to a thickness of less than 100 μm followed. This consisted of mounting samples on stubs using South Bay QuickStick 135 mounting wax heated up to a temperature below any temperature of concern of the microstructure. A Gatan Disc Grinder 623 was used in polishing. Wax was dissolved using acetone. Samples were electrochemically polished down to an electron transparent thickness using a Fischione Twin-Jet Polishing Apparatus with a 20% Nitric Acid and 80% Methanol mixture at 15V and 160 mA. Table 1 lists a brief review of TEM sample polishing methods for other similar Al alloys. The temperature was kept at 243K using a dry ice bath. Samples were plasma cleaned prior to imaging to remove contaminates.
13
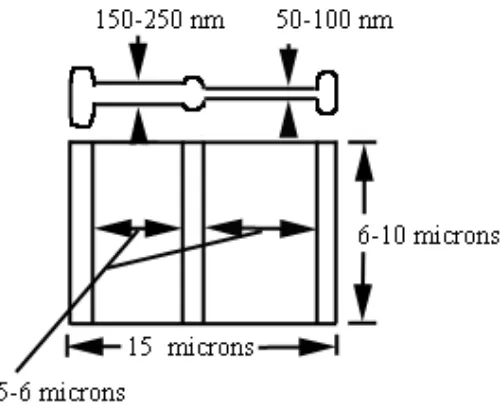
200 3D Focused Ion Beam system. Figure 7 shows the dimensions of a representative FIB prepared sample. Since the Hitachi S-5500 was only capable of imaging with a 30 kV beam, the specimen window had to be thin for viewing.
The JEOL JEM-200FX TEM used a 200kV beam to achieve atomic resolution. The microscope featured thermionic emission using a LaB6 filament. The Hitachi S-5500 with a transmitted electron detector was used for STEM imaging. The reported lateral resolution of the microscope was 0.4 nm for secondary electron images. The microscope used in-lens technology for better resolution. Imaging was performed using a 30 kV beam. A Bruker EDS system was used for elemental analysis.
2.7 SCANNING ELECTRON MICROSCOPY (SEM)
14 2.8 X-RAY ANALYSIS (EDS)
15
Table 1: Polishing Methods for TEM Samples of Similar Al Alloys
Paper Nitric Methanol Temp Electric Properties
Polisher/Other Info
(Zahra and Zahra 2004) 33% 67% 250K
(Gable, Shiflet et al. 2004) 22% 78% 250K
(Beffort, Solenthaler et al. 1995) 20% 80% 253K 25V, 250mA
(Garg, Chang et al. 1990) 25% 75% 243K 12-15V, 20-30
mA
Fischione Apparatus
(Harren, Deve et al. 1988) 33% 67% 243K
(Chang, Lee et al. 2005) 30% 70% 243K 12V
NASA 25% 75% Tenupol
(Muddle and Polmear 1989) 20% N/A 293K 12V, .2A 30% Orthophosporic, 40%
Acetic, 10%H2O
(Wang, Li et al. 1989) 25% 75% 253K 50V
(Li and Wawner 1998) 30% 70%
(Wang and Starink 2005) 25% 75%
16
17
18
19 Figure 4: Coordinate System
a) b)
Figure 5: Comparison of a) Milled Surface, R-S Plane vs. b) Polished Surface, R-T Plane, both from 2” Plate
21
3. RESULTS and DISCUSSION
3.1 DYNAMIC FAILURE
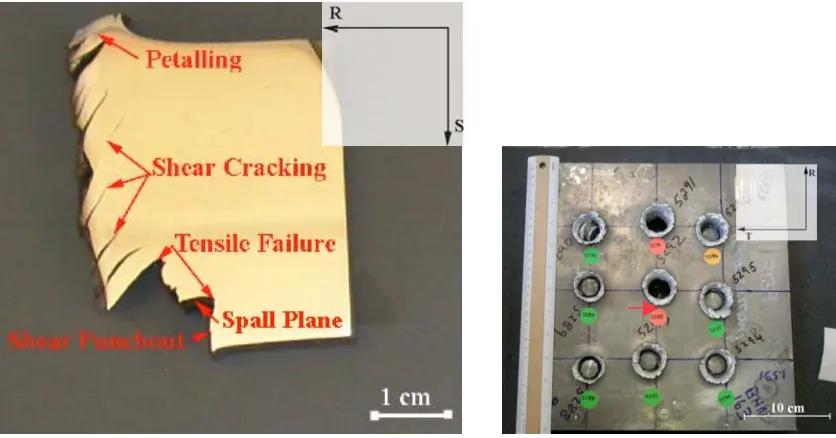
The majority of the impacted regions exhibited similar response to the shots. The initial entry hole was approximately elliptical, with a major axis of 26 mm and a minor axis of 24 mm. The backside deformation, either bulge or punchout disc, was elongated with respect to rolling to approximately 60 mm measured along the R-axis and 50 mm measured along the T-axis for the representative shot. The dimensions of the backside holes of the shots that did pass through were elliptical with a major axis of 33 mm and a minor axis of 28 mm. This increase in size with respect to the initial entry hole can be explained by the projectile deformation as it progresses throughout the plate.
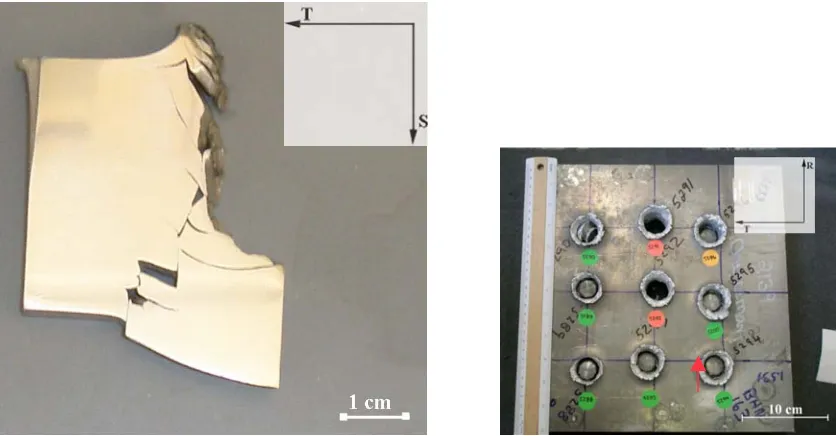
The material showed distinct damage modes, following Woodward’s explanation of discing (1979). The modes of damage included petalling at the impact surface, shear cracking, spalling, bending tensile failure, and localized shear punchout of a disc from the backside of the plate. Figure 8 shows the damage modes of a region of the plate that was penetrated. The extent of the macroscopic damage was a function of the shot velocity.
Petalling was observed on all shots. Initial compression wave and penetration led to shear cracking, and reflected waves caused the deformed material to extend above the initial impact surface. This wave reflection is supported by the image in Figure 9, showing tensile failure between the petal and the plate. Complete separation of the petal area from the bulk plate was observed in the T-S Plane for a shot that defeated the target.
22
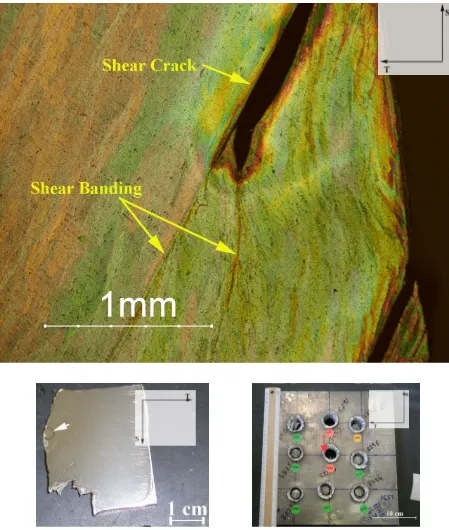
the cross section in both the T-S and the R-S planes. This is shown well by Figure 8 and Figure 10. This cracking was due to heavy shear between the grains as the projectile passes through. Figure 11 indicates that the cracks were caused by intense shear, due to the observation of the crack running into shear bands. Figure 12 shows GB cracking occurring in areas of intense shear of the R-S Plane.
As the projectile continued, the bulging deformation became greater in the backside of the plate because of the reduction of thickness in the undeformed material ahead of the projectile. A mode of bending failure was then activated, shown by Figure 13. This occurred on what appears to be a spall plane. Figure 14 shows grain GB cracking in a near the spall plane in the T-S Plane. Figure 15 shows the expected ductile tensile failure associated with spalling. As the undeformed material became thinner, bending tensile stresses became more intense. Figure 16 shows a fracture surface in a region of transition between the bending tensile failure and the next mode, shear punchout of a disc. This punchout was caused by heavy shear parallel to the impact direction once bending tensile failure occurred. Bulging was noted on regions that stopped the projectile, and a bulged disc was ejected from the samples that did fail (See Figure 1). The bulging was elongated in the rolling direction.
23
T-direction, indicating the damage was more severe in the T-S plane than the R-S plane. The minimum bulge height for which cracking occurred was 6 mm. It appears as if the damage in the R-S plane was a determining factor for the complete penetration of the material. The increased ductility in this direction can be attributed to the elongation of the grains due to rolling.
3.2 COMPARISON OF REGIONS PENETRATED and NOT PENETRATED
Differences in the penetrated regions and those that were not penetrated dealt with the amount of damage observed. The amount of damage was a function of the impact velocity; the two highest impact velocities were observed for the shots that completely penetrated the target. Figure 19 shows the effect of impact velocity on bulge height. It is apparent that the macroscopic deformation was a function of the impact velocity. Figure 20 and Figure 21 compare the amount of cracking observed in cross-sections of penetrated and non-penetrated regions. It is apparent that there was more cracking in the penetrated regions. Figure 22 and Figure 23 show optical micrographs of a similar location on penetrated and non-penetrated regions. It was observed that the shear was more diffuse in the non-penetrated material, noted by slip bands in Figure 23 instead of localized shear bands in Figure 22.
3.3 GRAIN SIZE AND SHAPE
24
obtained from OIM analysis of the 2” plate was compared to a similar image from optical microscopy, both using the Image J method. Similar results were obtained.
3.3.1 2” PLATE and 1.5” PLATE
It was observed that there is a significant difference between the grain structure in the 1.5” and the 2” plates. Figure 30 and Figure 31 illustrate the difference in grain sizes and shapes between the 1.5” and the 2” plates. The grains measured 337 + 32 x 153 + 13 μm (95% confidence for all intervals) when measured in the T-S Plane of the 2” Plate. Analysis in the R-S and R-T Planes led to an average dimension of 523 + 71 μm in the rolling direction. This was similar throughout the thickness. A majority of the GB’s in the 2” plate were high angle boundaries (>15 deg).
3.3.2 1.5” SHOT PLATE, FAR FIELD REGION
25
3.3.3 1.5” SHOT PLATE, PENETRATED REGION
Optical microscopy was used to observe damage in polished and etched cross-sections of the shot plate. Large-scale cracking, shear banding, and grain boundary cracking were observed in all cross-sections. Cracking parallel to the original R-T plane appeared to be shear related. The GB cracking was mostly in the original R-T Plane. The shear bands were oriented mostly in the original R-T Plane. Grains originally horizontal rotated toward the impact direction (-S) in the petalling region and away from the impact direction (+S) for the rest of the thickness of the plate. This is from petalling and shear cracking damage. Image J measurements of grains rotated up to 53° from horizontal proved to be on the same order of size as the undeformed grains. Other grains closer to the impact surface showed more severe deformation.
3.3.4 ROLLING DEFORMATION
Figure 33 and Figure 34 compare kernal average misorientation maps from a forescatter detector to optical microscopy images of similar areas of the 2” plate. Parallel lines depict slip from the rolling deformation of the material. It is evident that there was crystal slip due to rolling prior to impact.
3.3.5 DISCUSSION
26
for GB cracking that can lead to shear or spall failure. Controlling the grain sizes near the edges of the plate could lead to better resistance to the final bending failure and punchout of the disc.
Changes in plate thickness can lead to different grain sizes and shapes. The difference between the 2” plate and the 1.5” plate shows that there is a possibility to increase the grain size. However, the elongation of the grains is less proportionally in the 2” plate than that in the 1.5” plate. There could be a tradeoff between lowering the amount of GB area and the beneficial ductility of the elongated grains.
3.4 PRECIPITATE CHARACTERIZATION
3.4.1 STEM, 2” UNDEFORMED PLATE
STEM imaging of FIB milled samples in the 2” plate showed some interesting characteristics. These FIB milled samples contained some damage from machining. Heterogeneous precipitation of what is speculated to be ’ along a dislocation line was observed. Figure 35 shows the image and an EDS linescan which confirmed the presence of Cu in the dark regions, and no Mn as would be expected in dispersed particles. These precipitates averaged approximately 60 nm in diameter. Also evident from Figure 36 was heterogeneous precipitation in what appears to be a grain boundary. These precipitates appeared to be the same size as the precipitates in Figure 35.
27
Figure 37. This deformation shows that there is the ability for dislocations to flow throughout the material, increasing the ductility. The limited resolution of the low energy STEM beam did not allow for investigation of the interface of the precipitate and matrix. Also, only speculation can be made about which precipitates are present due to the lack of SAD capabilities on the STEM.
3.4.2 1.5” SHOT PLATE, PENETRATED REGION
Precipitates in the 1.5” plate included and ’, as shown by Figure 38. Both precipitates were on the order of 50 nm in length, somewhat smaller than those observed in the 2” plate. The precipitates were somewhat thinner than the ’. Quantitative measurements were not made on the thickness due to the fact that the beam was not directly on the [110] axis.
TEM images of precipitates near the [110] axis in deformed regions of the shot plate show how the precipitates deform. The deformation of the precipitates is due to dislocation interactions. Figure 39 shows the deformation of and ’ precipitates deviated from their natural plate-like shape in a dislocation strain field, and how the dislocation interactions affect this.
The most interesting interaction was that between the precipitates and the aluminum matrix. Figure 40 and Figure 41 show multiple dislocations interactions with the
28
precipitates in a consistent manner. It is apparent from Figure 40 and Figure 41 that the
angle of interaction was approximately 70 degrees when viewed with a [110] beam axis. As many as eight dislocations were observed interacting with one precipitate, and the spacing between dislocations was approximately 5-8 nm. Dislocation multiple cutting reduces shear localization because it will not allow dislocations to shear through the same area. Also the lack of dislocation pile-ups is another indication of sustained precipitate deformation, which can be a mechanism for increased toughness and spall strength.
3.5 CHARACTERIZATION OF HIGH ANGLE GRAIN BOUNDARIES
Figure 42 shows the GB orientations for a section of the 2” plate. It is evident that most of the GB’s had more than a 15 degree misorientation. This is greater than reported values for GB precipitation of ’. This led to reduced precipitation of ’ on the GB’s, and allowed for more precipitation within the grain. This also reduces the GB cracking.
3.6 DISPERSED PARTICLES
3.6.1 2” UNDEFORMED PLATE
29
noted. However, no diffraction data was available with the STEM, so it is unknown if images were taken in a zone that would show preferred orientation.
3.6.2 1.5” SHOT PLATE, PENETRATED REGION
30
31
32
33
34
35
36
37
38
39
Figure 17: Polished Cross-Section of a Penetrated Region (Sample JI, T-S Plane)
40
41
42
43
44
45
46
47
48
49
Figure 28: Grain Size Data, 1.5" Plate, R-S Plane Near Edge, 95% CI in Red, Undeformed
50
a) b)
Figure 30: a) 1.5" T-S Plane; b) 2" T-S Plane, Showing Larger Grains in the 2” Plate, Both Undeformed
a) b)
Figure 31: a) 1.5" R-S Plane; b) 2" R-S Plane, Showing Larger Grains in the 2” Plate, Both Undeformed
a) b)
51 a)
b)
52
a)
b)
53
54
Figure 36: Apparent Grain Boundary in Undeformed 2” Plate (S-T Plane), Showing Heterogeneous Precipitation
55
56
57
Figure 40: Relationship Between Dislocations and Omega Precipitates
58
Figure 41: TEM Image of Dislocations Continuing Through an Omega Precipitate
59
60
Figure 43: BF STEM Images of Mn-Containing Dispersoids in 2” Plate, a) S-T Plane; b) R-T Plane; c) R-S Plane; d) S-T Plane, all Undeformed 2” Plate
61
62
63
Figure 47: SEM Image of Dispersed Particles (Sample B, R-T Plane)
64
4. CONCLUSIONS
There were distinct deformation and damage modes associated with the high strain rate behavior of the Al 2139 plate. Petalling was noted near the impact area. A shear-cracking mode was also evident throughout the plate, which is related to GB shear-cracking. As the deformed material in front of the projectile became thinner, a mode of bending failure was activated, followed by the shear punchout of a disc. This disc starts at the spall plane. Figure 48 shows a schematic of the cross-section after impact and penetration pertaining to these different damage modes. Damage was significantly less in areas that defeated the projectiles than those areas that were fully penetrated and a function of the impact velocity. The final bending tensile failure in shots that were defeated was not overly significant to lead to localized shear punchout.
66
5. FUTURE RESEARCH OBJECTIVES
67
REFERENCES
Altenpohl (1999). Aluminum: Technology, Applications, and Environment. Warrendale, Pa, The Minerals, Metals, & Materials Society.
Babu, S. S., K. Hono, et al. (1993). "Apfim Studies of Some Aluminum-Alloys." Applied Surface Science 67(1-4): 361-367.
Beffort, O., C. Solenthaler, et al. (1995). "IMPROVEMENT OF STRENGTH AND
FRACTURE-TOUGHNESS OF A SPRAY-DEPOSITED AL-CU-MG-AG-MN-TI-ZR ALLOY BY OPTIMIZED HEAT-TREATMENTS AND
THERMOMECHANICAL TREATMENTS." Materials Science and Engineering a-Structural Materials Properties Microstructure and Processing 191(1-2): 113-120. Chang, C. H., S. L. Lee, et al. (2005). "Effect of Ag content and heat treatment on the stress
corrosion cracking of Al-4.6Cu-0.3Mg alloy." Materials Chemistry and Physics 91 (2-3): 454-462.
Chen, X., J. R. Asay, et al. (2006). "Spall behavior of aluminum with varying microstructures." Journal of Applied Physics 99(2): -.
Chester, R. J. and I. J. Polmear "Precipitation in Al-Cu-Mg-Ag Alloys." The Metallurgy of Light Alloys: 75-81.
Chester, R. J. and I. J. Polmear (1980). "TEM INVESTIGATION OF PRECIPITATES IN AL-CU-MG-AG AND AL-CU-MG ALLOYS." Micron 11(3-4): 311-312.
Cho, A. and B. Bes (2006). Damage tolerance capability of an Al-Cu-Mg-Ag alloy(2139). Aluminium Alloys 2006, Pts 1 and 2. 519-521: 603-608.
Dai, L. H., L. F. Liu, et al. (2004). "Effect of particle size on the formation of adiabatic shear band in particle reinforced metal matrix composites." Materials Letters 58(11): 1773-1776.
Del Castillo, L. and E. J. Lavernia (2000). "Microstructure and mechanical behavior of spray-deposited Al-Cu-Mg(-Ag-Mn) alloys." Metallurgical and Materials Transactions a-Physical Metallurgy and Materials Science 31(9): 2287-2298. Dormeval, R. (1987). The Adiabatic Shear Phenomenon. Materials at High Strain Rates. T.
Z. Blazynski. New York, Elsevier Applied Science: 47-70.
Fonda, R. W., W. A. Cassada, et al. (1992). "Accommodation of the Misfit Strain
68
Gable, B. M., G. J. Shiflet, et al. (2004). "The effect of Si additions on Omega precipitation in Al-Cu-Mg-(Ag) alloys." Scripta MATERIALIA 50(1): 149-153.
Gable, B. M., G. J. Shiflet, et al. (2006). "Alloy development for the enhanced stability of Omega precipitates in Al-Cu-Mg-Ag alloys." Metallurgical and Materials
Transactions a-Physical Metallurgy and Materials Science 37A(4): 1091-1105. Garg, A., Y. C. Chang, et al. (1990). "PRECIPITATION OF THE OMEGA-PHASE IN AN
AL-4.0CU-0.5MG ALLOY." Scripta Metallurgica Et Materialia 24(4): 677-680. Harren, S. V., H. E. Deve, et al. (1988). "SHEAR BAND FORMATION IN
PLANE-STRAIN COMPRESSION." Acta METALLURGICA 36(9): 2435-2480.
Hono, K., N. Sano, et al. (1993). "Atom Probe Study of the Precipitation Process in Al-Cu-Mg-Ag Alloys." Acta Metallurgica Et Materialia 41(3): 829-838.
Knowles, K. M. and W. M. Stobbs (1988). "THE STRUCTURE OF (111) AGE-HARDENING PRECIPITATES IN AL-CU-MG-AG ALLOYS." Acta Crystallographica Section B-Structural Science 44: 207-227.
Koda, S., S. Takahashi, et al. (1963). "Direct Observation of Interaction of Dislocations with Theta' Precipitates in an Aluminium-3.8 Wt.-Percent Copper Alloy." Journal of the Institute of Metals 91(7): 229-&.
Lach, C. L. and M. S. Domack (2003). "Characterization of Al-Cu-Mg-Ag Alloy RX226-T8 Plate." NASA.
Li, B. Q. and F. E. Wawner (1998). "Dislocation interaction with semicoherent precipitates (Omega phase) in deformed Al-Cu-Mg-Ag alloy." Acta Materialia 46(15): 5483-5490.
Meyers, M. A. (1994). Dynamic Behavior of Materials. New York, John Wiley & Sons, Inc. Muddle, B. C. and I. J. Polmear (1989). "The Precipitate Omega-Phase in Al-Cu-Mg-Ag
Alloys." Acta Metallurgica 37(3): 777-789.
Nie, J. F., B. C. Muddle, et al. (1996). "The effect of precipitate shape and orientation on dispersion strengthening in high strength aluminium alloys." Aluminium Alloys: Their Physical and Mechanical Properties, Pts 1-3 217: 1257-1262.
69
Polmear, I. J. and R. J. Chester (1989). "ABNORMAL AGE HARDENING IN AN AL-CU-MG ALLOY CONTAINING SILVER AND LITHIUM." Scripta METALLURGICA 23(7): 1213-1218.
Ringer, S. P. and K. Hono (2000). "Microstructural evolution and age hardening in aluminium alloys: Atom probe field-ion microscopy and transmission electron microscopy studies." Materials Characterization 44(1-2): 101-131.
Ringer, S. P., K. Hono, et al. (1996). "Nucleation of precipitates in aged Al-Cu-Mg-(Ag) alloys with high Cu:Mg ratios." Acta Materialia 44(5): 1883-1898.
Ringer, S. P., T. Sakurai, et al. (1997). "Origins of hardening in aged Al-Cu-Mg-(Ag) alloys." Acta Materialia 45(9): 3731-3744.
Sharma, M. M., M. F. Amateau, et al. (2005). "Mesoscopic structure control of spray formed high strength Al-Zn-Mg-Cu alloys." Acta Materialia 53(10): 2919-2924.
Teleshov, V. V., E. Y. Kaputkin, et al. (2005). "Temperature ranges of phase transformations and mechanical properties of alloys of the Al-Cu-Mg-Ag system with various Cu/Mg ratios." Metal Science and Heat Treatment 47(3-4): 139-144.
Vaughan, D. (1968). "Grain Boundary Precipitation in an Al-Cu Alloy." Acta Metallurgica 16(4): 563-&.
Wang, S. C., C. Z. Li, et al. (1989). "Determination of Structure of Al20cu2mn3 Phase in Al-Cu-Mn Alloys." Materials Research Bulletin 24(10): 1267-1270.
Wang, S. C. and M. J. Starink (2005). "Precipitates and intermetallic phases in precipitation hardening Al-Cu-Mg-(Li) based alloys." International Materials Reviews 50(4): 193-215.
Wang, S. C., M. J. Starink, et al. (2006). "Precipitation hardening in Al-Cu-Mg alloys revisited." Scripta Materialia 54(2): 287-291.
Woodward, R. L. (1978). "Penetration of Metal Targets Which Fail by Adiabatic Shear Plugging." International Journal of Mechanical Sciences 20(9): 599-607.
Woodward, R. L. (1979). "Penetration Behavior of a High-Strength Aluminum-Alloy." Metals Technology 6(Mar): 106-110.
70
Zahra, A. M. and C. Y. Zahra (2004). "Effects of minor additions of Mg and Ag on
precipitation phenomena in Al-4 mass% Cu." Philosophical Magazine 84(24): 2521-2541.