ABSTRACT
HARRISON, BRENT E. Dynamically Adapting Games Using Vanity and Actionable Analytics to Increase Session-Level Retention. (Under the direction of David Roberts.)
The ability to control player retention has been long sought after by both game de-signers and game researchers. With casual games becoming more popular, it has become increasingly important to have a good understanding of how to influence player retention. In the game industry, there are many accepted rules about how to best maximize player retention in a game environment (Fields, 2014). These rules are based on expert knowledge and were created based on years of experience making games, but have not been explicitly validated. In academia, many researchers have studied what contributes or detracts from player retention in various game environments with varying amounts of success. Typically, those studying retention choose to examine how well games can retain players over the entire lifetime of the game. In my work, I examine the problem ofsession-level retention.
Given the recent rise in popularity of social and casual games, I believe that learning to influence session-level retention can be just as useful as learning to influence long-term retention. In this dissertation, I propose an analytics-driven technique for increasing session-level retention through the use of dynamic game adaption. This technique leverages two different types of analytics, vanity analytics and actionable analytics, to create models of player retention and then use them to dynamically alter game worlds to increase session-level retention. Vanity analytics are those that hold a great deal of predictive power but are difficult to directly affect, whereas actionable analytics are difficult to directly use in modeling player behavior but can be manipulated in real time.
This technique offers several benefits to both game designers as well as game researchers. Since this technique is data-driven, the insights gained are grounded in data which gives them more strength than some of the insights gained from expert knowledge. Also, this technique uses the inherent strengths of both vanity and actionable analytics and pro-vides researchers with a method for incorporating models of player retention into game environments.
how well they actually do influence session-level retention.
© Copyright 2014 by Brent E. Harrison
Dynamically Adapting Games Using Vanity and Actionable Analytics to Increase Session-Level Retention
by
Brent E. Harrison
A dissertation submitted to the Graduate Faculty of North Carolina State University
in partial fulfillment of the requirements for the Degree of
Doctor of Philosophy
Computer Science
Raleigh, North Carolina
2014
APPROVED BY:
Michael Young James Lester
Robert St. Amant Magy Seif El-Nasr
David Roberts
DEDICATION
BIOGRAPHY
Brent Harrison’s interest in research began simply enough. While studying to complete his undergraduate degree at Auburn University, Brent was given the opportunity to take part in undergraduate research. There was but one condition on this offer: he had to implement a genetic algorithm to solve the traveling salesman problem and then watch it converge. Watching this program slowly converge towards the optimum solution, Brent realized that his plans for the future had changed.
ACKNOWLEDGEMENTS
First, I would like to thank each member of my committee: Michael Young, James Lester, Rob St. Amant, and Magy Seif El-Nasr. Each of you has helped me immensely through your questions and comments on my work.
I would also like to thank my advisor, David Roberts, for being helping me grow as a researcher and as a person, one unplanned meeting at a time. I would also like to thank my first advisor, Nagiza Samatova. You taught me the value of hard work and what it truly means to be a researcher.
During my time at NC State, I have had many friends and colleagues that have helped me on my way. Zach Jorgensen and Trisha Biswas helped me get through my first teaching assistantship as a graduate student for a class that none of us had ever taken. Grad school was never very scary after that experience. It is difficult to name everyone that I’ve had the pleasure to work with, laugh with, and converse with, but I am sure going to try: Julio Bahamon, Rogelio Cardona-Rivera, Brad Cassell, Justus Robertson, Jerry Yang, Robert Loftin, Titus Barik, Matt Fendt, John Rowe, Alok Baikadi, Lucy Shores, and a cast of others. I would also like to acknowledge my best friend, Stephen Ware. You gave me a lab when I had none, you gave me an advisor when I had none, and you moved my furniture when I was stranded in Tennessee. I couldn’t ask for anything more out of a best friend.
I would also like to thank my parents and family for constantly supporting me, even when it seemed as though I would be a student forever.
TABLE OF CONTENTS
LIST OF TABLES . . . ix
LIST OF FIGURES. . . xii
Chapter 1 Introduction. . . 1
1.1 Introduction . . . 1
1.2 Motivation . . . 2
1.2.1 Data-Driven Game Adaption . . . 3
1.2.2 The Gap Between Actionable And Vanity Analytics . . . 4
1.2.3 Session-Level Retention . . . 6
1.3 Summary of Dissertation . . . 6
1.3.1 n-gram Models for Session-Level Retention . . . 8
1.3.2 DDBIAG . . . 8
1.3.3 Quantitative Evaluation . . . 9
1.3.4 Psychometric Side-Effects . . . 9
1.4 Overview of Game Environments . . . 10
1.4.1 Scrabblesque . . . 10
1.4.2 Sidequest: The Game . . . 11
1.5 Conclusion . . . 14
Chapter 2 Background and Related Work . . . 15
2.1 Introduction . . . 15
2.2 Modeling . . . 15
2.2.1 Modeling Retention . . . 16
2.2.1.1 In Games . . . 16
2.2.1.2 Outside of Games . . . 19
2.2.2 Modeling Behavior . . . 20
2.2.2.1 Modeling Behavior in Games . . . 21
2.2.2.2 Modeling Behavior Outside of Games . . . 25
2.2.3 n-Gram Modeling . . . 27
2.2.3.1 n-Gram Modeling in Games . . . 27
2.2.3.2 n-Gram Modeling Outside of Games . . . 28
2.2.4 Knowledge Modeling . . . 30
2.3 Adaptive Systems . . . 31
2.3.1 Adaptive Systems in Games . . . 31
2.3.2 Adaptive Systems Outside of Games . . . 33
2.4 Background on Psychometrics . . . 36
2.4.1 Intrinsic Motivation . . . 36
Chapter 3 Actionable and Vanity Analytics . . . 39
3.1 Introduction . . . 39
3.2 Actionable and Vanity Analytics . . . 39
3.3 Analytics in Games . . . 40
3.3.1 Actionable Analytics in Games . . . 41
3.3.2 Vanity Analytics in Games . . . 41
3.4 The Gap Between Analytics . . . 42
3.5 Game Environments . . . 44
3.5.1 Motivation . . . 44
3.5.2 Vanity Analytics and Actionable Analytics inScrabblesque. . . 45
3.5.3 Vanity Analytics and Actionable Analytics inSidequest: The Game . . 47
3.6 Conclusion . . . 49
Chapter 4 Predicting Session-Level Retention . . . 51
4.1 Introduction . . . 51
4.2 Raw Vanity Analytics . . . 52
4.2.1 Modeling Session-Level Retention inScrabblesque . . . 52
4.2.1.1 Data Collection and Experimental Methodology . . . 53
4.2.1.2 Results and Discussion . . . 55
4.3 n-Gram Modeling Using Deviation-Based Analytics . . . 56
4.3.1 SAX Transformation Methodology . . . 57
4.3.2 n-Gram Modeling . . . 58
4.4 Prediction inScrabblesque . . . 59
4.4.1 Deviation-Based Analytics inScrabblesque . . . 59
4.4.2 The n-Gram Model inScrabblesque . . . 60
4.4.3 Experimental Methodology . . . 61
4.4.4 Results and Discussion . . . 61
4.5 Prediction inSQ:TG . . . 65
4.5.1 Analytics inSidequest: The Game . . . 66
4.5.2 The n-Gram Model inSidequest: The Game. . . 67
4.5.3 Experimental Methodology . . . 68
4.5.4 Results and Discussion . . . 70
4.6 Conclusion . . . 72
Chapter 5 Bridging the Gap. . . 73
5.1 Introduction . . . 73
5.2 Motivation . . . 74
5.3 The DDBIAG Algorithm . . . 75
5.3.1 Select a Goal State . . . 76
5.3.2 Retrieve Game States . . . 76
5.3.4 Calculate Distance Between Candidate Game States and Goal State
and Select Action . . . 77
5.4 Implementation inScrabblesque. . . 78
5.4.1 Select a Goal State . . . 78
5.4.2 Retrieve Game States . . . 79
5.4.3 Generate Candidate Actions and Resultant States . . . 81
5.4.4 Calculate Distance Between Candidate Game States and Goal State and Select Action . . . 81
5.5 Implementation in SQ:TG . . . 82
5.5.1 Select a Goal State . . . 82
5.5.2 Retrieve Game States . . . 85
5.5.3 Generate Candidate Actions and Resultant States . . . 86
5.5.4 Calculate Distance Between Candidate Game States and Goal State and Select Action . . . 87
5.6 Conclusion . . . 87
Chapter 6 Evaluating Session-Level Retention. . . 89
6.1 Introduction . . . 89
6.2 Analysis inScrabblesque . . . 90
6.2.1 Data Collection . . . 90
6.2.2 Distribution Analysis . . . 91
6.2.3 Analyzing Quitting Rate . . . 93
6.2.4 Individual Feature Analysis . . . 93
6.2.5 Marginalized Distribution Analysis . . . 94
6.2.6 Additional Data . . . 96
6.2.7 Discussion . . . 99
6.3 Analysis in SQ:TG . . . 100
6.3.1 Data Collection . . . 100
6.3.2 Distribution Analysis . . . 100
6.3.3 Quitting Rate Analysis . . . 102
6.3.4 Long-Term Retention Analysis . . . 104
6.3.5 Discussion . . . 104
6.4 Conclusion . . . 105
Chapter 7 Psychometric Side-Effects. . . 107
7.1 Introduction . . . 107
7.2 Psychometric Instruments . . . 108
7.2.1 Intrinsic Motivation Inventory . . . 108
7.2.2 Game Engagement Questionnaire . . . 109
7.3 Psychometric Evaluation inScrabblesque . . . 111
7.3.1 Methodology and Data Collection . . . 111
7.3.3 Analysis of the Aspects of Engagement . . . 112
7.4 Discussion . . . 113
7.5 Psychometric Evaluation inSidequest: The Game . . . 113
7.5.1 Methodology and Data Collection . . . 114
7.5.2 Analysis of Intrinsic Motivation and Engagement . . . 115
7.5.3 Analysis of the Aspects of Engagement . . . 115
7.5.4 Discussion . . . 116
7.6 Conclusion . . . 117
Chapter 8 Conclusions . . . 118
8.1 Summary of Work . . . 118
8.2 Limitations . . . 120
8.3 Impact . . . 121
8.4 Future Work . . . 122
8.5 Concluding Remarks . . . 123
BIBLIOGRAPHY . . . 125
APPENDIX . . . 136
Appendix A A Review of Knowledge Modeling Techniques . . . 137
A.1 Knowledge Tracing . . . 137
A.1.1 Formulation . . . 138
A.1.2 Extensions and Examples . . . 139
A.2 Performance Factor Analysis . . . 141
A.2.1 Formulation . . . 142
A.2.2 Extensions and Examples . . . 143
A.3 Matrix Factorization . . . 144
A.3.1 Formulation . . . 144
LIST OF TABLES
Table 4.1 Summary ofScrabblesquedataset. Games played shows the number of games played in each category. Game length reports the average game length and standard deviation in game turns. Players shows the number of unique players in each category. . . 54 Table 4.2 Prediction accuracies for predicting session-level retention on each turn
inScrabblesque. After the turn 6 the prediction accuracy never increases. Values that are greater than the prediction threshold are bolded. . . 56 Table 4.3 Average percentage of a game spent inwarning statefor each feature in
Scrabblesque. . . 62 Table 4.4 Number of sequences withP(c|i,s)>0.241 in the beginning, middle, and
end of a game ofScrabblesque.Beginningis the first five turns,middleis six through ten, andendis 11 and on. . . 63 Table 4.5 Percentage of values at each position in informative action sequences
for each feature. Position 1 represents the earliest event looked at while Position 3 represents the most recent event looked at. . . 65 Table 4.6 Summary ofSidequest: The Gamedataset. Games played shows the
num-ber of games played in each category. Players shows the numnum-ber of unique players in each category. . . 69 Table 4.7 Percentage of time spent in warning state when completing aquestmarks
the end of a turn across all conditions. Rows in bold indicate that dif-ferences found in this condition were statistically significant (p<0.05) according to a two-tailed, independent samples T-Test. . . 70 Table 4.8 Percentage of time spent in warning state when completing astagemarks
the end of a turn across all all conditions. Rows in bold indicate that differences found in this condition were statistically significant (p <0.05) according to a two-tailed, independent samples T-Test. . . 70 Table 4.9 The number of action sequences that are predictive of players quitting
during each stage ofSidequest: The Game . . . 71 Table 4.10 Percentage of time that an action occurs in a predictive sequence for
each act. Percentages are calculated as the number of times an actiondid appear divided by the number of times that itcouldappear. . . 72 Table 5.1 Transition Matrices forSidequest: The Game . . . 84
Table 6.2 Comparison between the non-adaptive version ofScrabblesqueand the adaptive version ofScrabblesqueusing the DDBIAG algorithm in terms of the number of finished and unfinished games. . . 93 Table 6.3 Number of times that players exhibited the desired behavior for each
analytic as well as the total number of attempts to elicit this behavior in players. . . 94 Table 6.4 K L-divergence values after marginalizing the words submitted analytic.
SinceK L-divergence values differ depending on the order in which a comparison is made, I averaged the results across both directions. Direc-tion 1 refers to the comparison of the adaptive/non-adaptive distribution to the target distribution whereas Direction 2 refers to the comparison of the target distribution to the adaptive/non-adaptive distribution. . . 96 Table 6.5 Comparison between the non-adaptive version Scrabblesque and the
adaptive version ofScrabblesqueusing the DDBIAG algorithm in terms of the number of finished and unfinished games. Updated to reflect the inclusion of additional data gathered from an additional round of data collection. . . 96 Table 6.6 K L-divergence values after marginalizing the words submitted feature.
Updated to reflect the inclusion additional data gathered from an addi-tional round of data collection. . . 97 Table 6.7 The percentage of games that ended in a low, medium, or high number
of turns. . . 97 Table 6.8 The percentage of players that played multiple games ofScrabblesque. . . 98 Table 6.9 Jensen-Shannon divergence values comparing the distributions created
by the adaptive/non-adaptive version ofSidequest: The Gameand the target distribution. . . 102 Table 6.10 Comparison between the non-adaptive and adaptive versions of
Side-quest: The Gamein terms of finished and unfinished games. Also given is the percentage of total games that were unfinished. . . 103 Table 6.11 The percentage of players that completed each stage ofSidequest: The
Gamein the adaptive and non-adaptive versions. . . 103 Table 6.12 The percentage of players that quit at each stage ofSidequest: The Game 103 Table 6.13 The percentage of players that quit at each stage ofSidequest: The Game 104
Table 7.1 The Intrinsic Motivation Inventory. Responses are measured on a 7-point Likert scale with 1 meaningnot trueand 7 meaning tovery true. . . 109 Table 7.2 The Intrinsic Motivation Inventory. Responses are measured using a
Table 7.5 T-Test Results for the comparison of the non-adaptive version of Scrabb-lesqueagainst the version ofScrabblesquewith the DDBIAG algorithm. Results are given for both the IMI and the GEQ . . . 112 Table 7.6 Summary of data and T-Test Results for GEQ Subscales inScrabblesque . 113 Table 7.7 Summary of IMI results inSidequest: The Game. . . 114 Table 7.8 Summary of GEQ results inSidequest: The Game . . . 114 Table 7.9 T-Test Results for the comparison of the non-adaptive version ofSidequest:
The Gameagainst the adaptive version ofSidequest: The Game. Results are given for both the IMI and the GEQ . . . 115 Table 7.10 Summary of data and T-Test Results for GEQ Subscales inSidequest: The
LIST OF FIGURES
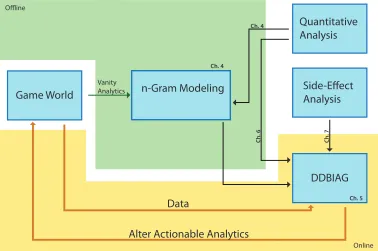
Figure 1.1 A screenshot ofScrabblesque. . . 3 Figure 1.2 A screenshot ofSidequest: The Game . . . 4 Figure 1.3 A visualization of my dissertation. Boxes (excluding the game world)
indicate major contributions. Chapter annotations are given to direct the reader to the appropriate chapter for a contribution. The green area refers to parts of adaption that do not occur during gameplay. The yellow area refers to parts of adaption that happen during gameplay. . . 7 Figure 3.1 A heatmap showing player deaths in a level of Half-Life 2 . . . 43 Figure 3.2 A screenshot ofScrabblesque. The game board has been outlined in red
and the player’s rack of letter tiles has been outlined in blue. . . 45 Figure 3.3 Quest-givers inSidequest: The Game. For ease of understanding,
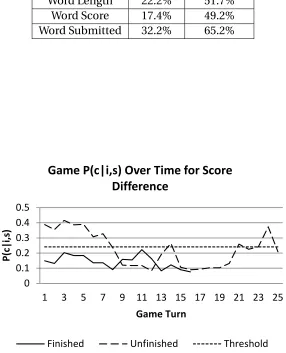
charac-ters that have quests to offer the player are circled in yellow. The player is circled in blue. . . 48 Figure 4.1 Probability the player will quit playingScrabblesquebased on the score
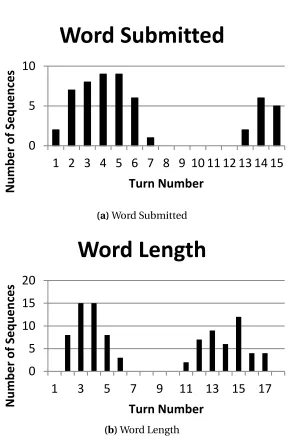
difference feature. The short dotted line is the baseline, the solid line is the probability of the player eventually quitting at each turn for an example finished game, and the long dotted line is the probability of the player eventually quitting at each turn for an example unfinished game. 62 Figure 4.2 Turn histograms for the word submitted and word length analytics in
Scrabblesque. This shows how many predictive sequences were found on each turn. . . 64 Figure 5.1 A flowchart showing the execution of my algorithm. First, a goal is chosen.
Then, instances of this goal are found in the knowledge database and used to evaluate a set of candidate actions. . . 76 Figure 5.2 Target Distributions of Actions for Each Stage inSidequest: The Game . . 83
Figure 6.1 Direct comparisons between the target distribution and the adaptive distribution using my algorithm and non-adaptive distribution. Each graph shows probabilities for each possible feature combination. The adaptive distribution appears to be shifted slightly, but overall matches the target distribution more closely than the non-adaptive distribution. 92 Figure 6.2 Direct comparisons between the target distribution and the adaptive
Figure 6.3 Replicated comparison between the target distribution and the adaptive distribution using my algorithm and the non-adaptive distribution after theword submittedanalytic has been marginalized out with additional data. . . 98 Figure 6.4 Comparing the target distribution to the distributions created by the
adaptive and non-adaptive versions ofSidequest: The Game. . . 101
Figure A.1 A DBN representing student knowledge over time. Boxes with dashed out-lines indicate hidden nodes in the graph while boxes with solid outout-lines represent observable nodes in the graph. . . 138 Figure A.2 A DBN showing the initial student knowledge node added in. In the
model put forth by Pardos and Heffernan, there would be an initial knowl-edge node for each student that could be modeled. . . 140 Figure A.3 An example of using matrix factorization for student performance
CHAPTER
1
INTRODUCTION
1.1
Introduction
The goal of my research is to show how data-driven techniques can be used to dynamically adapt game content to bring about certain player behaviors in casual games. In particular, I am interested in increasingsession-level player retention. Session-level player retention refers to the number or percentage of players that successfully complete a game session. Based on this goal, the thesis statement for this dissertation is as follows:
Thesis Data-driven techniques can be used to bridge the gap between the predictive power of vanity analytics and the prescriptive power of actionable analytics to dynamically adapt game experiences in order to increase session-level retention in a variety of casual game environments through altering analytic values.
for modeling, but they are often difficult to directly influence. From this thesis statement, I have determined that there are two questions that I must answer.
1. How can I incorporate bothvanity analyticsandactionable analyticsinto a dynamic game adaption technique that manages to bridge the gap between these analytics?
2. Will this technique be powerful enough to increase session-level player retention in different casual game environments?
In order to answer these questions, my work proceeds in three phases. During the first phase of research, I use a set of vanity analytics to create predictive models of session-level retention. During the second phase of research, these models are incorporated into a dynamic game adaption algorithm to create adaptive user experiences. During this phase of work, the fundamental gap that exists between vanity analytics and actionable analytics must be bridged in order to generate the adaptive experiences that I desire. At a high level, this is done by dynamically altering a set of analytics that are associated with session-level retention. The final phase of my research involves determining the quality of my game adaption algorithm by quantitatively evaluating session-level player retention in multiple game environments.
To address external validity, I have chosen to study two different game environments of varying complexity. The first is a simple game environment based on the board game Scrabble, which I have namedScrabblesque(Figure 1.1). The second, namedSidequest: The Game(SQ:TG) is a game environment in which the player completes various quests in order to advance to the end of the game (Figure 1.2). I have chosen these two environments because they represent two very different, yet very common, game genres: casual puzzle games and casual adventure games. They also present varying degrees of complexity with respect to AI that the user plays against, the amount of player interaction available, and the amount of control I have over the game world. By examining these two game environments, I show how well my technique generalizes to different game genres.
1.2
Motivation
Figure 1.1A screenshot ofScrabblesque
1.2.1
Data-Driven Game Adaption
Figure 1.2A screenshot ofSidequest: The Game
example, has been shown to have little correlation with actual behavior (Gross and Niman, 1975). As for the use of knowledge engineering, the quality of a model or adaptive game environment is completely dependent on the quality of the knowledge used to build this model. If the creator of the model or the environment is using flawed knowledge during the creation process, then the quality of the product will suffer.
I feel that the use of data-driven techniques addresses these issues by simply removing the human element from the problem. By using data-driven techniques, I ensure that the behaviors that I model are grounded in the data that players actually produced. In addition, data-driven techniques can help motivate the types of adaptions that need to be made as they will arise organically from player data. Currently, there has been little work done on using data to create adaptive game environments. The goal of this work is to show that data-driven algorithms can be used during both behavior model creation and actual game adaption to create an adaptive game environment that increases session-level retention. To accomplish this goal, I first need to bridge the gap betweenactionable analyticsand vanity analytics.
1.2.2
The Gap Between Actionable And Vanity Analytics
time. Vanity analytics have a large amount of predictive power; however, they often cannot be directly affected. This is usually because vanity analytics deal with the intangibles of a system. In terms of game environments, the greatest intangible of all is the player and which behaviors the player will exhibit. This means that often times researchers will use vanity analytics to construct computational models of player behavior, which is understandable since they can provide excellent insights into the workings of player behavior. The problem with this is that it is difficult to use these models since, in practice, their analytics are very rarelyactionable. Actionable analytics are those thataredirectly affectable by an entity such as the game designer, developer, or in my case, an autonomous AI agent. Actionable analytics, contrary to vanity analytics, are more difficult to use in modeling player behaviors since they often do not capture the context in which the player is acting.
This fundamental difference between actionable and vanity analytics leads to a gap in knowledge that needs to be bridged in order to create a data-driven, dynamic game adaption algorithm. To better illustrate this gap, I will use an example grounded in American politics. In this example, consider a politician running for office. When a politician is running for office, public opinion polls are often used to determine how well the candidate is performing. In general, these polls can be used to predict the outcome of an election as the candidate that is rated higher in the polls usually wins. The candidate, however, cannot directly manipulate the value of the polls. There is no direct cause and effect relationship between any action available to the politician and their standing in the polls. What the politiciancando, however, is distribute money in an attempt toindirectlyinfluence the polls. In this example, the polls are a vanity analytic describing the current state of the election. The polls have a great amount of predictive power, but they contain very little prescriptivepower since it is unclear what actions need to be taken in order to directly affect poll values. How and where the politician spends her money, however, is an example of an actionable analytic. This is not necessarily a good predictor of the outcome of the election, but it is something that the politician has complete control over.
1.2.3
Session-Level Retention
As casual games continue to grow in popularity, the importance of understanding player retentiongrows immensely. The term retention has many definitions, but in games the retention rate is often used to refer to the percentage of players that continue to play a game after a certain period of time. Player retention is important to game designers for several reasons. It can be used to determine how successful a product was or how successful future produces may be. It could be used to determine the health of a community in the case of multiplayer games. For casual and social games, retention is especially important because almost all of their revenue off of a game comes from in-game purchases (often referred to asmicrotransactions) or from in-game advertisements (Fields, 2013).
Typically, game designers attempt to optimizelong-term retention. Long-term retention typically involves getting players to play a game over several months or even several years. There has been much work on what affects long-term retention in games and what aspects of game design can influence long-term retention. In this dissertation, I choose not to focus on long-term retention in favor of exploring what I callsession-level retention. Session-level retention rate refers to the percentage of players that complete agame session. Most casual games have a clear beginning and a clear end to a game session. In puzzle-games, completing a level or a set of levels may constitute the end of a game session. In an adventure game, completing the list of available quests for the day could constitute the end of a game session. In casual games that are more open ended, such as Farmville, a game session could be defined as performing all actions that are allowed before leaving the game. In casual games, maximizing the number of players that complete a game session is especially important since many casual games offer players a chance to extend game sessions through the use of microtransactions, meaning that players have to make it to the end of a game session to take advantage of this type of offer.
1.3
Summary of Dissertation
n-Gram Modeling
DDBIAG Game World
Quantitative Analysis
Side-Effect Analysis
Alter Actionable Analytics
Online
Data
Vanity Analytics Offline
Ch. 4
Ch. 4
Ch. 5
Ch. 7
Ch. 6
Figure 1.3A visualization of my dissertation. Boxes (excluding the game world) indicate major contributions. Chapter annotations are given to direct the reader to the appropriate chapter for a
these models are used as inputs into an experience management system (DDBIAG in the figure), which is used (in combination with data received from the game world), to make changes to the game world by altering the values of actionable analytics that describe said game world.
Using this figure as a guide, I will now go over each part of my dissertation in greater detail.
1.3.1
n-gram Models for Session-Level Retention
Recall that the first step in creating an adaptive game environment is to create a model of player behavior. During this step, I leverage the predictive power of vanity analytics to create models of player behavior.
For this, I use ann-gram model to calculate the probability that players will quit the game early.n-gram models assume that the current observation (in this case, an observation would be a player action) depends only on the previousn−1 actions. These models have been used frequently in text mining and classification. More recently, they have been shown to be effective in predicting goals in interactive narrative environments (Mott et al., 2006). Due to their success in these other fields, I choose to usen-grams to model session-level player retention. In particular, I am interested in determining what specific action sequences are associated with session-level retention. A more in depth discussion of this model is given in Chapter 4.
1.3.2
DDBIAG
At a high level, the DDBIAG algorithm usesbackwards induction(Von Neumann and Morgenstern, 2007) in order to select adaptions. Backwards induction is a technique for selecting the optimal sequence of actions to reach a goal state by selecting the action that should be performed immediately preceding the goal state. How this translates into game adaption is that my system chooses the action that moves the game world closest to the intermediate goal state chosen by the experience manager. This system is discussed in detail in Chapter 5.
1.3.3
Quantitative Evaluation
Each piece of work that I have discussed up until this point will be subject to a quantitative evaluation. The evaluation of the player models that I have created (Chapter 4) will evaluate the predictive power of my models. The evaluation of the DDBIAG algorithm (found in Chapter 6) will evaluate whether or not it is able to influence player behavior and influence session-level retention. In this evaluation, I will be comparing the behaviors observed in a game environment that has been augmented with my experience manager against a game environment with no experience management system present.
1.3.4
Psychometric Side-Effects
While the primary goal of the DDBIAG algorithm is to increase session-level retention, it is important to consider the possible side-effects that this system could have. Ideally, my adaptive game environments should increase session-level retention without adversely affecting the play experience. During this evaluation, I measure the effect that the DDBIAG algorithm had on two psychometrics describing player experience. The first of these is intrinsic motivation. Intrinsic motivation is defined as motivation based on the inherent satisfactions derived from action (Ryan and Deci, 2000). To test this, I will use a subset of the questions available from the intrinsic motivation inventory (IMI).
The second psychometric that I want to study is engagement. The game engagement questionnaire (Brockmyer et al., 2009) is a questionnaire that measures several aspects of player engagement (such as flow or presence) in order to create a unified idea of a player’s engagement during a game. Using this questionnaire, I plan to measure the differences in player engagement across all experimental groups.
algorithm had on these psychometrics describing player experience. While it would be ideal if the DDBIAG algorithm was able to somehow increase both intrinsic motivation and player engagement, it will be sufficient if the DDBIAG algorithm is able to increase player retention while still maintaining the same level of player engagement and intrinsic motivation present in a non-adaptive version of the same game. More details on this evaluation can be found in Chapter 7.
1.4
Overview of Game Environments
In order to better understand the behavior models that I build and how they are used to create game adaptions, it is important to better understand the game environments that I will be working in and the types of analytics that I will be working with. In the next sections, I will introduce bothScrabblesqueand SQ:TG and describe the types of analytics that are gathered during gameplay.
1.4.1
Scrabblesque
Scrabblesqueis a Flash game that is a modified version of the popular board game,Scrabble. Scrabblesquesimulates a casual game environment by providing players with a limited number of possible actions and a limited amount of ways to interact with the game. It is also relatively simple to begin playingScrabblesqueand quite simple to end the game. The main difference betweenScrabblesqueand an actual social game is that the player does not play against another human, but rather competes against a computer-controlled AI. Also, the game ends when either the player or the computer-controlled AI reaches 150 points.
Scrabblesqueis designed to log several low level features of gameplay. These features are:
• Mouse Presses and Releases: The x and y coordinates of mouse presses or releases
• Player Words and Score: The word that a player played as well as that word’s point value
• Computer Words and Score: The word that the computer played as well as that word’s point value
• Computer Word Location: Where on the board the computer played a specific word
• Player Rack Status: The current tiles in the player’s rack of letter tiles
• Game Beginning and End: When the player begins and ends a game as well as that game’s outcome
Notice that I am logging a combination of vanity and actionable analytics in this game. Analytics such as the word a player played and its resulting score value are vanity analytics since they are beyond our control but very useful for modeling. That being said, the words that computer played and their score value are actionable analytics since both of these values are under control of the AI, and therefore, subject to any alterations that an experience manager wants to make.
1.4.2
Sidequest: The Game
The second game, Sidequest: The Game(see Figure 1.2), is a 2-dimensional adventure game coded in Flash in which the player takes control of a nameless hero with the goal of becoming an adventurer. The hero is free to explore the world and is able to talk to friendly non-player characters (NPCs) to receive quests and can engage in combat with enemies by firing a stream of arrows at them. The goal of the game is to complete three gamestagesby completing 3 quests in each stage. During each stage of the game, different quests are available to the player. Each stage contains 10 unique quests which are randomly distributed to NPCs throughout the world. In other words, each quest-giver is given a random quest to present to the player, meaning that the experience differs from player to player. In total, there are 30 possible quests for the player to complete. In order to advance to the next stage, the player must complete 3 quests out of the 10 that are possible for their current stage. Once the player has finished 3 quests, it is not possible to accept any other quests. This means that a player that completes the game will finish a total of 9 quests.
Although there are 30 unique quests in the game, there are only 7 possible types of quests:
• Kill Quests: Quests requiring the player to kill a certain number of enemies
• Escort Quests: Quests requiring the player to find a friendly NPC and then bring them back to the quest-giver
• Item Retrieval Quests: Quests requiring the player to retrieve an item in one part of the world and bring it back to the quest-giver
• Item Drop Quests: Quests requiring the player to kill monsters until they drop an item that the player must return to the quest-giver
• Riddle Quests: Quests requiring the player to answer a riddle in order to complete the quest
• Conversation Quests: Quests requiring the player to use knowledge of an NPC’s likes and dislikes to navigate a conversation with them
Throughout the course of the game, the player can accept quests any number of possible quests, but they can only have one active quest at a time. If a player wants to change quests, they need only abandon their current one and then accept a different one from a different quest-giver. Players are also free to reject any quests that do not sound appealing to them from the text description of them. This was done to give the player the freedom to perform the types of tasks that they enjoyed and still give us an idea of what specific goal they are working toward. In this way we avoid having to solve the goal recognition problem (see Chapter 2). It was also possible for a player to, in some special cases, fail the quest they were on. In the case of riddle quests and conversation quests, it was possible to explicitly fail by selecting incorrect choices. It is possible to fail on every other quest by dying while on a quest. If you fail a quest, it is possible to pick up the same quest again for another chance at completing it.
The game logs several low-level and high-level features about gameplay. These features include:
• Keyboard Presses and Releases: The key that a player presses or releases and the time that it happened
• Quests Accepted: Which quests the player has accepted and when the player accepted them
• Quests Rejected: The quests that were offered to the player but not accepted and the time the player rejected each quest
• Quests Completed: The quests the user finished and when the player finished them
• Deaths: The number of deaths the player experienced as well as where in the world the player died, quest the player was on, and cause of death
• Monster Kills: The number of monsters killed by the player, time each monster was killed, and where each monster was killed
• NPCs Talked To: The NPCs talked to as well as the current quest of the player, the NPC’s location in the world, and the time the player talked to the NPC
• Quest Proximity: The how close each quest-giving NPC is to the player at any given time
All of these analytics are vanity analyticsexceptfor Quest Proximity. It is feasible for the AI to control, to some degree, how close certain quests are to the player. As such, this is an actionable analytic.
1.5
Conclusion
In this dissertation, I will show how vanity analytics can be used to model and predict session-level retention in bothScrabblesqueand SQ:TG. In addition, I will provide a tech-nique for bridging the gap between vanity and actionable analytics such that the predictive power of vanity analytics can be used by the DDBIAG algorithm to generate dynamic game adaptions. The contributions of this dissertation include:
• Designing algorithms that use vanity analytics to create computational models of session-level retention in games
• Creating a data-driven technique to bridge the gap between vanity and actionable analytics in order to dynamically adapt game environments to increase session-level retention
• A quantitative evaluation of the effectiveness of my techniques at increasing session-level retention in two game environments
• A psychometric evaluation of the side-effects of my dynamic game adaption tech-nique on player experience in two game environments
CHAPTER
2
BACKGROUND AND RELATED WORK
2.1
Introduction
This chapter will survey literature relevant to my dissertation research. I begin by discussing topics related to modeling behavior in games. In this section, I review literature relevant to behavior modeling including literature on modeling retention,n-gram models, and knowledge modeling. I will also review techniques that have been used to adapt/personalize content in different forms of media (specifically in narratives and games). I will conclude with a discussion of background literature for intrinsic motivation and engagement since these are the two psychometrics that I will be measuring in Chapter 7.
2.2
Modeling
security, and other fields. As such,user modeling, creating computational models that describe and predict how users will behave, has been a rich topic for many years. In the following sections, I will review literature that discusses how user modeling has been used both in games and in other fields.
2.2.1
Modeling Retention
As the goal of my research is to develop a technique for increasing session-level retention through dynamic game adaptions, it makes sense to begin with a discussion on the existing work that has been done on retention. Included are discussions of retention research in games and in other areas.
2.2.1.1 In Games
The ability to accurately predict player retention has long been sought after by both games researchers and game designers. As such, there has been a great deal of research on player retention from both game researchers and game designers. That being said, the research that has been done has focused mainly onlong-term retention, player retention over a game’s lifetime, whereas my work focuses onsession-level retention, player retention over a game session.
Tarng, Chen, and Huang (2008) studied the play tendencies of 34,524 World of Warcraft players during a two year period to determine if there are any indicators that a player would quit playing. They determined that while predicting a player’s short term behavior is feasible, predicting long term behavior is a much harder problem. Tarng, Chen, and Huang (2009) performed a follow-up study on a different MMORPG using support vector machines (SVMs) as their predictor. They concluded that it is possible to predict when a player will quit in the near future as long as they do not possess wildly erratic play behavior.
as interceptions). The authors used a similar technique in infinite Mario to rank features based on their influence over player retention.
Similarly, Debeauvaiset al.(2011) examined how various demographic factors affected retention in World of Warcraft. In this work, the authors examine how various demographic factors such as age, gender, marital status, and self-identified motivations correlated to the number of hours played per week, whether or not they would take an extended break from the game, and how long they had been playing the game. In addition, they also measured how the social aspects of the game correlated to these retention metrics. While the authors did not specifically seek out to predict retention, the authors did identify several factors that are correlated to long-term retention.
This work was extended in (Debeauvais et al., 2014) where the authors predict retention on a month-by-month basis. In this work, the authors incorporate demographic informa-tion, as before, but this time include data on player region (such as China or the United States) as well as progression information. Progression was defined in terms of how far players (or at what rate players) made it through end-game content. They used a simple regression model to predict whether players would quit playing after a month. The results of this study were questionable as the authors achieved very high recall, but very low precision. This means that they predicted that several players that actually kept playing the game would quit.
There has been a recent trend in retention analysis that involves using social networks to aid in prediction. The theory behind these techniques is that players are more likely to quit playing games if other members of their social network quit playing as well. Similarly, if sev-eral members of a player’s social network continue to play a game, it is likely that this player will continue as well. Kawaleet al.use this theory as the basis for their work in predicting retention in Everquest II (2009). This work consists of using amodified diffusion model (MDM) to determine how the probability that a player will quit affects the probability that players in their social network will quit. This model also incorporates player engagement (defined as the amount of time a player spends in the game) into the calculations done to predict whether a player will quit. Results showed that the authors’ MDM outperformed techniques that used solely social network information or engagement information for predicting retention.
ap-proach is one that is based on an underlying theory. In this case, that underlying theory is motivation theory. Thus, the authors used individual player motivations to determine if they would continue playing Everquest II or not. In this work, they found that data-driven models often produce more accurate models; however, they claim that the theory-driven models are often much simpler and are easier for domain experts or game designers to understand. This work is significant in that the authors recognize that data-driven models are often difficult to interpret, which can make it difficult to use them as the basis for changes to the game.
In the realm of social and casual games, Linet al.(2013) studied the reasons that players start and stop playing a Chinese, social network RPG. They used survey data to examine what motivates players to begin playing a social game and what factors influence their decision to either keep playing or quit. What they found was that social interaction was often not a factor in a player’s decision to keep playing. They found that players that kept playing stayed because they enjoyed progressing through the game. It was this sense of achievement that kept them going. Also, they found that boredom was the leading cause of players quitting. This is contrary to the popular belief that social interactions are what drive retention in social games.
Kuoet al.(2009) explored how the difference in game communities can affect player retention. This work examines how two social games that were distributed to different web communities performed in terms of various retention metrics. They found that both games experienced similar retention rates, but mainly differed on the amount of players that played each game. This was most likely due to the fact that one of the games had a preexisting community of players whereas the other had to build the community from the ground up. These results imply that different communities might not have a large impact on retention rates, but a preexisting community can be very important for getting more people to play a game.
Andersenet al.(2011) showed that the presence of secondary objectives can lead to players leaving the game prematurely. They showed this by examining the play times of players when playing a casual game that had secondary objectives (in this case, coins the players could collect) versus players when playing a casual game that had no secondary objectives. They showed that there was a noticeable difference in the amount of players that played the game for long amounts of time.
and predict player retention across different game genres. Despite these differences, they are alike in that many of the models produced using these techniques are notactionable. This means that the insights gained from these models do not lead to clear actions that need to be taken to influence behavior. For example, social network analysis tells us that players will play longer if people in their social networks play as well. This statement gives game designers a great deal of insight into what motivates people to keep playing a game; however, it does not say how exactly one might get people in their social networks to keep playing. This further reinforces the need for a technique to bridge the gap between vanity and actionable analytics so that the insights made using these types of models can be used to improve retention where necessary.
2.2.1.2 Outside of Games
There has also been much work done on modeling retention in areas outside of games. In 1997, Hennig-Thurau and Klee (1997) put forth the notion that customer retention is a product of customer satisfaction that is moderated byrelationship quality. Relationship quality was defined as a 3-dimensional variable that includes the customer’s perception of product/service quality, the customer’s trust, and the customer’s relationship commitment. This was a very early notion of what factors impact retention in a business setting. Theo-retically, these insights could apply to any field in which people offer goods or services to others.
Jolleyet al.(2006) challenge this view of retention and argue that customer satisfaction is not important if buying habits have already been established. In particular, the authors study how efforts to improve online gambling services effected retention. Their results show that increasing user satisfaction had little effect on customer retention, whereas their frequency of past behavior was a much more influential.
In an effort to further augment the view of customer retention as a function of customer satisfaction by examining howswitching barriersaffect customer defection. Switching barriers are things that make it difficult to switch from one product to another. Examples include interpersonal relationships, perceived switching costs, and the attractiveness of al-ternative products. The authors used a survey measuring switching barriers combined with logistic regression to determine that switching barriers along with customer satisfaction was important to explaining customer retention.
terms of “next buy” actions) for a large European financial services company. They found that random forests perform better on this data than logistic regression. They also found that past customer behavior as well as demographic information such as age are strong predictors of retention; however, they found that gender as well as geographical information were not as effective at predicting customer retention.
Support vector machines (SVMs) have also been used to predict customer retention in telecommunications. Zhaoet al.(2005) use an improved one-class SVM (Schölkopf et al., 2001) to predict customer retention based on demographics, quality of service, and the features of each customer’s subscriber plan. They found that their improved SVM was able to outperform neural networks, decision trees, and naive Bayesian networks on this dataset.
As with retention in games, there has been a recent trend in using social network analysis to predict retention. Dasguptaet al.(2008) examine how social influence can affect retention in mobile phone networks. This is done by using a diffusion-based approach which models customers discontinuing their service as having a set amount ofinfluenceover members of their social network. As customers discontinue their service, their influence spreads to others in their social network, which is likely to make them also stop their service. In practice, the authors were able to identify a significant fraction of the customers that were lost in a single month.
While these models and techniques can effectively predict retention in a variety of environments, their insights, as they were in games, are not actionable. The ability to predict losing a customer is half of what is necessary to actually retain that customer. Once they have been identified, steps must be taken to keep people from switching services. Since these models are typically based on customer behavior or demographic information, it is very difficult to translate any insights contained in these models into a clear set of steps that need to be taken to retain customers.
2.2.2
Modeling Behavior
2.2.2.1 Modeling Behavior in Games
One of the earliest attempts to build models of human behavior for games came in 1996 when Richard Bartle (1996) created his four player types (Achievers, Socializers, Explorers, and Killers) by observing player responses to what their favorite parts of a multi-user dun-geon (MUD) were. These player types each refer to a different aspect of a game that players could prefer to do.Achieversare players that are concerned with completing objectives explicitly outlined by the game, such obtaining the best items or reaching a higher level. Socializersmostly play a game in order to interact with other people.Explorerswant to see all aspects of the game world. It is important to note that this extends beyond simply exploring the game world map.Explorersoften will try to find peculiarities with game me-chanics or the game engine itself. Lastly,killersare players that mainly want to disrupt the gameplay experience of other players. These models were based entirely on observational data gathered from the message board associated with the MUD in question. From this observational data, Bartle also proposed how each of these player types interact with one another. For example, increasing the amount of socializers in a game will lead to an increase in the amount of killers in the game.
In 2006, Nick Yee (2006) empirically tested Bartle’s player models by creating a survey based off of these player models. This survey was then given to 3, 000 players and then used in a principle components analysis to group the answers. As a result of this PCA, three overall player types emerged: those concerned with achievement, those concerned with socializing, and those concerned with game immersion. The achievement player group is similar to the achievers put forth by Richard Bartle. They are mainly concerned with gaining power and advancement. In addition, this player type encompasses players that are concerned with competition and competing with others. The social player group is also very similar to Bartle’s socializers. The immersion player group contains people that are mainly concerned with discovery and the story of the world around them. It also contains people that are concerned with role-play and the story of their characters.
correspond to certain questions or the facets of extroversion that those questions were meant to measure. It is important to note that these models were to be used to determine if in game actions correlate to player personality. It was shown that this is possible for extroversion. It was also shown that some of the in-game tasks did not correlate with the facets of extroversion that they were meant to measure.
Sharmaet al.(2010; 2007) also created a hybrid method by combining game traces along with player survey data in order to create player models using case-based reasoning. In their method, the model creation module monitors a player’s progress through the game and tries to match their progress with a game trace that has already been seen. This is then used to infer how enjoyable the current player will find the game. Once the current player has been matched with a previous player, the current player’s enjoyment is measured by using the previous player’s survey responses. This technique bears resemblance to the theory behind collaborative filtering techniques (Su and Khoshgoftaar, 2009) used in recommender systems.
The previous approaches were based primarily on author observation and player self-report data. My approach to model creation differs from these approaches in that I choose to examine player behavior directly rather than rely on surveys and other self-report data. By using a data-driven approach, I avoid any biases that may be introduced via social desirability or the player simply not being able to accurately describe their own behavior. Another approach to player modeling is the approach taken by Thueet al.(2008; 2007) in the PaSSAGE system. In this system, actions are annotated as to what type of player is more likely to perform them. For example, an aggressive player is more likely to fight when given the choice. As a player moves through the game, the collection of their actions and the annotations combine to form a player model. The player types used in this system were the ones introduced in Laws’ guide for pen-and-paper role-playing games (Laws, 2001). This approach relies on knowledge engineering as it depends on using predefined annotations to develop their player models. Also, this model assumes that the types developed for a pen-and-paper RPG will translate into a virtual environment.
cameras, and moving silently. All of these concrete behaviors would fall under the abstract behavior ofbeing stealthy. As the player performs more of these concrete behaviors, their being stealthyscore will increase. This approach also incorporates knowledge engineering because the tree structure must be known beforehand and is often created using author or expert knowledge.
Some researchers have chosen to create player models that only fit a very narrow sce-nario. In Brian Magerko and John Laird’s Interactive Drama Architecture (IDA) (2003), player modeling is done with respect to the goals that the story has laid out. The player models are only able to determine if a player will advance to the next plot point within a given amount of time; however it is rather simplistic in its construction because it only uses the current player’s past performance as the basis of this model. This model also uses an internal probabilistic rule-based model to determine the probability that a player will com-plete a story task (Magerko, 2006). This model must be defined beforehand by the author since it is domain-dependent. Hence, this technique relies on knowledge engineering to be constructed.
The main disadvantage of using these types of techniques is that they require the author of the model to have correct knowledge about how players will behave in a game environment. If this knowledge is incorrect, then the quality of the model can suffer greatly. There has been work done on using observed user models generated in other environments to inform models that are generated using knowledge engineering (Roberts and Roberts, 2011), but it is not yet clear when this technique is the most applicable. As such, I still feel that examining data directly provides the safest means for making quantitative statements about player behavior since they are all based off of behaviors that I have observed.
The methods mentioned previously have been based on small-scale data collection experiments or knowledge engineering. Drachenet al.(2009) created player models for Tomb Raider: Underworld by examining various statistics gathered from 1365 players. The authors extracted 4 features of gameplay that they used to create these behavior models. The features extracted were
• Cause of death: Each death is annotated with what caused it (hostile NPCs, environ-mental effects (traps), or falling)
• Total number of deaths: The total number of times the player died for any reason
• Help on demand: The number of times the player uses the in-game help feature for solving puzzles
Their method uses emergent self-organizing maps (ESOMs) (Kohonen, 2001) to cluster the data. It is important to note that the statistics gathered from players were high-level descriptions of play and could not be used to predict individual actions. From their analysis, the extracted 4 player types from the data. The first of these contain players that complete the game very quickly and do not use the in-game help option very often. These players were labeledveterans. The second group extracted contained those players that died quite often and did not finish the game very quickly; however, these players did not ask for in-game help very much. These players were labeledsolvers. The third, and largest, player type contains those players that die most frequently from enemies. These people are labeled aspacifists. The final player group, labeledrunners, contain players that die most often from enemies or falling, but finish the game very quickly. It is important to note that the labels assigned to these groups actually have no bearing on the behaviors exhibited by these players, and are only done to increase understanding of the groups after the fact.
Shimet al.(2009; 2010; 2010) created models of player behavior for Everquest II using techniques used in home run prediction. Their model is created by examining the level-ing speed of a character in the past in order to determine how long until the character reaches the next level. The two algorithms that they use to perform these predictions are PECOTA (Silver, 2003) and MARCEL (Tango, 2004). PECOTA works by finding thenearest neighborto the current player in order to predict their performance. In other words, it finds players with similar past performances and uses those to make statements about the current player and his or her future performance. The MARCEL algorithm examines the past 3 years of player performance and attempts to extrapolate forward from there. It is important to note that this technique only examines one player at a time, and does not take into account any data gathered from any other players.
while closing off the opportunity to explore others. To create this player model, 100 random story traversals are made to determine which plot points are likely to be performed.
Zooket al.use a tensor factorization technique to predict a player’s mastery of a skill in both military training scenarios (2012) and in a game that emulated the combat system used in a turn-based role-playing game (2012). This technique uses a player’s past performance at various skills and then predicts what their future performance will be. In this work, this knowledge was then used to generate missions that would effectivelyteachthe user how to use a certain skill, making this type of technique very useful for an adaptive help system.
Yu and Riedl (2012) apply prefix-based collaborative filtering to a Drama Manager which makes plot decisions in narrative games. The Drama Manager makes decisions about which plot points to include in the story and their ordering.
Li and Shi (2013) use collaborative filtering to recommend items in item stores and also models the satisfaction that is associated with said item purchase. The authors use an analytic hierarchy process combined with an improved ant colony optimization technique in order to quickly converge upon possible recommendations to make. On a similar note, ThaiSon and Siemon () used collaborative filtering to recommend wiki pages for users to visit based on their play in MMOGs. It is important to note, however, that this method was only used to cluster and make recommendations about websites related to an MMOG and did not take into account the player’s actions in-game. This type of system could feasibly be used to intelligently guide players to third-party sources of information about a game. Unlike many of the other data-driven techniques for player modeling, my technique is used to determine which sequences of actions are predictive of certain behaviors. In many other data-driven player models, the end-goal of the model is the prediction itself. My technique wants to identify what the predictive action sequences are. This is because my models are meant to be used in an adaptive system, which means that prediction on its own is not enough. If I have a model that can predict player type, it does not give any insight on how the game environment should be adapted for this player. Since my model focuses on identifying predictive action sequences, it is easier to translate these insights into in-game adaptions to the environment.
2.2.2.2 Modeling Behavior Outside of Games
fields. As such, I have chosen to limit my discussion to models that are generated using some of the more popular data-driven techniques.
Decision trees are a simple modeling technique that have the added advantage of being relatively easy to understand. Paliouraset al.(1999) used decision trees to predict user stereotypes, which in this case where the types of news articles that the user was most interested in. In this work, decision trees were used to predict which type of news articles people would most enjoy based on the department in which the user is working, the type of industry in which the user is working, the size of the company they work for, the location of said company, and the location of the market of the company. They received promising results, but claim that their models were not generalizable.
Along a similar line of research, Zhuet al.(2003) used decision trees to model whether certain websites would be useful to a user for completing a specific task. In this case, the task was travel planning. In this work, users would use a web browser that was augmented to allow them to record whether or not the current website they were looking at was relevant to their task. Using these ratings, the decision tree would make predictions based on the users past ratings and characteristics of the web sites that the user visited in the past.
Becket al.(2003) use decision trees in order to predict whether or not a student will ask for help on certain words in an intelligent tutoring system for reading. To do this, the authors created a set of features about each word in a set of stories that the students were required to read. These were features such as the length of the word and how often it appeared in the story. They also included information about the word’s placement in sentences. Student information such as gender, and grade was also considered. They tested this decision tree under two conditions: using data obtained from a group of students to predict whether an unknown student would require help and using a student’s own data to predict whether they would require help. They found that decision trees performed well in both cases, but were especially suited to making predictions using a single student’s data.
Bayesian networks have also frequently been used to model behavior for various pur-poses. Horvitzet al.(1998) used a Bayesian network to model users interacting with Mi-crosoft Excel. In particular, they predict when a user might possibly require assistance with the program. They also predict what type of assistance is necessary given that assistance was desired.
approach. The authors found that while the naive Bayesian network was simple, it was still able to outperform the correlation-based approach on this dataset.
Lau and Horvitz (1999) use Bayesian networks to predict various aspects of a user’s web search habits. In this work, they use Bayesian networks to infer the probability of a user’s next action, the time delay before taking the action, and the user’s informational goal.
Gershmanet al.(2011) use support vector machines to recommend news articles to users based on their browsing history. The authors divide the user’s browsing history into positive and negative examples based on whether or not an article was read or not and use these to train an SVM classifier. This classifier is actually used to determine what the user’s current news preferences are. It then uses this classification to find a set of articles that match these preferences and then generates a set of recommendations.
2.2.3
n-Gram Modeling
As I mentioned in Chapter 1, I use ann-gram model of player actions to predict session-level retention (which is discussed in greater detail in Chapter 4).n-gram modeling is a common statistical modeling technique wheren past actions are used to predict future actions. These models make use of the Markov assumption that the current action depends only on then−1 previous actions that were taken. Although these models are relatively simple, they have been used in many fields. In the following sections, I will discuss how other researchers have utilizedn-gram models in games and outside of games.
2.2.3.1 n-Gram Modeling in Games
Whilen-gram modeling has not seen extensive use in games, it has been used frequently as the basis foraction prediction(Millington and Funge, 2009). Action prediction, in the context of a game, is predicting what specific behavior a player (or even an NPC) will perform next. Actions could be things such as attacks in a fighting game or completing a quest. Francois Laramèe (2002) proposed using this technique for use in a fighting game for predicting which attacks a player is likely to perform based on their past history of attacks.