University of Windsor University of Windsor
Scholarship at UWindsor
Scholarship at UWindsor
Electronic Theses and Dissertations Theses, Dissertations, and Major Papers
1-1-1966
Avoidance conditioning in goldfish as a function of CS-UCS
Avoidance conditioning in goldfish as a function of CS-UCS
intervals using a delay and a trace training procedure.
intervals using a delay and a trace training procedure.
Lepa Tomic
University of Windsor
Follow this and additional works at: https://scholar.uwindsor.ca/etd
Recommended Citation Recommended Citation
Tomic, Lepa, "Avoidance conditioning in goldfish as a function of CS-UCS intervals using a delay and a trace training procedure." (1966). Electronic Theses and Dissertations. 6454.
https://scholar.uwindsor.ca/etd/6454
AVOIDANCE CONDITIONING IN GOLDFISH AS A FUNCTION OP CS-UCS INTERVALS USING A
DELAY AND A TRACE TRAINING PROCEDURE
by LEPA TOMIC
B.A., Mount St. Agnes College, Baltimore,
1964-A Thesis
Submitted to the Faculty of Graduate Studies through the Department of Psychology in Partial Fulfillment
of the Requirements for the Degree of Master of Arts at the
University of Windsor
Windsor, Ontario, Canada
UMI Number: EC52635
INFORMATION TO USERS
The quality of this reproduction is dependent upon the quality of the copy
submitted. Broken or indistinct print, colored or poor quality illustrations and
photographs, print bleed-through, substandard margins, and im proper
alignm ent can adversely affect reproduction.
In the unlikely event that the author did not send a com plete m anuscript
and there are missing pages, these will be noted. Also, if unauthorized
copyright material had to be removed, a note will indicate the deletion.
®
UMI
UMI M icroform EC52635
Copyright 2008 by ProQuest LLC.
All rights reserved. This m icroform edition is protected against
unauthorized copying under Title 17, United States Code.
ProQuest LLC 789 E. Eisenhower Parkway
I
ABSTRACT
This study investigated the role of the CS-UCS
intervals in a delay and a trace conditioning procedure.
The experimental group consisted of A-0 goldfish.
Pour CS-UCS intervals of 5» 10, 20, and
kO sec. duration
were employed for each procedure.The statistical analysis of the data showed a significant difference in the level of learning obtained for the four interval groups, but the superiority of the delay procedure over the trace was not observed.
The rate of learning was found to be a function of the CS-UCS interval: the maximum rate being observed
PREFACE
The idea for this investigation of avoidance conditioning in goldfish grew out my interest in a course
in Comparative Psychology at the University of Bonn. I was familiar with a number of studies using the delay pro
cedure. Now, I was interested in comparing this procedure to a trace procedure.
I would like to express my appreciation to Dr.
Kirby under whose direction this study was designed and
carried out. I am also very grateful for the support and
helpful criticisms of my readers, Dr. J.A. Malone and Pr. J.R. Dougherty. My sincere thanks goes also to Dr. A. Smith and Dr. S. Kushnick for their additional suggestions with regard to the statistical analysis and design of the experi
ment. In addition, I would like to thank Miss Mary Ann Kurtz for her enduring patience through the many hours in the laboratory. Finally, I am deeply indebted to Mrs. Ellen Renaud who worked under much pressure to have this thesis done in time.
TABLE OP CONTENTS
Page
PREFACE
LIST OF TABLES LIST OF FIGURES Chapter I II III INTRODUCTION METHODOLOGY Subjects Apparatus Recording Procedure
Statistical Treatment of Data .
RESULTS ... Avoidance Responses
Escape and Avoidance Responses Response Latencies, Disregarding
Type of Response Inter-Trial Crosses
Summary of Experimental Findings
IV V VI
APPENDIX A . APPENDIX B .
APPENDIX C . APPENDIX D . BIBLIOGRAPHY VITA AUCTORIS
DISCUSSION OF RESULTS
SUMMARY .
SUGGESTIONS FOR FURTHER RESEARCH
LIST OP TABLES Table
1
2
3
5
6
7
8
Page
Summary of Three Studies on Avoidance Conditioning Using Delay and Trace
Procedure . . . . . . 10
Total Number of Avoidance Responses: By Trace and Delay Conditioning Procedure, by CS-UCS Interval Groups, by Blocks of Training Trials (n=40, n=5 per CS-UCS
Interval Group) . . . . . 16
Analysis of Variance of Avoidance Res ponses by Conditioning Procedure (Trace and Delay), by CS-UCS Interval Groups
(5» 10, 20 and ^0 Second) and Blocks
of Trials (25/Day, Total 200) (n=^0) . 17 Analysis of Variance for Simple Effects
on the Number of Avoidance Responses by CS-UCS Interval Groups (5, 10, 20 and ^0 Second) and Blocks of Trials (25/Day,
Total 200) ( n = 4 0 ) ... 19 Mean Avoidance Responses by Blocks
of Trials (n=A-0) . . . . . 19 Analysis of Variance of Avoidance and
Escape Responses Combined by Condition ing Procedure (Trace and Delay), by CS-UCS Interval Groups (5, 10, 20 and 4-0'Second) and Blocks of Trials (25/Day,
Total 200) (n=40) . . . . . 21 Analysis of Variance on Response Laten
cies by Conditioning Procedure (Trace and Delay), by CS-UCS Interval Groups
(5» 10, 20 and ^0 Second) and Blocks
of Trials (25/Day, Total 200) (n-4-0) . 23
Analysis of Variance on Number of Inter-Trial Crossings by Conditioning Procedure
(Trace and Delay), by CS—UCS Interval
Groups (5, 10, 20 and 40 Second) and Blocks of Trials (2 5/Day, Total 200)
(n=^’0 )
•
.
•
.
.
.
.
25Table
9 , Number of Spontaneous Hurdle Crosses (n=4: Five 10 Second Trials/
LIST OP FIGURES
Figure Page
1 The Shuttle Box Apparatus . . . 1 2 (a)
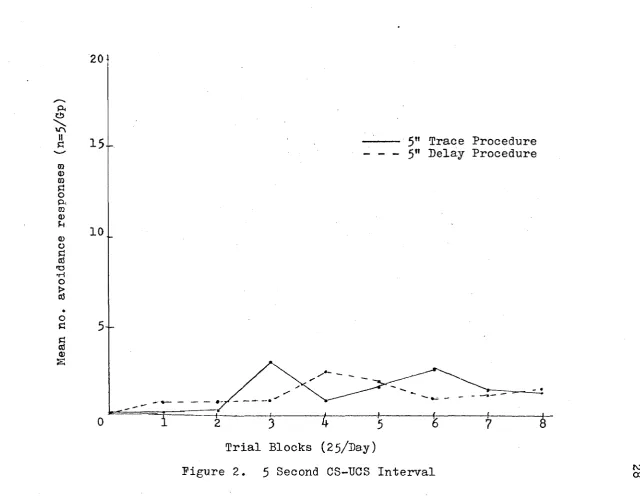
2 5 Second CS-UCS Interval
Trial Blocks (25/Day) . . . . 28
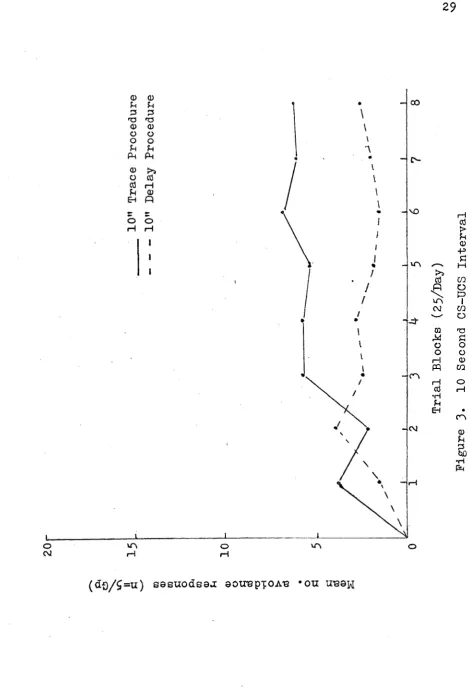
3 10 Second CS-UCS Interval
Trial Blocks (25/Day) . . . . 29 4 20 Second CS-UCS Interval
Trial Blocks (25/Day) . . . . 30 5 ^0 Second CS-UCS Interval
CHAPTER I
INTRODUCTION
For many years the field of animal psychology in America was limited to experimentation with a very few
species. In confining itself to this narrow scope in re search, work with other forms of animal life was largely
neglected, except for a few investigators (e.g. Beach
(1950), Schneirla (1965)). Recently, however, an interest in broadening both the phylogenetic and ontogenetic basis of animal behavior has come into prominence. One of the prob lems investigated through this approach is the proposition that conditioning and learning may or may not be the same process in all animals, regardless of their taxonomic posi
tion on the phylogenetic scale.
The mose systematic attack on this issue has been made by Bitterman and his associates (1959)» using a variety of fish species and experimental procedures. Some of these studies will be reviewed below. After due consideration to several alternatives (e.g. to use bees or possibly an amphi bian) it was decided to use the common goldfish as an exper imental subject.
The second problem to be faced in this thesis proposal
refers to the selection of suitable training procedures. The view taken here is that research with most, if not all,
forms of animal life should be conducted under conditions similar to those used in the study of the more common lab oratory animals (rat, dog, cat, monkey, etc.), especially if any meaningful phylogenetic comparisons are to be made.
The actual choice was to employ an avoidance conditioning procedure, first, because there is experimental evidence to show that goldfish can learn this response and, second, be cause of a personal preference for this procedure over
others.
As to the last major issue, that is, the selection of a research problem, discussion will be delayed until the rele
vant literature is reviewed.
Beginning in the last decade research on the phenomena of avoidance conditioning has increased considerably. In this procedure an animal is usually placed in a two-compart
ment apparatus and is free to move from one compartment to the other. After a period of adaptation, a neutral stimulus
(e.g. light or tone) which is termed the conditioned stimu lus (CS) is presented. After a specified interval, a nox
ious stimulus (e.g. shock) called the unconditioned stimulus
compartment as soon as the CS is presented. In this case, the animal avoids the noxious stimulus, and such a reaction is called an avoidance response. This experimental proced
ure has been used extensively with animals to investigate the effects of varying the time interval between the onset of the conditioned stimulus (CS) and that of the uncondi
tioned Stimulus (UCS), referred to in the literature as the
CS-UCS interval. Some representative studies, employing a variety of training procedures, animal subjects, and CS-UCS intervals, are reviewed below. For convenience, these stu dies are presented by species (mammals, fish) and by the training procedures employed (delay or trace).
MAMMALS
Delay Procedure --- In this training procedure, the on set of the UCS occurs some specified time after the onset of the CS. The two overlap in time and their offset is usually
simultaneous, either with the performance of the escape res ponse or at the end of the stimulus period.
Brush, Brush, and Solomon (1955) studied the effects of varying the CS-UCS interval (2.5> 5> 10, 20, ^0, and 80 sec.) using dogs as subjects. They used a compound visual (light) and auditory (tone) CS and intense shock as UCS. The res ponse to be conditioned was the jumping of a barrier which separated the two compartments. The intertrial interval
interval within a range of 5-40 sec.
Schrier (1961) investigated the effects of *+, 12, and
20 sec. CS-UCS intervals in avoidance conditioning using
cats as subjects and a barrier-crossing response as the CR. The CS was the onset of light and the UCS was a low shock
level. The ITI employed was of 35 sec. duration. The re sults showed that the CS-UCS interval, within the range of
k - Z O
sec. appears to have a small affect on acquisition ofthe avoidance response to criterion. Also, the interval groups did not differ significantly with regard to the trial on which the first avoidance response occurred. Latency of
the avoidance response increased significantly, however, with increase in the CS-UCS interval.
Black (1963) investigated the effect of the CS-UCS in terval (5 , 1 0 , 2 0 , and 30 sec.) on avoidance conditioning in the rat, using both a trace and delayed procedure. He em ployed a two compartment shuttle box and a running response as the CR. An ITI of 90 sec. was used. Each rat was given 100 acquisition trials. The 10 sec. interval was found to
be optimal (i.e. fastest learning). The delay procedure as a whole was found to be superior to trace conditioning, in which no subject met either the learning criterion or showed
a significant trend for the CS-UCS interval groups.
Kamin (195^) studied the effect of CS-UCS intervals (5 , 1 0 , 2 0 , and ^0 sec.) on the acquisition and extinction
of avoidance responses in dogs (jumping a barrier). He used intense shock as the UCS and tone as the CS. The CS had a
fixed duration of 2 sec. and always terminated before the
onset of the UCS. The ITI was 3 min. The results showed that as the CS-UCS interval increased, the number of trials required for the first avoidance response also increased. It was also shown that the number of shocks received in or
der to achieve the avoidance-learning criterion (10 consec utive avoidance responses in a block of 10 trials) and the latency period (in sec.) for the first avoidance response increased as a function of the CS-UCS interval. A relative ly rapid extinction occurred for 20 and ^0 sec. groups,
while half of the 5 sec. group and 20 percent of the 10 sec. group failed to extinguish in 100 trials.
Pearl and Edwards (1963) studied bar pressing behavior as an avoidance response in rats. The CS-UCS intervals em
FISH
Similarly, the behavior of a variety of submammalian forms (fish, crabs) has been studied in situations analogous to those described above. A simple vertebrate with which some work has been done is the common goldfish and related species. Some of the findings are reviewed briefly below.
Behrend and Bitterman (i960) in their study of the role
of the CS-UCS interval (2.5» 5» 10> 20, 40, and 60 sec.) in goldfish used light as CS, placed in the compartment occu pied by subject and intermittent shock as UCS. The CR was a swimming response in a shuttle box type of apparatus. The duration of ITI was on the average 3 min. 10 trials per day were adminished. They found that as the size of the inter
val increased, there was a negatively accelerated decline in
trials to the acquisition criterion (10/10 avoidances), and an increase in avoidance latency. Resistance to extinction was found to vary inversely with the CS-UCS interval in
training and directly with the CS duration. The 20 sec. CS-UCS interval, in acquisition of the CR (swimming response) showed greatest resistance to extinction followed by the 10 and 5 sec. interval groups.
Wodinsky, Behrend, and Bitterman (1961) studied
avoid-ance-conditioning in two species of fish (Beau Gregory and
the criterion of nine avoidances on any given day. In "both species, the results showed that as the CS-UCS interval in
creased, there was a progressive decline in mean number of acquisition days to criterion and a progressive increase in
mean avoidance latency.
Behrend and Bitterman (196*0 trained goldfish using a 2.5 sec. and a 20 sec. CS-UCS interval. All subjects were
trained for 10 days at the rate of 10 trials per day. On day 11 all subjects were tested on a 20 sec. CS-UCS inter
val. The duration of ITI was 3 min. The results showed that learning was the function of CS-UCS interval: the 20
sec. CS-UCS interval was found to he superior to 2.5 sec.
CS-UCS interval.
In another study by Behrend and Bitterman (1964) groups
of goldfish were trained in a swimming response shuttle box with CS-UCS intervals of 1.25, 2.5, 7 .5 , 10, 15, 20, 3 0 , and 60 sec., each group was given 10 test trials with a 20 sec. CS interval (UCS ommitted). It was found that the only sig
nificant difference was between the superior 20 sec. inter val and the inferior 2.5 sec. interval groups in acquisi tion. Latency of avoidance on test trials increased pro gressively as the training interval increased from 1.25 to 60 sec. There was no evidence of learning with the 0 sec. group.
around a value of about 20 sec. with a progressive decline in the number of avoidance responses at both longer and shorter intervals from this mean figure. The reason as to why this optimal is approximately k O times greater than for
human subjects tested on a variety of response measures
(eyeblink, finger flexion and withdrawal, GSR, etc.) has not yet been satisfactorily explained. Whether it defines fund amental phylogenetic differences, is attributable solely to
the employed training procedures (classical vs instrumental), reflects basic differences only between autonomic and skele
tal response training, or whether the search for the optimal temporal interval is fruitless, as Pavlov (1927) speculated
nearly 40 years ago, is still an open question.
The here proposed research, however, will examine this problem in a different way. Most of the studies reported
above have employed rather long intertrial intervals of ap proximately 3 min. duration. The human studies, on the other hand, have generally used much shorter I T I ’s (30-60 sec.). It may be possible to account for the highly dis crepant optimal interval, human versus animal, in terms of this temporal factor. Therefore, the first experimental problem to be investigated will be to study avoidance condi
tioning in goldfish using a shorter ITI (60 sec. average). A second problem concerns the training procedures.
procedures). Most research shows that the delay procedure
is superior to the trace procedure in the conditioning of a
variety of responses. It is a pertinent question, in terms of species comparisons, to investigate whether the goldfish can master this most difficult learning task. A complement of subjects trained using a delayed conditioning procedure
is also to be included, first of all to study the temporal problem suggested above, as well as to provide relevant com parisons for the trace conditioned subjects. The difficulty of trying to assess and compare the two conditioning pro cedures and the general results obtained can be shown in the following way. Table 1 briefly details three animal studies using different species, procedures, and methods of report
ing data.
Black (1963)> for example, reports his findings in terms of number of trials to first avoidance response, num
ber of shocks received, latency of the first avoidance res
ponse and extinction rates. Brush, et al (1955)» however, report their data in terms of number of avoidance responses
10
TABLE 1
Summary of Three Studies on Avoidance Conditioning Using Delay and Trace Procedure
Investigators Ss Procedure CS-UCS ITI
Interval
Trials /day
CR
Brush, et al Dogs Delay 2.5, 5, 3 10/day Barrier
(1955) 1 0 , 2 0 , min. jumping
Jj-0 , 80 response sec.
Schrier Cats Delay 4, 1 2 , 35 25/day Barrier
(1961) 20 sec. sec. jumping
response Black Rats Delay 5, 1 0 , 90 100/day Running
(1963) and 2 0 , 30 sec. avoidance
CHAPTER II
METHODOLOGY
Subjects
The Subjects were
kO experimentally naive goldfish of
at least 2 inches in length (not counting the tail) obtained from a reputable dealer. They were maintained in a 15 gal.home tank kept at approximately 75°F. The Ss were fed once daily in this group tank. As required for experimentation, the Ss were netted at random from the large group 15 gal. illuminated tank, and during the experiment they were housed
individually in 2-gallon tanks on open shelves. Twenty-four
hours prior to experimentation the Ss were not exposed to light. Each subject was fed individually one hour after its daily training session.
Apparatus
The training apparatus consists of a plastic box 5
inches wide by 12 inches long by 2.5 inches high. (Tri State Plastics, Handerson, Kentucky, Catalogue No. C-398). The stimulus lights (CS) are mounted on a base plate approxi
mately 1^ inches apart (110V, 7 Watt White G.E. Lamps). The two photo cells and light sources, which monitor all S
12
ment, are mounted in black plastic housings 3 inches apart and oppose each other at a distance of
9 inches.
(See figure 1 ).The shock (UCS) is applied through stainless steel
plates. The two poles oppose each other along the entire
length of the 12 inch training tank wall. The barrier (hur dle) which divides the 12 inch length of the tank into two compartments is 5 inches wide, 3 inches long and 1 inch high. The water level or depth in the tank is 2 inches. The depth of the water at the hurdle was approximately 1
inch.
The programming of trials and the introduction of stim uli is administrated by a motor driven, double cam of 6
inches diameter. The H O Y AC Cramer motor used has a speed
of one revolution in ten minutes, which represents 360° in 600 sec. or 6° in one sec.
Recording
The hurdle crossing movement and programming proced ures were recorded on an Esterline-Angus operation recorder.
This equipment recorded CS and UCS onsets, avoidance and es cape responses hurdle crossings and all inter—trial hurdle
responding.
Procedure
FIGURE 1
- )
-13
procedure. They were randomly distributed to one of these
two procedures and to one of the CS-UCS interval groups. The four delay procedure groups were trained with
CS-UCS intervals of 5> 10 > 2 0 , and 4-0 sec. respectively. The four trace procedure groups were trained with CS-UCS
intervals of 5» 10, 20, and ^0 sec. Each animal was given training trials at the rate of 25 per day for eight consecu tive days, making a total of 200 trials. In both training procedures the ITI was of an average of 60 sec. (range 30-90 sec.).
The level of shock, which would be of sufficient inten sity to produce active physical movement, was determined in
dividually for each subject prior to experimentation. This was done by placing the S in one of the compartments and
gradually increasing the level of shock until rigorous body
movements were observed. This level of shock was then used throughout the training of the S.
In the experiment proper, each block of 25 daily train ing trials began with a two minute dark adaptation period. After, the first administration which will be followed by the CS (light) was initiated, always in the compartment op posite to that occupied by the subject (see below). The on set of the CS will be followed by the onset of the UCS
14
until 12 sec. have elapsed.
The hurdle crossing response to light alone will term
inate the CS and prevent the onset of shock. The perform ance of this behavior was designated the avoidance response.
If the hurdle crossing response occurred after the onset of shock it was defined as the escape response. If neither the avoidance nor the escape response was evoked, it was desig nated the non-avoidance, non-escape response.
Statistical Treatment of Data
The number of avoidance responses, the response laten cies (to nearest sec.), the number of inter-trial crossings, and the number of escape and avoidances combined are the measures which were obtained. These scores, by CS-UCS in
CHAPTER III RESULTS
The experimental results are presented in four separ
ate sections. They include (1) the number of avoidance re sponses, (2 ) the number of combined escape and avoidance
responses, (3 ) the response latencies, and (^) the number of inter-trial crosses.
(1) Avoidance Responses
The presentation of the obtained results will be de tailed by the raw scores and the statistical analysis of
these scores for the avoidance response data.
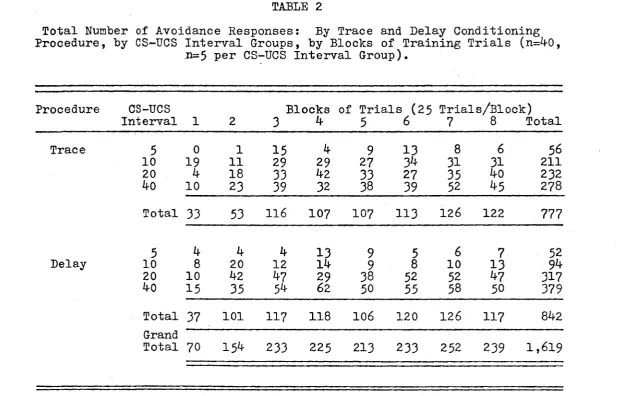
Table 2 shows the total number pf avoidance responses by procedure, CS-UCS interval groups, and blocks of trials.
In general, these results indicate that the total number of avoidance responses, by procedure, show a progressive in crease in the CS-UCS interval, both the kO sec. trace and
delay procedures showing optimal conditioning. As a func
tion of the conditions of training, it is evident that the overall rate of learning increases from blocks of trials one to three, but shows very little change thereafter. These results will be more fully discussed below in the
R e p ro d u c e d w ith p e rm is sio n of the c o p y ri g h t o w n e r. F u rth e r re p ro d u c tio n p ro h ib ite d w ith o u t per m is s io n . TABLE 2
Total Number of Avoidance Responses: By Trace and Delay Conditioning Procedure, by CS-UCS Interval Groups, by Blocks of Training Trials (n=IfO,
n=5 per CS-UCS Interval Group).
Procedure CS-UCS Blocks of Trials (25 Trials/Block)
Interval 1 2 3 ^ 5 6 7 8 Total
Trace 5 0 1 15 if 9 13 8 6 56
10 19 11 29 29 27 3if 31 31 211
20 4 18 33 If2 33 27 35 IfO 232
IfO 10 23 39 32 38 39 52 if 5 278
Total 33 53 116 107 107 113 126 122 777
5 ^ ^ 4 13 9 5 6 7 52
Delay 10 8 20 12
I k
9 8 10 13 9^20 10 If2 Ij-7 29 38 52 52 1+7 317 k ° 1 5 35 62 50 55 58 50 379
Total 37 101 117 118 106 120 126 117 8lf2 Grand
Total 70 15^ 233 225 213 233 252 239 1,619
17
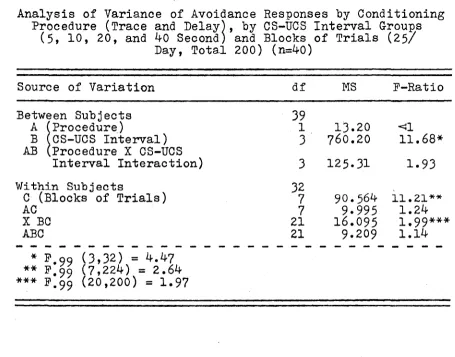
The statistical analysis of these data are shown in Table 3 below. The F-ratio associated with the training procedures employed (Factor A) is less than one, from which it is concluded that there is not a significant difference in the rate of learning the avoidance response between the two procedures. The F-ratio associated with the CS-UCS in terval groups is highly significant (P<t01), thus suggesting
that there is a reliable difference in the rate of respond ing as a function of the CS-UCS interval. These results will be further analyzed and commented upon below. The
within subject factor (C) is highly reliable (P<s.01), there was a significant increase in the rate of response.
TABLE 3
Analysis of Variance of Avoidance Responses by Conditioning Procedure (Trace and Delay), by CS-UCS Interval Groups
(5» 10, 20, and 40 Second) and Blocks of Trials (25/ Day, Total 200) (n=40)
Source of Variation df MS F-Ratio
Between Subjects 39
A (Procedure) 1 13.20 <J1
B (CS-UCS Interval) 3 760.20 1 1 .68* AB (Procedure X CS-UCS
Interval Interaction) 3 125.31 1.93
Within Subjects 32
C (Blocks of Trials) 7 90.564 1 1 .21**
AC 7 9.995 1.24
X BC 21 16.095 1 ,99***
ABC 21 9.209 1.14
18
This factor was not related to either of the two training procedures. However, there was an interaction between the
CS-UCS interval group and blocks of training trials. In spection of the scores (see Table 2, p.l6 ) suggests that
this interaction results from the daily variability of the groups, for example, on block 1, one CS-UCS interval group
was superior to another, but the reverse happening on block 2, and so on. There was no interaction observed between procedures, X CS-UCS intervals, X blocks of trials. (P-3.05).
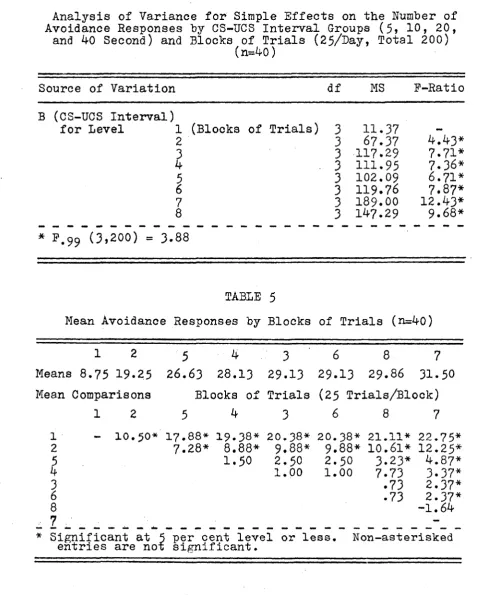
A further analysis of variance was performed on the
main effect of the CS-UCS interval factor. This mean effect was broken down into simple mean effects at each stage of training: i.e. mean number of correct responses for the eight interval groups over each of the 8 blocks of trials. The analysis indicates that the mean number of correct res ponses between intervals from the second to the eighth
block of trials varied significantly (P<i. 01) as shown in
Table 4 below. On the first block of trials, the CS-UCS interval groups did not vary significantly.
The Newman Keuls procedure for testing mean differences was performed on the block of trials factor. (See Table 5)» The multiple comparisons of mean avoidance response differ
19
mains constant until trial block seven on which, the rate of response again increases significantly (P<t.05).
TABLE 4
Analysis of Variance for Simple Effects on the Number of Avoidance Responses by CS-UCS Interval Groups (5, 10, 20,
and 40 Second) and Blocks of Trials (25/Day, Total 200) (n=40)
Source of Variation df MS E-Ratio
B (CS-UCS Interval)
for Level 1 (Blocks of Trials) 3 11.37
2 3 67.37 4.43*
3 3 117.29 7.71*
4 3 111.95 7.36*
5 3 102.09 6.71*
6 3 119.76 7.87*
7 3 189.00 12.43*
8 3 147.29 9 .68*
* F .99 (3 ,200) = 3.88
TABLE 5
Mean Avoidance Responses by Blocks of Trials (n=40)
1 2 5 4 3 6 8 7
Means 8.75 19.25 26.63 28.13 29.13 29.13 29.86 31-50 Mean Comparisons Blocks of Trials (25 Trials/Block)
1
2
5
^
3
6
8
7
1 - 1 0 .50* 1 7 .88* 1 9 .38* 2 0 .38* 20.38* 21.11* 2 2 .75* 2 7.28* 8 .88* 9 .88* 9 .88* 1 0 .61* 1 2 .25*
5 1.50 2.50 2.50 3.23* 4.87*
4 1.00 1.00 7.73 3.37*
3 .73 2.37*
6 .73 2.37*
8 -1.64
7 ■
20
(2) Escape and Avoidance Responses
The rate of learning was also assessed for each trace
and delay procedure by combining the number of escapes and avoidances in each of the eight blocks of trials for each
of the four interval groups.
The analysis of variance computed on the escape and
avoidance responses is shown in Table 6 (see Appendix A for raw scores). The P-ratio associated with the training pro
cedures (Factor A) is less than one from which it is con cluded that the rate of learning either the escape or avoid
ance response does not differ significantly between the two procedures. The P ratio associated with the CS-UCS interval groups is significant (P<i.01), thus showing that there is a reliable difference in the rate o f .responding as a function
of the CS-UCS interval. There was no procedure X CS-UCS interval group interaction (the P-ratio is less than ^.15j the required minimum value, to be significant at the 5 per cent level of confidence).
The within subject factor (C) is highly reliable, thus
suggesting that as the training progressed, there was a sig nificant increase in the rate of response. This factor, however, was not related to either of the two training pro cedures. Likewise, the interaction between the CS-UCS in
21
the two training procedures X CS-UCS interval groups X blocks of trials. Inspection of the raw scores (see Ap
pendix A) suggests that this interaction results from the
fact that at the two short CS-UCS interval groups (5 and 10 sec.), the trace procedure subjects exhibit greater respon siveness on this measure than do the delay subjects. At
the two long CS-UCS intervals, however, the reverse was
observed.
TABLE 6
Analysis of Variance of Avoidance and Escape Responses Combined by Conditioning Procedure (Trace and Delay), by CS-UCS Interval Groups (5, 10, 20, and 40 Second)
and Blocks of Trials (25/Day, Total 200) (n=40)
Source of Variation df MS P-Ratio
Between Subjects A (Procedure)
39
1 4.7 6
< 1
B (CS-UCS Interval) 3 702.47 6.18*
AB 3 162.18 1.43
Within Subjects
C (Blocks of Trials) 7 195.19 1 5 .80**
AC 7 14.81 1.19
BC 21 18.79 1.52
ABC 21 20.10 1.63***
* P .99 (3,32) = 4.47 ** p qq (7 ,00) = 2.64 *** P 95 (21,00) = 1.56
22
hand, show a systematic increase in the number of responses as a function of the increasing CS-UCS interval.
(3) Response Latencies, Disregarding Type of Response
A response latency is defined as the time to the near est second between the onset of the light, CS, and the per formance (or not) of the response. (See Appendix B for raw scores). An examination of these scores shows that the mean response latency increased as the CS-UCS interval increased with the exception of 10 sec. delay group which failed to
demonstrate any learning. Further inspection of these raw scores suggests the superiority of the delay over the trace
procedure. The latencies in the delay procedure approximate the CS-UCS training interval while no such result is evident
in the trace groups.
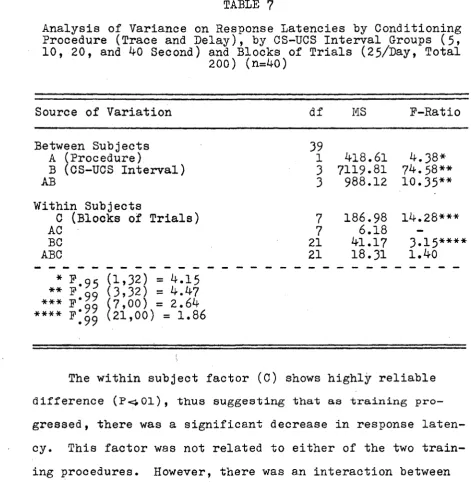
The analysis of variance computed on the response la tencies over the two procedures was statistically signifi
cant (Pc.05), thus confirming the above statement that the delay procedure was superior to the trace procedure. (See Table 7)« The analysis also shows that the increase in la
23 (5 and 10 sec.) the trace groups exhibited a shorter res
ponse latency as compared to the delay groups, however, at the longer CS-UCS intervals (20 and 40 sec.), the reverse
was observed.
TABLE 7
Analysis of Variance on Response Latencies by Conditioning Procedure (Trace and Delay), by CS-UCS Interval Groups (5, 10, 20, and 40 Second) and Blocks of Trials (25/Day, Total
200) (n=40)
Source of Variation df MS F-Ratio
Between Subjects 39
A (Procedure) 1 418.61 4.38*
B (CS-UCS Interval) 3 7119.81 74.58**
AB 3 988.12 10.35**
Within Subjects
C (Blocks of Trials) 7 186.98 14.28***
AC 7 6.18 —
BC 21 41.17 3.15****
ABC
* P.o5 (1,32) = 4.15 ** F go (3,32) = 4.47 *** F g g 7 ,00) = 2.64 **** F 99 (2 1 ,00) = 1.86
21 18.31 1.40
24
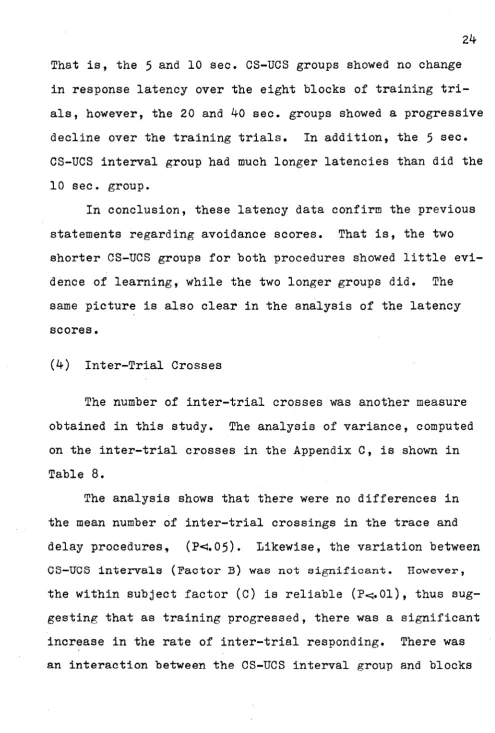
That is, the 5 and 10 sec. CS-UCS groups showed no change in response latency over the eight blocks of training tri als, however, the 20 and 40 sec. groups showed a progressive
decline over the training trials. In addition, the 5 sec. CS-UCS interval group had much longer latencies than did the 10 sec. group.
In conclusion, these latency data confirm the previous statements regarding avoidance scores. That is, the two shorter CS-UCS groups for both procedures showed little evi dence of learning, while the two longer groups did. The same picture is also clear in the analysis of the latency scores.
(4) Inter-Trial Crosses
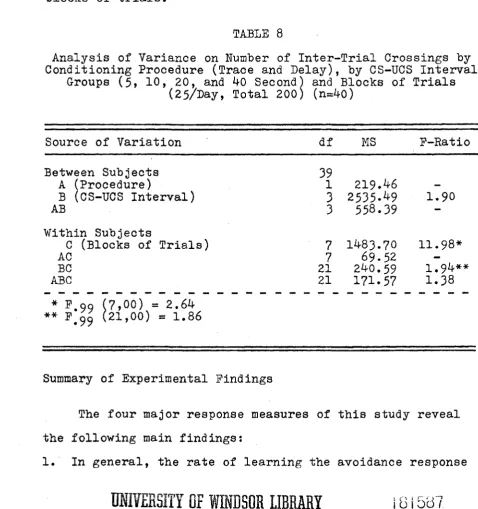
The number of inter-trial crosses was another measure obtained in this study. The analysis of variance, computed on the inter-trial crosses in the Appendix C, is shown in
Table 8.
The analysis shows that there were no differences in
the mean number of inter-trial crossings in the trace and delay procedures, (P<i.05). Likewise, the variation between CS-UCS intervals (Factor B) was not significant. However,
25
of training trials. That is, as training progressed, the two short CS-UCS groups (5 and 10 sec.) progressively in creased their rate of inter-trial crossing up to 100 trials;
thereafter, there was a progressive decline in this measure. In the two long CS-UCS groups (20 and 40 sec.), there was a general increase in the rate of response over the eight blocks of trials.
TABLE 8
Analysis of Variance on Number of Inter-Trial Crossings by Conditioning Procedure (Trace and Delay), by CS-UCS Interval
Groups (5, 10, 20, and 40 Second) and Blocks of Trials (25/Day, Total 200) (n=40)
Source of Variation df MS F-Ratio
Between Subjects 39
A (Procedure) 1 219.46
—
B (CS-UCS Interval) 3 2535.^9 1.90
AB 3 558.39 —
Within Subjects
C (Blocks of Trials) 7 1483.70 1 1 .98*
AC 7 69.5 2
—
BC 21 240.59 1.94**
ABC 21 171.57 1.38
* P.oo (7,00) = 2.64
** F'jj
(
21,
00) =
1.86Summary of Experimental Findings
The four major response measures of this study reveal the following main findings:
was intimately related to the CS-UCS interval, i.e.,
as the interval increased, so did the number of avoid
ance responses. At the 5 sec. CS-UCS interval, regard less of the conditioning procedure employed (trace ver
sus delay), little or no evidence of learning was demon strated. At the 10 sec. CS-UCS interval, the trace pro cedure was superior to the delay procedure. At the two long CS-UCS intervals (20 and ^0 sec.), there was defin
ite evidence of acquisition of the avoidance response. Although the mean number of responses of the delay
groups was superior to the trace groups, this mean dif ference was not statistically reliable. These results are graphically presented in Figures 2, 3> and 5 be- '
low.(pp.28-31)•
2. The rate of learning either the avoidance or escape res ponse, when such responses are combined, shows this ac
quisition to again be a function the CS-UCS interval. However, there were no reliable differences between con ditioning procedures. A significant triple interaction was observed between procedures X CS-UCS interval X
blocks of training. This positive finding suggests that at the two short CS-UCS intervals, the trace groups
showed superior acquisition, but at the two long CS-UCS intervals, the delay groups were superior.
procedure. That is, the mean response latency of the former groups tended to approximate the duration of the CS, prior to the onset of the UCS, particularly at the 20 and 40 sec. CS-UCS intervals; the latter, trace group
response latencies, tended to be significantly longer at
the same CS-UCS intervals. As a rule, all groups com bined exhibited a gradual decline in response latency from the first, through to the last, block of trials. 4. On the last measure, that of inter-trial crosses, the
data analysis revealed neither procedural nor interval differences. However, for all groups, there was a sig
nificant increase in the rate of inter-trial responding as training progressed. This was most evident for the 20 and 40 sec. groups; the two short interval groups (5 and 10 sec.) were much more variable on this measure,
particularly after trial block four.
R e p ro d u c e d w ith p e rm is sio n of the c o p y ri g h t o w n e r. F u rth e r re p ro d u c tio n p ro h ib ite d w it h o u t per m is si o n . ft cb V T \
il ra <D ra ft o ft ra ra ra o § ■o •H O > cd o C § ra
a
2 0 ]
5” Trace Procedure - - 5” Delay Procedure
10
29
<D CD Pi Pi 3 'a ra <D <D o o o o Pi PiPh Ph
<u
o cd
c\3 rH Pi <D EH fi o o rH rH 00 \ - vo --3" ►>5 at U"V CVJ m
M
o o (H pq «5 •Hu
EHO V T v
rH rHO u~\
(d f)/S = u ) sasuodsau: aotreptOA'B *o u uisa^:
R e p ro d u ce d w ith p e rm is sio n of the c o p y rig h t o w n e r. F u rth e r re p ro d u c tio n p ro h ib ite d w it h o u t p e rm is s io n . 20 p.
20" Trace Procedure - - 20” Delay Procedure
p.
— ___
10
R e p ro d u ce d w ith p e rm is sio n of the c o p y ri g h t o w n e r. F u rth e r re p ro d u c tio n p ro h ib ite d w it h o u t per m is s io n . P< XT\ II ft CD <D CD O ft CD CD CD O ct Ctf •H O > o
a
at CDs
20 r^0” Trace Procedure - - ifO” Delay Procedure
10
CHAPTER IV
DISCUSSION OP RESULTS
The present research, using goldfish as subjects, was
undertaken to study CS-UCS intervals, utilizing two standard training procedures — trace and delay conditioning. It will also be remembered that the selection of the stimulus
time relations also involved another temporal factor, that of using a relatively short inter-trial interval as compared to the values employed by other researchers.
Before going on to discuss the results, it is most ap propriate at this point to examine two critical assumptions. The first refers to the "arousal" or "neutral" properties of the light CS. Hypothetically, it is expected by most inves tigators that the CS has neutral properties, i.e., will not initially evoke the response that is to be conditioned. If it does, in pre-test trials, then, presumably, another sti mulus, or the same stimulus at a changed intensity value, is
employed. No such assumption was made in the present inves
tigation: That is, a pilot study was conducted to assess the aversive (or rewarding) properties of the intended, to-be-conditioned stimulus. In this pilot work, four goldfish were run under the following conditions:
33
1. CS onset in compartment occupied by the subject, 2. CS onset in compartment opposite to that occupied
by the subject,
3. CS onset in both compartments, and if. Ho CS onset.
The subject was placed in the conditioning apparatus for a 10 sec. period on 5 consecutive days. The number of spon taneous hurdle crosses to the other compartment were re corded, the results of which are shown in Table 9, below.
TABLE 9
Number of Spontaneous Hurdle Crosses (n=if: Five 10 Second Trials/Subject)
Condition Trial No.
1
and 2
No. 3
Crosses 4 5
Total No. Crosses
1. Light to Dark
Compartment 8 if 6 3 if 25
2. Lark to Light
Compartment 0 0 0 0 1 1
3. Light on in
Both Compartments 1 3 2 if l 11
4. Dark in Both
Compartments if 2 if 3 3 16
in the unilluminated compartment, and thus avoiding the
light, seemed to yield the kind of situation which might maximize the possibility of getting a. "pure" demonstration
of learning, uncontaminated by the consequences of spontan
eous responding. This condition, therefore, was applied in the present research (for a more critical discussion of this factor, see below, p.35)*
A second assumption that must be introduced is that of initial expectations with respect to the interpretation of
learning in the present results. Specifically, two proposi tions can be argued. First, the probability of the correct response being evoked on the first trial can be set at one
in three, since three alternatives are present (to avoid, to escape, or to do neither). If this probability is the cri
terion which will ultimately be used as the definition of learning, then the subject will have to respond considerably more frequently than at the 33 per cent level in order for it to be claimed that a demonstration of learning had been realized. The second proposition is that argued by Estes
(1961). In this case, the probability of the correct res ponse being evoked on trial one is set at zero. Empiric
ally, two pieces of evidence argue for the acceptance of the
35
i
condition actually used in the experiment. Second, none of the groups showed any evidence of learning, even in the
first block of 25 trials. Therefore, the zero probability criterion was accepted, and is the basis upon which the pre sent results are interpreted. The main findings will now be discussed.
The delay procedure group results, on several of the employed measures, are sufficiently different from those of the trace groups to warrant separate discussions for each.
The two principle measures employed, that of avoidance and the combined avoidance/escape responses, showed the de
lay procedure to be effective in conditioning these respon
ses, particularly at the 20 and 40 sec. CS-UCS intervals. Little or no evidence of learning was observed at the other
two, short CS-UCS intervals (5 and 10 sec.). These findings are similar to those reported by Bitterman and his associ ates, (Behrend and Bitterman, 1962 and 196^) using goldfish
as subjects, in that the rate of conditioning increased as the duration of the CS-UCS interval increased, at least within the ranges comparable to those employed in the pre
sent study and using a similar type of CR.
The strength of the avoidance response between these re
after 200 training trials had heen administered. These
response strength discrepancies may be due to at least three
factors. First, the Bitterman workers employed a long inter-trial interval (average of 3 minutes) while the pre sent study used short inter-trial intervals (average 60 sec.). Second, Bitterman et al distributed training at the rate of
10 trials per day while 2 5 trials per day were administered in the present experiment. Lastly, Bitterman et al, in most of the work reported, had the CS onset in the compartment occupied by the subject, while the present research had, it will be recalled, the CS onset in the opposite compartment. Although the first two procedural differences (long versus short ITIs, and "distributed" versus "massed" practice) may
be important in accounting for the response strength differ ences between the studies compared, it is here asserted that the position of the CS (paired or unpaired with the subject)
is by far the most important factor in trying to reconcile these differences. Unfortunately, there is no experimental
evidence reported in the literature to confirm this notion. However, that short ITIs and "massed" practice condi tions are relevent is suggested by Schrier's (1961) research. In this experiment, Schrier conditioned an avoidance response in cats using light as a CS and shock as the UCS. Twenty-five trials per day were administered with an average ITI of
mean percentage of avoidance responses is 52; after 30 days
(or 750 trials), the avoidance percentage was 8 5 . Although these results and those of the present study do not refute those reported by Bitterman et al, they do point out the im
portance of temporal parameters. The factor of the CS pro ximity will have to await further investigation. In summary,
it must be concluded that the search for the optimal CS-UCS interval, particularly as it relates to the other temporal factor manipulated in the present study, cannot be specified on the basis of the present data.
The finding that the phylogenetically humble goldfish can master trace conditioning, almost to the same degree as
delay conditioning, was the most unexpected result of this research. The most relevent reference study reported is that
of Black (1963), using rats as subjects, in which he com pared the rate of conditioning on avoidance response by both a delay and a trace procedure. Black found that the delay procedure was superior to the trace procedure, regardless of the CS-UCS interval (5 , 10, 20, and 30 sec. groups). Whe ther the Black and present study trace differences are ac
countable for in terms of the conditions of practice (Black massed 100 training trials), or the use of a longer III (90
sec.), or a different CS (tone), remains to be systematical ly investigated. Incidentally, it may be added that the
38
obtained in the present research.
The shape of the learning curve (see Figures 2, 3> ^ and 5, pp.28-31) for the 20 and 40 sec. CS-UCS interval groups, particularly, may be compared to learning plateaus for human subjects. Early in the acquisition phase, the hu man typically shows a dramatic change in learning; response
performance generally remains constant for a period of time and then, once again, there is observed another positive acceleration in the curve, to be succeeded once more by an
other static plateau, and so on, until an asymptote is at
tained. The fish subjects (20 and 40 sec. groups) perform
ance was somewhat similar: at roughly trial 100, there was a positive increase in the rate of learning the response. For the next 75 trials, there was little change in perform ance, but in the last block of 25 trials, the curve began
to accelerate moderately once more. This suggests that on the next replication of the experiment, the number of ac quisition trials be continued beyond 200 trials, the total administered in the present research.
The successful demonstration of conditioning a gold fish to avoid noxious stimulation appears to be amply demon
strated in the present study. It is also evident that the
subjects can learn to avoid under a trace procedure nearly as well as under a delay procedure. The characterization
is as follows: early in training, the response is sporadic, but during the third or fourth block of trials, the sub
ject’s behavior begins to be related to the onset of the CS. The performance of the response generally remains unchanged for the next 4 to 5 blocks of trials after which there ap pears to be a gradual acceleration of the learning curve once more. Unfortunately, this increased rate of respond
ing was of insufficient magnitude to warrant extrapolation predictions. At the same trial periods of learning the res ponse, there was also a significant change observed in the two subsidiary measures: response latencies started to de
crease and inter-trial responding began to increase. At the short CS-UCS intervals (5 and 10 sec.), there was little change observed in response latencies or in the frequency of
inter-trial responding over the eight blocks of training
CHAPTER V
SUMMARY
The purpose of the present study was to investigate the role of CS-UCS interval in avoidance conditioning, using a
delay and a trace procedure. Pour CS-UCS intervals of 5» 10, 20, and ^0 sec. duration were employed in each procedure.
The subjects were ^0 experimentally naive goldfish which were trained in a shuttle box apparatus. Each fish
was given training trials at the rate of 25 per day for
eight consecutive days, making a total of 200 trials. Light
was used as a conditioned stimulus while the unconditioned stimulus was interrupted shock of 12 sec. duration.
The measures of learning were the number of avoidances, the number of escapes and avoidances combined, the response latencies, and the number of inter-trial crosses. The rate of learning was also measured over blocks of trials.
The rate of learning the avoidance response was demon strated to be a function of CS-UCS interval. At the two
short intervals (5 and 10 sec.) little evidence of learning was observed; at the two long intervals, over the eight blocks of training trials, there was positive evidence of acquiring the response. The level of learning was approxim
ately equal between the two procedures, however, the super
iority of the delay procedure was reflected in shorter res ponse latencies. The 40 sec. CS-UCS interval gave the high
est rate of avoidance responding, followed by the 20, 10, and 5 sec. groups, respectively.
CHAPTER VI
SUGGESTIONS FOR FURTHER RESEARCH
1. The present study should be replicated using a
different criterion of learning (i.e. 8/10 avoidances).
2. Another replication be made in which the onset of the CS (light) be in the compartment occupied by the subject.
3. That a further study be conducted in which massed training trials be compared with distributed training trials.
R e p ro d u c e d w ith p e rm is sio n of the c o p y ri g h t o w n e r. F u rth e r re p ro d u c tio n p ro h ib ite d w it h o u t per m is s io n . APPENDIX A
Total Number of Avoidance and Escape Responses Combined: By Trace and Delay Conditioning Procedure, by CS-UCS Interval Groups, by Blocks of Training Trials
(n=40, n=5 per CS-UCS Interval Group).
Procedure CS-UCS
Interval 1 2
Blocks of Trials
3 4 - 5 6 7 8 Total
5 2 9 31 17 24 27 30 19 159
Trace 10 3? 26 4-4 53 62 57 50 379
20 4 21 45 59 54 39 52 54 328
4-0 15 31 53 42 46 56 59 61 363
Total 56 87 181 162 177 184 198 184 1,229
5 8 5 12 30 16 14 25 21 131
Delay 10 26 44 32 30 23 26 27 37 245
20 19 59 66 44 60 66 64 64 442
4-0 17 36 62 73 68 59 71 64 450
Total 70 144 172 177 167 165 I87 186 1,268
R e p ro d u c e d w ith p e rm is sio n of the c o p y ri g h t o w n e r. F u rth e r re p ro d u c tio n p ro h ib ite d w it h o u t per m is s io n . APPENDIX B
Mean Response Latencies in Seconds by Conditioning Procedure (Trace and Delay) by CS-UCS Interval Groups (5, 10, 20, and 40 Second) and Blocks of Trials
(25/Day, Total 200) (n=40)
Procedure CS-UCS
Interval 1 2
Blocks of Trials
3 4 5 6 7 8 Total
5 105 101 90 100 94 90 103 97 780
Trace 10 105 112 94 98 96 92 93 95 785
20 168 153 138 123 132 141 131 129 1,115
4o 268 237 209 226 215 220 190 206 1,771
Total 646 603 531 547 537 5^3 517 527 4,451
5 167 169 164 144 158 161 150 154 1,267
10 113 100 109 111 113 113 112 107 878
20 163 126 121 142 133 116 120 118 1,039
40 258 224 185 183 201 196 183 203 1,633
Total 701 619 579 580 605 586 565 582 4,817
R e p ro d u c e d w ith p e rm is sio n of the c o p y ri g h t o w n e r. F u rth e r re p ro d u c tio n p ro h ib ite d w it h o u t per m is s io n . APPENDIX C
Number of Inter-Trial Crossings by Conditioning Procedure (Trace and Delay) by CS-UCS Interval Groups (5, 10, 20, and 40 Second) and Blocks of Trials
(25/Day, Total 200) (n=40)
Procedure CS-UCS
Interval 1 2
Blocks of 3 4
Trials
5 6 7 8 Total
5 4 14
70
54 31 72 79 37 361Trace 10 96 53
I l k
1 1 2
98 109 85 73 74020 3 37 103 153 127 89 120 178 810
4-0 27 57 103 71 78 103 161 133 733
Total 130 161 390 390
33k
373 445 421 2,6445 2 20
k6
98 68 68 97 74 473Delay 10 .41 78
69
7 k
62 54 59 65 50220 31 127 133 77 98 1
6k
220 210 1,06040 27 66 151 148 91 119 151 121 874
Total 101 291 399 397 319 405 527 47Q 2,909