DEES, AMANDA LEE. Effect of Various Ingredients on a Model Process Cheese System. (Under the direction of Dr. E. Allen Foegeding)
The process cheese industry desires to increase formula flexibility by incorporating various alternative ingredients into process cheese. For example, incorporation of whey protein could reduce the amount of casein used in process cheese formulations. The purpose of this study was to understand effects of various ingredients and how they affect texture and meltability of cheese. The ingredients studied were native whey protein, mono- and disodium phosphate, lactose, and polymerized whey protein concentrate (pWPC). Cheese analogs contained mono- and disodium phosphate, lactose, 1 of 4 different whey protein ingredients or pWPC. Cheese analogs were made by heating and mixing for 21 min in a
Stephan mixer with endpoint temperatures of 80°C or 85°C. The pWPC was prepared by
heating WPC at 90°C, pH 8.0, for 30 min. Properties of pWPC were determined by small strain rheology. Cheese analogs were characterized by yield stress and meltability measurements. Native whey protein showed no clear trend with regard to yield stress or meltability. Also, the addition of lactose at 0% to 4.4% and mono- and disodium phosphate between 2.0% to 2.8% had no effect on yield stress while meltability results showed no consistent trend of cheeses cooked to 80°C. Differences were observed when cheese was
heated to an endpoint of 85°C. The higher temperature increased yield stress approximately
80% and reduced meltability from a Schreiber number of about 9 to 5.
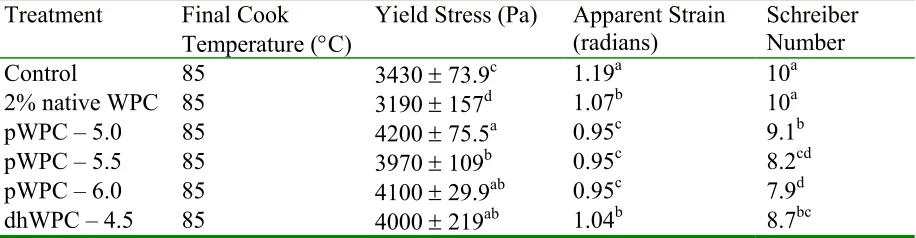
casein with pWPC in a cheese analog increased the yield stress approximately 18% and decreased meltability from a Schreiber number of about 10 to 8.
Different levels of lactose did not affect the texture or meltability of the process cheese analog, however, the level of mono- and disodium phosphate and whey protein did result in differences in yield stress and meltability. These differences were observed at a
much greater extent when the cheese analog was cooked to a final temperature of 85°C.
EFFECTS OF VARIOUS INGREDIENTS ON A MODEL PROCESS CHEESE SYSTEM
by
AMANDA LEE DEES
A thesis submitted to the Graduate Faculty of North Carolina State University
in partial fulfillment of the requirements for the Degree of
Master of Science
DEPARTMENT OF FOOD SCIENCE
Raleigh 2002
Approved by:
________________________ _______________________ E. Allen Foegeding, Ph.D. Chris Daubert, Ph.D.
Chair of Advisory Committee
DEDICATION
I would like to dedicate this thesis to four individuals who have inspired and led me throughout my 24 years of life. As with all families, we have had good times and bad but through it all we have loved each other and for that I could not ask for more.
I would first like to dedicate this thesis to my Grandma, Aileene Stevenson Lee. It is through her unending support of all my whims and goals that have helped me get to this place in my life. Through her example I understand how important it is not to judge others and to know that basically everyone is doing their best and that is all that can be asked of a person. I find it interesting that the words “I love you” are rarely said but I have never doubted her love for me. I love her dearly.
The second person I would like to dedicate this thesis to is my mama (Daddy, this is because I love her best!). She is the smartest person I know, and I admire the path she has chosen in life and am so grateful. She is responsible for bringing the family home to Pamlico so my sister and I could know our entire family. I couldn’t ask for a better gift. She has showed much strength and courage while still managing to smile. And I’m happy that my smile looks just like hers because I think she’s beautiful when she smiles. She has been a wonderful mother and I hope that one day I can be as good to my children as she has been to me. I love her dearly.
The third person I would like to dedicate this thesis to is my daddy. I’ve never called him anything but daddy and he loves it. He is the most giving person I know. He has the ability to drive me crazy and make me laugh. I have many fond memories of four-wheeler riding and going to the dump. He has always been there when I needed him, from lunch at preschool to dinner at college. His favorite saying to me has been to “work hard now and play later”, and now I think it’s time to play. I love him dearly.
BIOGRAPHY
ACKNOWLEDGEMENTS
- I would like to express my sincere thanks to my family for all their support
- I’d also like to thank Dr. Peggy Foegeding for being such an incredible role model and for leading me to my undergraduate advisor and my graduate advisor, Dr. E.A.
Foegeding.
- My sincere gratitude goes to Dr. E.A. Foegeding for his support, knowledge, and patience throughout my time at NC State. And also for sharing his family stories with me, so I could also learn about life and not just food science.
- Thanks to Dr. Daubert for his expertise and advice throughout this project and for always being available to listen.
- Additionally, thanks to Dr. Montoya-Weiss for her help and time invested in this work. - I’d also like to thank Paige Luck for everything regarding this thesis. She was
instrumental in just about every aspect of this research project, and I couldn’t have done it without her assistance and encouragement. I’m happy to have gained such a good friend.
- Thanks to Kraft Foods for funding this work and also giving me the opportunity for an internship. Dr. Ted Lindstrom, Dr. Heather Hudson, Patricia Rodriquez and Chris Pernell were extremely helpful during my time at Kraft.
TABLE OF CONTENTS
LIST OF TABLES... vii
LIST OF FIGURES ... viii
PART 1: REVIEW OF LITERATURE... 1
Milk Protein ... 2
Casein... 2
Whey Protein ... 7
Whey Protein-Casein Interactions ... 10
Process Cheese... 11
Standard of Identity for Process Cheese and Substitute or Imitation Cheese... 12
Process Cheese Manufacture ... 16
Emulsification / Emulsifying Salts ... 20
Whey Protein Incorporation... 22
Measurement Techniques ... 25
Yield Stress ... 25
Melting Tests ... 29
Conclusions... 31
PART 2. INTRODUCTION ... 37
PART 3. MATERIALS AND METHODS ... 44
Material ... 45
Preparation of Process Cheese Analogs... 45
Preparation of Single Heated WPC Polymer ... 46
Preparation of Double Heated Polymer ... 47
Process Cheese Analog Formula ... 47
Whey Protein Incorporation... 47
Polymer Incorporation ... 48
Emulsifying Salts and Lactose Experiment ... 48
Large Strain - Yield Stress... 48
Small Strain Rheology ... 49
Moisture ... 50
Meltability... 50
pH... 51
Protein Content ... 51
Experimental Design... 51
Statistical Analysis... 51
PART 4. RESULTS AND DISCUSSION... 52
pH and Moisture ... 53
Native Whey Protein Incorporation... 53
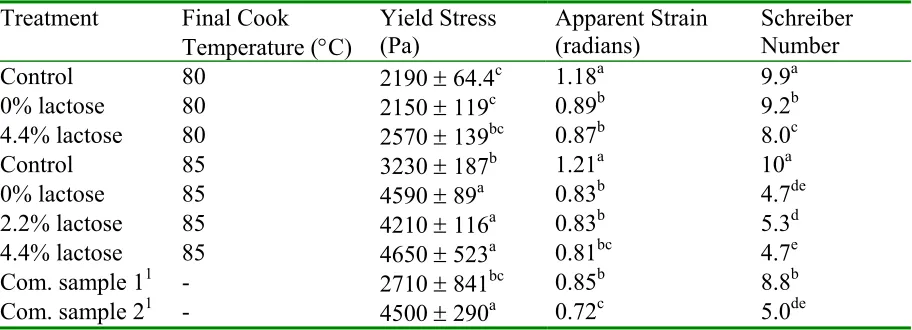
Lactose Addition... 58
Cook Temperature ... 59
Commercial Process Cheese ... 60
Rheological Results from pWPC ... 60
Polymerized Whey Protein Concentrate Addition... 62
Conclusion ... 64
Recommendations for Future Research ... 64
PART 5. LITERATURE CITED... 66
PART 6. TABLES ... 74
LIST OF TABLES
Table 1. Yield Stress, apparent strain, and Schreiber Number values of cheeses made with different native whey proteins. ... 75 Table 2. Yield stress, apparent strain, and Schreiber Number values of cheeses made with
4% whey protein isolate and various amounts of emulsifying salts (e. salts) with final cook temperatures of 80°C or 85°C... 76 Table 3. Yield Stress, apparent strain, and Schreiber Number values of cheeses made with
4% whey protein isolate and various amounts of lactose with final cook
temperatures of 80°C or 85°C... 77 Table 4. Yield stress, apparent strain, and Schreiber Number values of cheese analogs
LIST OF FIGURES PART 1: REVIEW OF LITERATURE
Figure 1. Coat-core model of the casein micelle... 32
Figure 2. Internal structure model of the casein micelle ... 33
Figure 3. Subunit model of the casein micelle ... 34
Figure 4. Action of emulsifying salt... 35
Figure 5. 4-bladed vane and vessel dimension requirements... 36
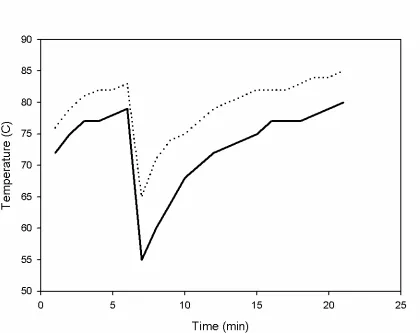
PART 4: RESULTS AND DISCUSSION Figure 1. Heating curve for a process cheese cook cycle... 80
Figure 2. Yield stress vs. pH of a process cheese analog containing 1% or 2% whey protein.. ... 81
Figure 3. Yield stress vs. pH of a process cheese analog containing 4% whey protein isolate and various amounts of emulsifying salts... 82
Figure 4. Yield stress vs. pH of a process cheese analog containing 4% whey protein isolate and various amounts of lactose... 83
Figure 5. Yield stress vs. pH for a process cheese analog containing different pWPC……84
Figure 6. Yield stress vs. moisture of a process cheese analog containing 1% or 2% whey protein ... 85
Figure 7. Yield stress vs. moisture of a process cheese analog containing 4% whey protein isolate and various amounts of emulsifying salts ... 86
Figure 8. Yield stress vs. moisture of a process cheese analog containing 4% whey protein isolate and various amounts of lactose... 87
Figure 9. Yield stress vs. moisture for a process cheese analog containing different pWPC. ………... 88 Figure 10. Yield stress and Schreiber Number for a process cheese analog containing 4%
Figure 11. Apparent strain for a process cheese analog containing 4% whey protein isolate
and various amounts of emulsifying salts at 80°C or 85°C ... 90
Figure 12. Yield stress and Schreiber Number for a process cheese analog containing 4% whey protein isolate and various amounts of lactose at 80°C or 85°C... 91
Figure 13. Apparent strain for a process cheese analog containing 4% whey protein isolate and various amounts of lactose at 80°C or 85°C ... 92
Figure 14. Stress Sweeps for all polymer solutions ... 93
Figure 15. Frequency Sweeps for all polymer solutions ... 94
Figure 16. Phase Degree for all polymer solutions ... 95
Figure 17. Complex viscosity for all polymer solutions ... 96
Figure 18. Yield stress and Schreiber number for a process cheese analog containing different pWPC ... 97
Figure 19. Strain values for a process cheese analog containing different pWPC... 98
REVIEW OF LITERATURE Milk Protein
Milk has been used as a nutrition source for humans due to its high protein and mineral content for centuries. Specifically, bovine milk is composed of 3.9% fat, 3.3%
protein, 5.0% lactose, and 0.7% minerals (Wong et al., 1996). The milk proteins are αs1-,
αs2-, β-, and κ-caseins, β-lactoglobulin (β−LG), α-lactalbumin (α−LA), serum albumin,
lactotransferrin, immunoglobulins, β2-microglobulin and a few additional minor proteins
(Eigel et al., 1984). However, the focus of the following discussion will be on the major milk
proteins specifically, caseins, β-LG, and α-LA.
Casein
The industrialization of milk processing began around 1880 followed by casein production at the beginning of the twentieth century. Up until the 1960’s, casein was used mainly for industrial applications like glue, paper glazing, plastic and artificial wool. However around 1950, due to improvements in the handling of milk and a greater understanding of the bacteriology of milk, the development of methods to produce food-grade casein and caseinates for use in baked goods, pastry, sausage, and process cheeses was realized. This type of research was pioneered mainly by a select group of companies in France, Australia, and New Zealand (Maubios and Ollivier, 1997)
Casein composes about 70-80% of the total protein found in bovine milk. There are
four individual caseins, αs1 and αs2 casein, β-casein and κ-casein, that are present in milk at a
ratio of 4:1:4:1(Dalgleish, 1997). The αs1 and β-caseins do not contain cysteine or cystine,
cysteinyl residues per molecule which lends itself to disulfide bond formation (Dalgleish, 1997). Another important factor to consider is hydrophobicity which arises due to non-polar
side chains on the amino acids. Of the caseins, αs1 and αs2 are the least hydrophobic while β
-casein is amphiphilic. This is due to polar side chains on the first 40 residues from the
N-terminal, while the remainder of β-casein is hydrophobic. Additionally, κ-casein is an
amphiphilic protein. The N-terminal region (residues 1-105) is hydrophobic while the C-terminal region (residues 106-169) is hydrophilic (Rollema, 1992).
However, casein is not found in milk as individual proteins. It is in the form of micelles which range in size from 50-250nm, and these micelles determine the physical stability of milk (Dalgleish, 1997). There have been many different models proposed for the actual structure of casein micelles and researchers continue to disagree about the structure due to the complexity of the micelle. These models can be put into three basic categories: 1) the coat core model 2) internal structure model 3) subunit model. In 1965, Waugh and Noble proposed the first coat-core model (Figure 1) which consisted of an inner core of spherical
particles of αs and β-caseins with an outer coat of κ-casein. Garnier and Ribadeau-Dumas
proposed an internal structure model (Figure 2) in 1970. It consisted of a three-dimensional porous network in which three κ-casein molecules act as nodes and αs and β-caseins are the
branches. Morr proposed the first model that incorporated subunits in 1967, but the subunits were composed of identical protein compositions. In 1984, Walstra further described the concept of steric stabilization after extending the work done by Schmidt and Payens which found that the subunits are linked by calcium phosphate bonds. This model (Figure 3) is
stabilized by κ-caseins which are located on the surface of the micelle with the inner core
completely agree about the structure of the micelle, the focus of this paper will be on the model shown in Figure 3 which is accepted by most scientists.
Casein micelles are composed of submicelles, which are associations of 20 to 25 casein molecules. These submicelles are held together by hydrophobic interactions and salt bridges. The composition of each submicelle varies; however, there are two major types of
submicelles, those with κ-casein and those without (or very little). The κ-casein is located on
the surface of the micelle. This is the hydrophilic portion which protrudes out into solution while the hydrophobic portion is located within the micelle. The submicelles aggregate with the aid of calcium phosphate, due to negative charges found on the surface of the submicelles. The calcium phosphate groups bind to the serine phosphate groups found in casein molecules within the submicelles. These salt bridges along with hydrophobic interactions allow for the formation of the casein micelle. The binding of calcium phosphate inhibits the rotation of the peptide bonds when the micelle is formed. However, the
glycomacropeptide of the κ-casein molecule that sticks out from the micelle continues to
have the ability to rotate and are considered to be “flexible hairs”. In general, casein micelles should be thought of as irregularly shaped and fuzzy (Walstra et al., 1999).
The κ-casein molecule found on the surface of micelles is responsible for stabilization of milk from phase separation. Part of this stabilization is due to steric stabilization. This
stabilization mechanism involves the micelle being surrounded with long polymers (e.g. κ
6.6 (milk pH). This prevents the micelles from joining together and forming a clot or gel. Acid gelation can occur as the pH of milk decreases. The net charge on the micelle is reduced until it reaches zero (isoelectric point), and at this point there is no electrostatic
repulsion. Also, there is no steric stabilization because the κ-casein molecules fold back onto
the micelle, so stabilization is lost and the micelles aggregate (Dalgleish, 1997).
Casein micelles can also be destabilized by the addition of chymosin which is an enzyme found in rennet (Dalgleish, 1997). This enzyme is responsible for selectively cleaving the phenylalanine 105 – methionine 106 bond found on the κ-casein molecule
(Swaisgood, 1992). The protruding glycomacropeptide (GMP) is lost, therefore steric stabilization does not occur. The micelle then aggregates due to flocculation when the cleavage of the GMP is 80-90% complete (de Kruif, 1999). Small amounts of negative charge found on the surface of the micelle requires the addition of calcium for calcium bridging among micelles which results in aggregation (Dalgleish, 1997). It has been shown that rennet clotting time shortened with the addition of calcium chloride (de Kruif, 1999).
exposed from the center of the micelle and then can adsorb on the oil/water interface (Dalgleish, 1997).
Rennet Casein
Rennet casein is manufactured with the use of chymosin, the enzyme found in calf
rennet. This enzyme is added to skim milk at approximately 29°C at a ratio of 1:7000
(Southward, 1986). This results in destabilization of the casein micelle. This process usually occurs at pH 6.6 for 30 min (Southward, 1986). The clotted milk is cooked at fairly high temperatures, which causes syneresis. The particles are separated by a centrifuge or with the use of a vibrating sieve followed by being washed with water and further pressed and dried in a drum or belt drier. Rennet casein is insoluble in water and has a high ash content (Walstra et al., 1999).
Originally, rennet casein was used exclusively as an industrial chemical. Rennet casein and water can be extruded under the influence of heat and pressure to form rods of plastic. However, the rods readily absorb water and swell, therefore it is imperative that the plastic hardened before use. This is typically achieved with the aid of formaldehyde. Additionally, the plastic needs to cure for one week to six months. Due to these difficulties as well as the introduction of petrochemicals, casein plastic is used only for button production (Southward, 1974).
Whey Protein
Second to casein, whey proteins are also a major source of protein found in milk. They are a byproduct of natural cheese production and were previously considered waste to cheese producers, however, due to changes in government regulations whey proteins have undergone extensive research to determine potential uses. This research has shown that whey proteins have functional properties which are highly desirable. Whey proteins have the ability to act as emulsifiers, achieve gelation, and impart foaming properties which makes them very versatile food ingredients.
Acid whey from cottage cheese or casein manufacture and sweet or rennet whey from cheese manufacturing involving rennet coagulation are the two basic forms of whey. Whey is principally composed of lactose, nitrogenous compounds, ash, and lipids. The two major proteins are β-lactoglobulin (β-LG) and α-lactalbumin (α-LA) which make up about 80% of
the whey proteins. The remaining 20% is composed of bovine serum albumin (BSA), immunoglobulins and a variety of other minor proteins (Schmidt et al., 1984).
There are several processes which can be utilized in order to recover the solids in whey, however the most prevalent methods are by ultrafiltration and diafiltration (Wong et al., 1996). This process results in whey protein concentrate (WPC) or the material can be further processed by ion-exchange to achieve whey protein isolate (WPI). Spray drying follows either process to produce whey protein powders which can vary in protein content from 35% to 85% on a dry basis for WPC or >90% for WPI.
Whey proteins are highly susceptible to heat treatment. In general, a heat treatment
of 60°C to 70°C results in protein denaturation. Higher temperatures may result in protein
whey proteins depends on the actual protein in question with α-LA having the lowest at
approximately 62°C. BSA follows at 64°C, Immunoglobulins at 72°C, and β-LG has the
highest denaturation temperature at 78°C (Brown, 1988). The susceptibility of the proteins
to be denatured tends to be depressed by the high amounts of lactose found in whey (de Wit, 1981; Jou and Harper, 1996).
Beta-Lactoglobulin
Beta-lactoglobulin is the major whey protein in bovine milk. This globular protein has a molecular weight of 18,362 for variant A and 18,276 for variant B and is comprised of 162 amino acids (Wong et al., 1996). Braunitzer et al. (1973) sequenced the primary
structure of β-LG. Variants A and B differ with regard to two amino acid residues; Gly and Ala in variant B are substituted in for Asp 64 and Val 118 in Variant A, respectively (Wong
et al., 1996). The secondary structure of β-LG has been determined to be 15% α helix, 50%
β sheet, and 15% to 20% reverse turn (Creamer et al., 1983). This molecule is composed of
nine strands which form an anti-parallel β-sheet in the shape of a flattened cone (Papiz et al.,
1986). The cone is hydrophobic in the interior while the opening comprises of hydrophilic amino acid residues (Wong et al., 1996). Cys 106 to 119 and Cys 66 to 160 form two
disulfides in the β-LG structure. In addition to the disulfides, Cys 121 is free and is located
at the sheet-helix interface (Wong et al., 1996).
With regard to conformational changes due to pH, β-LG is considered to be acid stable and does not denature at pH 2.0 (Wong et al., 1996). At the isoelectric point of 5.2 and alkaline pH, the molecule typically exists as a dimer which is formed by the association of
The denaturation temperature of bovine β-LG is above 65°C at pH 6.7 which can be
followed by aggregation (Gough and Jenness, 1962). The denaturation of the protein is due to conformational changes which result in the exposure of the buried Cys 121 residue resulting in association due to sulfhydryl-disulfide exchange (Wong et al., 1996). In general,
β-LG is considered to be highly heat sensitive at pH 4.0, and at pH 6.0 has maximum
stability, but decreases in stability as the pH increases (Wong et al., 1996).
In addition to the many food applications for β-LG, it has the biological function of binding retinal. It is considered to be a part of a group of proteins that is responsible for binding and/or transporting of small hydrophobic molecules (Ali and Clark, 1988). As a
monomer, β-LG has the capability to bind one retinol (Fugate and Song, 1980) and it is
speculated that this occurs in the interior hydrophobic barrel in the β-LG molecule. Alpha-Lactalbumin
Alpha-lactalbumin (α-LA) is the second most abundant protein in bovine whey. This
calcium binding protein has a molecular weight of 14,147 for variant A and 14,175 for variant B and is comprised of 123 amino acids (Wong et al., 1996). Brew et al. (1970)
sequenced the primary structure of α-LA variant B. Variant A differs with regard to one
amino acid which involves the replacement of Gln 10 for Arg (Wong et al., 1996). This
molecule is divided into two lobes due to a deep cleft which divides the ellipsoid shape of α
-LA. The structure is composed of four helices which form one side of the lobe, while two β
Calcium is considered to be the most critical mineral of whey to depress thermal denaturation (Schmidt et al., 1984). Of the whey proteins, α-LA binds calcium in addition to
other metals ions. The binding site for calcium can be found deep within the cleft region of the molecule.
Whey Protein-Casein Interactions
The thermal treatment of milk can be favorable or unfavorable depending on the particular application. Certain reactions may occur when milk is heated such as protein denaturation, which can either increase or decrease the functionality. For instance, preheating milk for the production of non-fat dry milk (NFDM) improves the functionality of
the resulting product by promoting the formation of β-lactoglobulin / κ-casein complexes
when used in bread making (Haque and Kinsella, 1988). However, in cheese making, this
complex reduces the vulnerability of κ-casein to chymosin (McGugan et al., 1954; Powell and Palmer, 1935; Tobias et al., 1952).
When milk is thermally processed several reactions can occur, including whey protein
denaturation and aggregation, as well as, the formation of complexes between β
-lactoglobulin and κ-casein (Hill, 1989). Law et al. (1994) showed that α-LA is also involved in casein-whey protein complexes.
Haque and Kinsella (1988) suggested that the driving force binding the molecules together is hydrophobic interactions when milk undergoes a mild heat treatment. However,
Jang and Swaisgood (1990) showed direct evidence for disulfide bond formation between β
The effect of temperature and pH on the formation of the β-LG / κ-casein complex
was investigated by Corredig and Dalgleish (1996). In general, they found that at a pH of 5.8 and as temperature increased from 75°C to 85°C, β-LG and α-LA reacted faster with casein.
They further showed that β-LG was more susceptible to changes in pH and temperature than
α-LA, however, their interaction kinetics were more similar when heated to below 85 to
90°C. The addition of α-LA to the system resulted in an increase in the amount of α-LA bound to casein and the rate at which it was bound. They proposed that the lower amount of
α-LA bound to casein is related to the amount of α-LA found in milk (Corredig and
Dalgleish, 1996).
Further work by Corredig and Dalgleish (1999) showed that increased amounts of β
-LG do not increase the amount of β-LG associated with the micelle; however, the maximum
concentration of β-LG / κ-casein was reached faster than the control of skim milk. This
suggests that there are a given number of sites available for reaction on a micelle with β-LG.
They further proposed that an intermediate is formed between β-LG and α-LA and that
intermediate interacts with the casein micelle.
Process Cheese
The first attempt to make process cheese occurred in 1895 without the use of emulsifying salts, however, the industrial production of process cheese did not occur until emulsifying salts such as phosphates were introduced into the cheese system (Caric, 1993). Industrial production began in Europe which was based on a Swiss patent which was issued in 1912. It is thought the idea was derived from the famous Swiss fondue dish which involves the melting of cheese in wine. Wine contains tartrate which has an emulsifying effect when coupled with cheese. Process cheese was introduced to the United States in 1917 by Kraft. This allowed for the utilization of cheese that would have previously been considered waste such as trimmings or deformed blocks. Additionally, process cheese allowed for prolonged periods of storage (Caric, 1993). Furthermore, process cheese can be made in a few hours which is an advantage to manufactures due to the decreased processing time. Process cheese is homogeneous and is consistent from batch to batch unlike natural cheese which has a tendency to be more variable. Also, with the addition of other dairy and non-dairy ingredients, a wide variety of textures and flavors are possible. The standards of identity of each of the process cheese categories are discussed in the following section.
Standard of Identity for Process Cheese and Substitute or Imitation Cheese
There are six general categories in the United States that define the standard’s of identity for process cheese products, and these categories are: pasteurized process cheese, pasteurized blended cheese, pasteurized process cheese food, pasteurized cheese spread, pasteurized process cheese spread, and substitute or imitation cheese products (Code of Federal Regulations, 2000). These products are produced by blending, heating, and mixing ingredients that are derived mainly from dairy products.
Pasteurized process cheese is produced by comminuting, mixing, and melting with the aid of heat, one or more cheeses of the same or two more varieties along with additional ingredients such as emulsifying salts to produce a homogeneous mass. Pasteurized process cheese must be heated to at least 65.5°C for a minimum of 30 seconds to destroy
microorganisms and phosphatase in cheese made from unpasteurized milk. There are specific regulations regarding the percentage amount of each variety of cheese used when two varieties are used. Additionally, there are regulations that pertain to the type of cheese used. Cream and Neufchatel cheese are not allowed nor cottage cheese, low-fat cottage cheese, cottage cheese dry curd and cooked cheese. In general, the fat content cannot be less than 47 percent (percent fat in dry matter), and the moisture content cannot exceed 43 percent. The pH of the final pasteurized process cheese cannot be below 5.3. Also, emulsifying salts cannot be more than 3 percent of the weight of the pasteurized process cheese. Additional ingredients are permitted such as acids, cream, water, salt, harmless artificial coloring, spices/flavoring, emulsifying salts, and other minor ingredients (Code of Federal Regulations, 2000).
Pasteurized blended cheese is similar to pasteurized process cheese; however,
cheese are permitted ingredients whereas they are not allowed for use in pasteurized process cheese (Code of Federal Regulations, 2000).
Pasteurized process cheese food is similar to pasteurized process cheese. The additional ingredients allowed in pasteurized process cheese are also allowed in pasteurized process cheese food along with other optional dairy ingredients such as milk, skim milk, buttermilk, cheese whey, whey proteins, anhydrous milkfat, albumin from cheese whey, dehydrated cream, and skim milk cheese. The moisture content cannot exceed 44 percent and the fat content cannot be less than 23 percent (expressed as percent fat). The pH of the pasteurized process cheese food cannot be below 5.0. There are several cheeses which are not permitted for use in pasteurized process cheese food including cream, Neufchatel, cottage, creamed cottage cheese, cook cheese, hard grating cheese, semi-soft part skim cheese, part-skim spiced cheese, and skim milk cheese for manufacturing (Code of Federal Regulations, 2000).
Pasteurized process cheese spread is similar to pasteurized process cheese food but also allows the use of other optional ingredients such as water conditioning agents and sweeteners. Additionally, carob bean gum, gum karaya, gum tragacanth, guar gum, gelatin, sodium carboxymethylcellulose, carrageenan, oat gum, algin, propylene glycol alginate, or xanthan gum may be used; however, the total weight of these substances cannot exceed 0.8% of the final food. Sweetening agents may be added in a quantity necessary for seasoning. Also, the pH of the spread cannot be below 4.0 (Code of Federal Regulations, 2000).
Substitute or imitation cheese products should partly or wholly substitute or imitate cheeses that are made with milk fat, milk protein or both by replacing those ingredients with ingredients primarily of vegetable origin to produce cheese analogues (Fox et al., 2000). Also, they can be made by the coagulation of filled or soya milk to produce filled cheese and tofu. In the United States, “an imitation cheese is defined as a product which is a substitute for, and resembles, another cheese but is nutritionally inferior, where nutritional inferiority implies a reduction in the content of an essential nutrient(s) present in a measurable amount but does not include a reduction in the caloric or fat content” (Code of Federal Regulations, 2000) Whereas, a substitute cheese resembles another cheese but is not considered nutritionally inferior. Substitute/imitation cheese products are produced by blending, heating, and mixing ingredients that are derived from dairy and/or vegetable products. Additionally, these cheese products do not have to contain natural cheese, but can be added to impart flavor and color. There are very few regulations, which dictate the ingredients or manufacturing processes for creating substitute/imitation cheese products. However, they can be placed into three basic categories: analogue cheese, filled cheese and tofu (Fox et al., 2000).
Filled cheese is made with vegetable oil instead of milk fat. The vegetable oil either partially or completely replaces the milkfat, which differentiates natural cheese from filled cheese (Fox et al., 2000).
Process Cheese Manufacture
The manufacturing procedure involves several steps as noted by Caric (1993): 1) selection of natural cheese, 2) blending, 3) shredding, 4) emulsifying salt addition, 5) processing, 6) optional homogenization, 7) packaging, 8) cooling, and 9) storage.
Selection of Natural Cheese
Process cheese can be produced from a single variety of natural cheese, however, it is more common for a variety of natural cheeses to be selected. When selecting the cheeses it is very important to consider the maturity, variety, flavor, pH, and texture. By creating successful blends, it is possible to use cheeses that are considered defective and would otherwise be waste.
Blending
advantages also come disadvantages such as sharp flavor, decreased emulsion stability and a soft texture (Thomas, 1977).
Other dairy and non-dairy ingredients can be included when producing process cheese spreads and foods. The most common ingredients are skim milk powder, casein-whey protein coprecipitates, casein-whey products, and milk fat. It is important to use these ingredients at a level that does not adversely affect the quality of the process cheese. Skim milk produces a process cheese that tends to increase the spreadability and stability as long as the level does not exceed 12% of the total mass (Caric, 1993). Milk protein coprecipitates also have the ability to improve stability, as well as, act as an emulsifier if used below 5% of the process cheese. The use of this ingredient allows for the reduction of emulsifying salts in the blend. Whey products such as whey protein concentrate are very common additional ingredients to the natural cheese blend. However, whey products that are low in lactose and mineral contents are more desirable because they produce a final product that has an acceptable flavor. The lactose content of all of these ingredients is of concern due to Maillard browning or caramelization, so the lactose content of process cheese should remain lower than 6% (Caric, 1993). Generally, milk fat is added to the blend in order to increase the total fat content of the cheese, however, the fat should be high quality. Vegetable fats are only used in process cheese analogs (Caric, 1993). All other ingredients such as meat, vegetables, spices, etc must be of good quality and flavor as to not affect the overall quality of the cheese.
Shredding
Emulsifying Salt Addition
This is the last step in the preparation of the cheese blend prior to thermal processing. Emulsifying salts are essential for process cheese production because when natural cheese is heated in the absence of emulsifying salts a gummy like substance is formed that undergoes oiling off. Emulsifying salts eliminate this problem by binding calcium thereby increasing caseins solubility. Due to the increased solubility of caseins, the emulsification properties of casein are increased. The protein surrounds the fat droplets, stabilizing the lipid, and also producing a smooth homogenized cheese (Fox et al., 2000). The binding of calcium is essential because calcium tends to depress the water solubility of the casein, which thereby reduces the emulsifying effect of the protein. Figure 4 depicts the action of the emulsifying salt which replaces calcium with sodium or binds to it in order to mask the effects (Shimp, 1985). Salts that have a monovalent cation (Na+) and a polyvalent anion (PO42-) are
generally more effective.
Processing
The thermal processing step in process cheese production involves either direct or indirect steam, constant agitation and a partial vacuum. For a batch process, typically one of two cookers is used, a round, double jacketed kettle or a tube shaped cooker. Sommer and Templeton (1939) described a 300-400 pound steam jacketed kettle for the production of process cheese. A steam press of 30 psi was circulated in the jacket for a final temperature of
65.5°C; however, higher temperatures of 71-77°C were used to produce cheeses with a softer
Wheeler and Scott (1925 and 1927) explained a method which involved directly cooking the cheese with steam in a lay down cooker. This resulted in cheese coming in contact with steam therefore additional moisture had to be accounted for in the formulation. The final cook time/temperature combination is highly variable. It depends on the cheese being produced and the equipment being used, therefore cooking temperatures vary between 71°C
to 95°C for 4 to 15 min (Meyer, 1973). However, for a continuous process, which involves
heating the cheese blend in a series of stainless steel tubes, the blend is heated to 130°C to
145°C for 2 to 3s (Kosikowski and Mistry, 1997).
Optional Homogenization
Homogenization of cheese reduces fat globule size, thereby increasing stability of the process cheese. Other benefits include, improved texture, appearance, structure and flavor. However, this step is not often used unless the cheese has a high fat content due to increased production costs and time (Caric, 1993).
Packaging
The hot process cheese is typically wrapped in lacquered foil which is then placed in tubes, cans, or cartons (cardboard or plastic). Slices are typically obtained by slicing rectangular blocks of cheese or the formation of the slices directly from the thermal process (Caric, 1993).
Cooling
Storage
Process cheese should be stored below 10°C (Caric, 1993).
Emulsification / Emulsifying Salts
The role of emulsifying salts in process cheese production is often misunderstood. Emulsifying salts are essential for the formation of a stable and homogenized product. The emulsification of the fat in process cheese is achieved with the use of emulsifying salts. These salts are not true emulsifiers meaning they are not amphiphilic molecules. However, they are responsible for solubilizing casein, which results in an emulsified product.
A dispersed liquid in a continuous liquid medium is the colloidal science definition of an emulsion. Typically either an oil in water or a water in oil emulsion is formed. Due to the incompatibility of oil and water, a surfactant is required to stabilize the emulsion. Surfactants or emulsifiers lower the tension at the oil-water interface and also orient themselves in such a way that the hydrophilic groups associate with the aqueous phase and the hydrophobic groups associate with the non-aqueous phase. Emulsions have the potential to become unstable which results in creaming, flocculation, and/or coalescence (Dickinson, 1992).
Casein molecules contain non-polar and polar amino acids thereby making them amphiphilic molecules. This enables them to function as emulsifiers. The water-soluble phase is due to polar amino acids and the calcium-phosphate group, which contains the majority of the protein’s charge, while the non-polar amino acids of the protein is the fat-soluble portion. Calcium tends to decrease the water solubility of the casein molecules, so if a large amount of calcium is present, then the overall water solubility will decrease. This leads to a poorly emulsified process cheese (Caric et al., 1985).
Emulsifying salts promote emulsification and aid in the formation of a homogeneous, smooth mass and are the most important factors for controlling emulsification in process cheese. The emulsifying salts commonly used have some ability to bind calcium however, some are more effective than others. These salts are not true emulsifiers because their primary role is to increase the solubility of casein by calcium sequestration. The emulsifying salts bind calcium, removing it from protein interactions, thereby increasing the solubility of casein. This allows for the release of casein from the cheese protein matrix, which in turn increases emulsification capability. Hydrated proteins can adsorb at the lipid/water interface, forming an interfacial film and a homogenized product (Caric et al., 1985; Fox et al., 2000).
Emulsifying salts are also used to help control the pH of the process cheese. For example, monosodium phosphate (NaH2PO4) is very acidic (pH = 4.5) and is not commonly
used alone as an emulsifying salt because it leads to crumbly cheese. However, it is often used along with other emulsifying salts such as disodium phosphate (Na2H2PO4) which has a
pH of 9.0 to control the final pH of the process cheese (Zehren and Nubaum, 2000).
important for the process cheesemaker to have a very good understanding of the effects of different emulsifying salts because they can greatly affect physical and chemical properties of the cheese.
Whey Protein Incorporation
The process cheese industry is interested in incorporating whey proteins into process cheese due to economic reasons, as well as, due to the abundance of whey proteins produced from natural cheese making. However, incorporating whey proteins into process cheese presents many challenges such as the effect on texture, flavor, and melt. The effects of whey proteins have not been clearly established due to variations in formulations and processing conditions used among investigators.
There is conflicting data concerning the affect of whey protein ingredients on process cheese products. The majority of the studies done in this area have shown that whey proteins increase the firmness of process cheese, however, one study did find a decrease in firmness. Gupta and Reuter (1993) found that by increasing the amount of whey protein concentrate (WPC) by partially replacing cheese solids resulted in an increase in firmness. Gupta and Reuter (1993) presumed the whey proteins unfolded during processing which led to the increase in firmness of the cheese because the cheese was cooked to a final temperature of 82°C. Thapa and Gupta (1992) also determined that whey protein concentrate increased the
firmness of process cheese when cheese solids were partially replaced. Thapa and Gupta (1992) speculated that the increase in hardness could possibly be attributed to the decrease in pH during storage of the cheese because Olson and Price (1961) found that the firmness of
incorporated polymerized WPI into a process cheese analog and showed that increasing whey proteins in a mixed rennet casein/WPI system resulted in an increase in the fracture stress; there was also an increase in the fracture strain (deformability) with increasing amounts of whey proteins. The fracture stress of casein/WPI gels increased at 3% WPI from approximately 10 kPa to 20 kPa, although WPI concentrations of 2% to 4% do not form gels independently. This indicates that WPI interacted with the casein network or a casein-whey mixed gel network was formed. Conversely, Salem et al. (1987) found that the addition of denatured whey protein in addition to the control mixture (increasing total nitrogen in the cheese from 7% to 22.5%) decreased the firmness of the process cheese product.
In addition to whey proteins affecting the firmness of process cheese products, they also have been shown to affect melting properties. In all of the studies that will be discussed, whey protein partially replaced cheese solids or casein. Al-Khamy et al. (1997) and Abd El-Salam et al. (1996) found that meltability of process cheese spread increased as the amount of WPC (13.5 – 17% protein) increased.
Conversely, Savello et al. (1989), Gupta and Reuter (1993), and Mleko and Foegeding (2000) found the meltability of the process cheese decreased with increasing levels of whey proteins. Savello, et al. (1989) replaced casein with either undenatured or
polymerized WPI and found that meltability decreased as measured by a modified Schreiber test.
Polymerized WPI was formed by a two-stage heating of WPI solutions. The first step was at pH 8.0 because this favors disulfide interactions because more thiol groups are deprotonated. The second step occurred at pH 7.0, which favors noncovalent interactions (Mleko and Foegeding, 1999). When double heated whey protein polymers were incorporated into a process cheese analog, the yield stress increased 28% more than native whey protein added at the same level. However, native and polymerized WPI decreased meltability to the same extent. From this it was concluded that a lower concentration of whey protein polymer could be used to achieve the same yield stress of that of a cheese made with native whey protein without changing the melt characteristics of the cheese (Mleko and Foegeding, 2000)
Fayed et al. (1999) determined that the spreadability of process cheese increased with the use of succinylated denatured whey proteins. The succinylated denatured whey proteins replaced the control denatured whey protein in the different cheese blends. El-Neshawy et al. (1988) also found that spreadability improved with the use of whey protein concentrates to partially replace cheddar cheese.
Measurement Techniques
Yield stress and meltability are two common measurements taken when analyzing process cheese. The yield stress of a material can be related to firmness and can be easily determined using simple rheological equipment. It is also important to consider the meltability of process cheese because consumers have certain expectations with regard to the melt of process cheese. There are several meltability methods used in the process cheese industry, but it is important to realize that these methods are highly empirical.
Yield Stress
The firmness of process cheese can be related to yield stress. A yield stress can be defined as the minimum stress required to initiate flow and exists in many materials such as clay, mayonnaise, ketchup and cheese. A material will respond as a solid below the yield stress and above the yield stress it responds as a liquid. Yield stress is an important property to know for processing reasons as well as for consumer needs. With regard to processing, the yield stress could influence the amount of power needed by a pump to move a product. It is important to consumers because they expect their food products to respond in specific ways. Researchers have determined the yield stress of various materials, such as apple sauce (Qiu and Rao, 1988), tomato concentrates (Yoo and Rao, 1995), plastic liquids (Keentok et al., 1985), clay suspensions (Alderman et al., 1991) to help characterize their products.
available to measure shear rates as low as 10-6 s-1. They further propose that a yield stress has never been measured and it has only been extrapolated (Barnes and Walter, 1985). So, if very sensitive equipment is used there may not be a yield stress, however, from a practical standpoint, the yield stress does exist.
Yield stress can be further characterized as dynamic or static by assuming that a thixotropic fluid has two types of structure. Dynamic yield stress results from the chemical structure within the material that is insensitive to shearing (or disruption). Additionally, when a material is at rest, a secondary structure can form over time which is called the static yield stress. It is expected that the static yield stress would be higher than a dynamic yield stress because the sample is not disrupted (Cheng, 1986; Steffe, 1996)
The apparent yield strain of the material can also be determined by using the vane method. This is a measurement of the distance the vane rotates before the material yields. However, this is not a true yield strain but is proportional to strain, so it can be used for comparisons (Daubert, 1998; Breidinger and Steffe, 2001). Breidinger and Steffe (2001) used a Haake Viscotester VT550 to calculate the apparent yield strain by using the following equation: π γ 2 Ω = t o where: o
γ = apparent yield strain, radians t = time to reach yield stress, s
Ω = rotation speed of the vane, rev/s
A similar equation was also used by Daubert et al. (1998) to calculate the yield strain using a Brookfield viscometer. Overall, the vane method has been utilized to determine the yield stress of many products including food dispersions (Yoo and Rao, 1995), protein foams (Pernell et al., 2000), ice cream (Briggs et al., 1996), and cheese (Truong and Daubert, 2001).
Where Mo is maximum torque; h is vane height; d is vane diameter; σo is the yield stress
(Dzuy and Boger, 1983).
Dzuy and Boger (1983) claim that it is essential that the vane rotate at a very low shear rate in order to detect the yield stress of the material. At high shear, error can be introduced by instrument inertia coupled with viscous resistance, which will lead to errors in the torque measurement. They tested a range of rotational speeds in a red mud sample and found that yield values were constant over a rotation speed of 0.1 to 8 rpm, but when the speed was increased out of this range, the yield stress increased. This range is specific for the sample being tested.
The vane can either be inserted below the top of the product being tested as shown in Figure 5, or as done in this study, the vane can remain flush with the top of the product. However, the dimensions of the vessel containing the sample and vane should be considered (Steffe, 1996). Steffe (1996) specifies the ranges of dimensions that should be adhered to when considering the vane and vessel dimensions. They should stay within the following limits (Figure 5):
Vane: 1.5 ≤ h/d ≤ 4.0 Z2/d ≥ 0.5
Z1 = 0.0
Z1/d ≥ 1.0
The dimensions of the vessel and vane are important because the sides of the vessel can influence the resulting stress if the vane is too close to the edge. This is also true if the vane is too long.
consider the yield stress and apparent strain of the material. For example, a product showing a low yield stress (indicating a more spreadable product) but can withstand large deformation before the product actually yields, leads to difficulty in obtaining uniform spreading (Daubert et al., 1998).
Melting Tests
It is desirable to produce process cheese that shows uniform melting which is a characteristic determining quality in many food applications. However, researchers and processors have used different empirical methods to measure the melt characteristics of cheese. Meltability may be defined as the distance cheese spreads upon heating. The three tests most commonly reported are the Schreiber test (Kosikowski and Mistry, 1997) and the Arnott test (1957) and the method described by Olson and Price (1958).
The Schreiber test involves samples (length, 4.8 mm; diameter, 41 mm) being placed in a preheated oven to 232°C for five minutes. The expansion of the samples after heating is determined by measuring the distance the cheese traveled on a set of 11 concentric circles along six lines (A-F). The Schreiber Number is the average of these six readings (Kosikowski and Mistry, 1997). Two problems associated with the Schreiber test are 1) irregular shaped cheese spread and 2) burning of outer edge of cheese spread. This results in additional error in an already emperical test, however, this test is still used due to its simplicity (Muthukumarappan et al., 1999).
The Arnott test involves preparing cheese cylinders (17 mm x 17 mm) and storing
them at 4°C until testing. The samples are then placed in a 100°C oven for 15 min. After
Park et al. (1984) attempted to determine the differences between the Schreiber and Arnott test, as well as, the affect of applying microwave technology to the two tests. Results showed that the two tests had reproducible results but did not correlate. It is hypothesized this is due to the differences in heating temperature and time. Microwave heating resulted in consistent results that correlate with the oven method for the Schreiber test. The microwave method reduces the testing time from 5 min to 1 min.
Olson and Price (1958) described a method to measure the melt of pasteurized process cheese spreads. This method was designed to eliminate the exposure of cheese to air during melting which tends to cause film formation resulting in uneven melting. Furthermore, this test forces the cheese spread to flow in one direction which aids in accurate measurement. Cheese cylinders are formed in Pyrex class tubes 33 mm in diameter. The tube is then placed on a rack in a vertical position and tempered for 30 min at 4.5°C. This is
followed by heating in a forced draft oven at 110°C for 6 min with the tube in a horizontal
position. The distance of the flow from the reference line is measured in millimeters. The tube undergoes a second heating in the oven for an additional 2 min. The total distance (mm) the cheese traveled is called “cheese-flow” (Olson and Price, 1958).
Conclusions
The addition of whey proteins to process cheese presents many challenges such as the effect on texture and melt. Due to variations in formulations and processing schedules, the effect of whey proteins have not been clearly established. Moreover, the role of lactose and mono- and disodium phosphate in the presence of whey proteins in process cheese is not understood with respect to physical properties.
Figure 4. Action of emulsifying salt (adapted from Berger et al., 1989)
CaHPO4
Ca++ HPO4 --
Ser OPO3H
-OPO3H
-Ser
Ca++
HPO4
--Na2HPO4
H2O
Ser
CaHPO4
OPO3H -Na+
OPO3H- Na+
Figure 5. 4-bladed vane and vessel dimension requirements (Steffe, 1996). a) side view of vane b) top view of vane c)vessel dimensions
dd
h
d d
h
D
Z2
Z2
a
b
INTRODUCTION
Process cheese products differ from natural cheese because they are not made directly from milk and may contain other ingredients such as water, butter oil, casein, whey proteins, and vegetable protein, as well as, other ingredients. They are produced by blending different varieties of natural cheese, emulsifying salts and other ingredients along with heat and mechanical shear until a smooth, homogeneous mass is formed (Caric, 1993). During initial heating and shearing, proteins are solubilized resulting in the emulsification of fat (Caric, 1993). The protein in the resulting product is in the form of short strands that connect to varying degrees thereby forming the protein network, and in this network the fat globules are uniformly distributed (Fox et al., 2000).
There are several factors that need to be controlled for proper network formation and to achieve the desired texture and meltability. These factors include pH, moisture, degree of shear, processing time and temperature, cooling rate, and concentration and type of emulsifying salt (Caric, 1993; Fox et al., 2000). Due to the large number of variables affecting process cheese production, it is difficult to have one formula and processing schedule, which makes it difficult to compare among process cheese studies.
concentration of emulsifying salt used. It was shown that as emulsifying salt concentration increased the pH of the cheese also increased. This could have influenced the results for firmness, which showed that higher concentrations of emulsifying salt resulted in softer cheese. Gupta et al. (1984) also studied the effect of emulsifying salts on cheese characteristics. It was shown that the pH of cheese was affected by the type and concentration of emulsifying salt in the formulation. For instance, acid emulsifying salts resulted in pH 5.2 or less which caused the formation of mealy, crumbly cheese.
Furthermore, the texture of process cheese is affected by moisture. Gupta and Reuter (1993) determined that as moisture content increased the firmness of process cheese decreased and meltability increased. This was also supported by Olson and Price (1961) who determined that as the moisture of process cheese increased firmness decreased.
there was a subsequent decrease in the firmness of the cheese, which could be due to a corresponding increase in pH. Moreover, emulsifying salt concentration has been shown to affect the meltability of process cheese. Abd El-Salam et al. (1996) determined that as the concentration of emulsifying salts (Joha S9S and Joha No) and whey protein increased the meltability of cheese spread also increased. This is supported by Savello et al. (1989) who found the melting properties of a model cheese to be highly dependent on the type of emulsifying salt and casein used in the formulation.
There has been limited research done in order to understand the role of lactose in process cheese production. Hong et al. (1990) determined that the firmness of process cheese decreased when natural cheese was replaced with lactose. Olson and Price (1961) also determined that when cheese-solids-not-fat were replaced with lactose at levels of 3% and 6%, the firmness of the process cheese decreased. In both of these studies, the protein concentration decreased which could possibly explain the decrease in firmness observed. Therefore, it is important to understand how lactose affects the physical properties of the cheese while maintaining a constant protein concentration.
Savello et al. (1989), Gupta and Reuter (1993), and Mleko and Foegeding (2000) found the meltability of process cheese decreased with increasing levels of whey proteins.
Of the whey proteins, β− lactoglobulin (β-LG) is the major whey protein in bovine
milk. A globular protein, β-LG, contains two disulfide bonds and one free cysteine (Wong et
al., 1996). With regard to conformational changes due to pH, β-LG is considered to be acid
stable and does not denature at pH 2.0. At the isoelectric point of 5.2 and alkaline pH, the molecule typically exists as a dimer which is formed by the association of the monomer at
the respective α helical segments.
The denaturation temperature of bovine β-LG is above 65°C at pH 6.7 which can be
followed by aggregation (Gough and Jenness, 1962). The denaturation of the protein is due to conformational changes which result in the exposure of the buried Cys 121 residue resulting in association due to sulfhydryl-disulfide exchange (Wong et al., 1996). In general,
β-LG is considered to be highly heat sensitive at pH 4.0, and at pH 6.0 has maximum
stability, but decreases in stability as the pH increases (Wong et al., 1996). Hoffmann and Mil (1999 and 1997) determined that in the range of pH 6.4 to 8.0 the heat induced whey protein aggregates formed were linked mainly by disulfide bonds. However at pH 6.0, disulfide bonds also played a role in aggregate formation, but larger non-covalently linked aggregates were formed.
polymers partially replaced rennet casein in a process cheese analog there was a subsequent increase in the yield stress (Mleko and Foegeding, 2000). One of the goals of the current study was to develop whey protein polymers from whey protein concentrate (pWPC), because Mleko and Foegeding (2000) only utilized whey protein isolate, and determine the performance of pWPC in a process cheese analog to determine how the physical properties of the cheese would be affected.
The texture of process cheese can be determined by numerous rheological methods. Large strain methods generally involve fracturing the material and can be correlated with sensory texture (Daubert and Foegeding, 1998). One such large strain measurement is to determine the yield stress, which gives an indication of the firmness of the material (Briggs et al., 1996; Daubert et al., 1998). Yield stress can be defined as the minimum stress required to initiate flow in a sample and can be measured using the vane method. Other large strain tests include compression and torsion, however, due to the softer consistency of process cheese, these tests are sometimes not applicable. Regarding cheese meltability, there are numerous empirical methods that can be used such as the Schreiber test (Kosikowski and Mistry, 1997), the Arnott test (Arnott, 1957) and the method described by Olson and Price (1958). Each of these tests has been used for determining the meltability of process cheese by a variety of researchers (Cavalier-Salou and Cheftel, 1991; Gupta and Reuter, 1993; Mleko and Foegeding, 2000; Mounsey and O'Riordan, 1999; Savello et al., 1989)
MATERIALS AND METHODS Material
The materials used were: whey protein isolate (WPI-94.56% protein) from DAVISCO Foods International (Le Sueur, MN), various whey protein concentrates (WPC) of differing whey protein contents, WPC–77.6% protein from New Zealand Milk Products (Harrisburg, PA) WPC-34.3% protein and WPC-35.7% protein from Foremost Farms (Baraboo, WI), rennet casein ALAREN 771 (81.2% protein) from New Zealand Milk Products, Inc. (Harrisburg, PA), anhydrous/clarified milk fat from Level Valley Creamery, Inc. (West Bend, WI), 88% lactic acid from Archer Daniels Midland Company (Decatur, IL), disodium phosphate, monosodium phosphate, and lactose from Sigma Chemical Co. (St. Louis, MO), and sodium chloride from Fischer Scientific (Pittsburgh, PA).
Preparation of Process Cheese Analogs
Disodium phosphate, monosodium phosphate, sodium chloride, lactose and when applicable, whey proteins, were mixed into approximately 80% of the total deionized water, which will be referred to as the wet mix. The pH of the wet mix was reduced to 5.8 using 88% lactic acid to ensure a final cheese pH of approximately 5.8. The amount of acid added to the wet mix was calculated and subtracted from the remaining water to be added.
Anhydrous milkfat (heated to 85°C) and rennet casein were mixed in the Stephan
mixer preheated to approximately 82°C at 300 rpm for 6 min. The wet mixture was then
added at room temperature and mixed at 300 rpm for 3 min. The cheese was further process using the following schedule: 5 min at 500 rpm, 1 min at 600 rpm, 1 min at 700 rpm, and 5 min at 2000 rpm. The cheese temperature was recorded every minute by Type T Thermocouple Thermometer from Omega Engineering, Inc (Stamford, Connecticut), which extended into the Stephan mixer.
The majority of the cheese was poured into three rectangular Plexiglas containers (11 cm x 5 cm) and cooled in a 30°C water bath for 30 min. The remainder was poured into
aluminum molds consisting of three cylinders with dimensions of 41 mm in diameter and 4.8 mm high to form melt test samples. The molds were placed in a watertight plastic bag and placed in a 30°C water bath for 30 min. After cooling, the Plexiglas containers were covered
with plastic lids while the molds were wrapped in plastic wrap. Both were stored at 4°C
overnight. The following day the containers and molds were equilibrated to room
temperature (21°C) for a minimum of 3 hrs before testing.
Preparation of Single Heated WPC Polymer
Whey protein concentrate at a concentration of either 5.0%, 5.5% or 6% protein (ex. pWPC – 5.0) was hydrated in 80% of the total allowable water and allowed to stir for one hour. The pH was adjusted to 8.0 using 1N NaOH followed by the addition of the remainder of the water for a total weight of 400 g. The solution was poured into 500 ml beakers (7 cm
zero was taken when the center of the beaker reached 80°C. The beakers were stored
overnight at room temperature until the following day.
Preparation of Double Heated Polymer
Double heated whey protein polymers were formed as described by Mleko and Foegeding (1999). WPC at a concentration of 4.5% protein (dhWPC – 4.5) was hydrated in 80% of the total water and stirred for 1 hour. The pH of the protein solution was adjusted to 8.0 using 1N NaOH and poured into a 500 ml beaker (7 cm diameter x 13 cm height). The
beaker was covered and heated in a 90°C water bath for 30 min; time zero was taken when
the center of the beaker reached 80°C. The beaker was equilibrated to room temperature, the
pH adjusted to pH 7.0 using 1N HCl. The remaining amount of water was added for a total
weight of 400 g. The sample then underwent a second heating at 90°C for 1 hr. The polymer remained at room temperature overnight.
Process Cheese Analog Formula
Protein (15%, w/w), water (52.4%, w/w), anhydrous milkfat (20.6%, w/w), and sodium chloride (2%, w/w) were held constant for all formulas tested. The control contained 2.5% disodium phosphate, 0.3% monosodium phosphate and 3.75% lactose. The remainder of the cheese mixture consisted of salts and other material from rennet casein to produce an 800 g cheese batch.
Whey Protein Incorporation
protein from rennet casein. Lactose was adjusted to account for differences in non-protein components among the whey protein ingredients.
Polymer Incorporation
The amount of polymer required to replace 2% protein from casein with 2% protein from pWPC was determined. Lactose was dispersed in the remaining amount of allowable water in the cheese formulation. To incorporate the polymer into cheese, the salts were added directly to the Stephan mixer, followed by polymer, the remaining water, and the amount of lactic acid required to produce a final cheese pH of 5.8.
Emulsifying Salts and Lactose Experiment
The ratio of disodium phosphate to monosodium phosphate was held constant at 8.3:1. Emulsifying salts were added at 2.0%, 2.4%, or 2.8%. Lactose was adjusted to account for the loss of weight from the reduced amount of emulsifying salt. In a separate experiment, 2.8% emulsifying salts were used and lactose was added at 0%, 2.2%, or 4.4% levels. Sucrose replaced the weight loss from lactose to maintain a constant 800 g cheese batch. The formulas consisted of 11% protein from casein and 4% protein from WPI-94.6.
Large Strain - Yield Stress
Yield stress (Dzuy and Boger, 1983) 1 3
6
1
2
−
+
=
d
h
d
M
o oπ
σ
where:σo = yield stress
Mo = maximum torque
h = vane height d = vane diameter
Apparent strain (Breidinger and Steffe, 2001; Daubert et al., 1998):
π γ 2 Ω = t o where: o
γ = apparent yield strain, radians t = time to reach yield stress, s
Ω = rotation speed of the vane, rev/s
The vane was slowly inserted into the sample, using a laboratory jack to minimize sample damage, until the sample reached the top of the vane. The vane was rotated at 0.3 rpm until the material yielded. Two measurements were taken in each container for a total of 6 measurements per replication.
Small Strain Rheology
Whey protein polymers were characterized rheologically using a controlled stress rheometer (Stresstech Rheometer, ATS Rheosystems, Bordontown, NJ/Reologica Instruments AB, Lund Sweden). Polymers were prepared as stated above and transferred to the plate attachment, and the cone (diameter = 40 mm and cone angle = 4°) was slowly
inserted into the sample. The cone and plate configuration was used for stress and frequency
Stress sweeps, from 0.1 to 3.0 Pa for pWPC - 5.0, pWPC – 5.5, and dhWPC – 4.5 and from 0.1 to 20.0 Pa for pWPC – 6.0, were conducted in oscillatory mode to establish the
linear viscoelastic region (LVR) of the solutions at 25°C. A frequency of 0.05 Hz was used for all stress sweeps. On the basis of those results stresses of 0.2 Pa for pWPC – 5.0 and dhWPC – 4.5, 0.6 Pa for pWPC – 5.5, and 0.75 Pa for pWPC – 6.0 were chosen for the frequency sweeps of the polymers. Frequencies from 0.001 to 20 Hz were tested on
polymers at 25°C. Each test was done in duplicate for each of the three replications.
Moisture
Moisture of process cheese was determined using a modified AOAC official method (AOAC method # 926.08) (AOAC, 1995). Samples were ground in a mixer (AOAC method # 955.30) (AOAC, 1995) and approximately 2-g of sample were weighed into a round aluminum weighing dish and covered with a glass fiber filter circle (Fischer Scientific, Pittsburgh, PA). The dishes were placed into a steam bath for 1 hr followed by heating at -92
kPa for 3 hrs at 70°C. Samples were tested in duplicate.
Meltability