University of Windsor University of Windsor
Scholarship at UWindsor
Scholarship at UWindsor
Electronic Theses and Dissertations Theses, Dissertations, and Major Papers
2016
Effect of Plastic Deformation on Friction Behaviour of Aluminum
Effect of Plastic Deformation on Friction Behaviour of Aluminum
Sheets at Elevated Temperatures
Sheets at Elevated Temperatures
Zeyuan Cui
University of Windsor
Follow this and additional works at: https://scholar.uwindsor.ca/etd
Recommended Citation Recommended Citation
Cui, Zeyuan, "Effect of Plastic Deformation on Friction Behaviour of Aluminum Sheets at Elevated Temperatures" (2016). Electronic Theses and Dissertations. 5726.
https://scholar.uwindsor.ca/etd/5726
This online database contains the full-text of PhD dissertations and Masters’ theses of University of Windsor students from 1954 forward. These documents are made available for personal study and research purposes only, in accordance with the Canadian Copyright Act and the Creative Commons license—CC BY-NC-ND (Attribution, Non-Commercial, No Derivative Works). Under this license, works must always be attributed to the copyright holder (original author), cannot be used for any commercial purposes, and may not be altered. Any other use would require the permission of the copyright holder. Students may inquire about withdrawing their dissertation and/or thesis from this database. For additional inquiries, please contact the repository administrator via email
Effect of Plastic Deformation
on Friction Behaviour of Aluminum Sheets
at Elevated Temperatures
By
Zeyuan Cui
A Thesis
Submitted to the Faculty of Graduate Studies
through Engineering Materials
in Partial Fulfillment of the Requirements for
the Degree of Master of Applied Science at the
University of Windsor
Windsor, Ontario, Canada
2016
Effect of Plastic Deformation on Friction Behaviour of
Aluminum Sheets at Elevated Temperatures
By
Zeyuan Cui
APPROVED BY
:
______________________________________________
Dr. D. Green (Outside Program Reader)
Department of Mechanical, Automotive and Materials Engineering
______________________________________________
Dr. V. Stoilov (Program Reader)
Department of Mechanical, Automotive and Materials Engineering
______________________________________________
Dr. A. T. Alpas (Advisor)
Department of Mechanical, Automotive and Materials Engineering
iii
DECLARATION OF ORIGINALITY
I hereby certify that I am the sole author of this thesis and that no part of this thesis
has been published or submitted for publication whatsoever all across engineering lines.
I certify that, to the best of my knowledge, my thesis does not infringe upon anyone’s
copyright nor does it violate any proprietary rights and that any ideas, techniques,
quotations, or any other material from the work of other people included in my thesis,
published or otherwise, are fully acknowledged in accordance with the standard referencing
practices. Furthermore, to the extent that I have included copyrighted materials that
surpasses the bounds of fair dealing within the meaning of the Canada Copyright Act. I
certify that I have obtained a written permission from the copyright owner(s) to include
such material(s) in my thesis and have included copies of such copyright clearances to my
appendix. I truly declare that this is a genuine copy of my thesis, including any final
revisions, as approved by my thesis committee and the Graduate Studies office, and that
this thesis has not been submitted for a higher degree to any other University or Institution
iv
ABSTRACT
This study examines the tribological behaviour of AA6061 alloy sheets at elevated
temperatures including a study of the deformation mechanisms and their effects on friction
behaviour. The role of the atmosphere is given particular importance when studying the
surface morphology and that developed during high temperature deformation.
Friction tests were performed with an operating temperature range of 350 to 545°C,
using strain rates between 1x10⁻² and 4x10⁻²s-1. The measured COF in argon was higher
than that in air due to the absence of fresh oxide layer formed inside the sliding track.
Junction strength tests were performed in air and argon for the AA6061 alloy. The junction
strength of AA6061 in argon was higher than that measured in air as no oxide layer formed
on the surface of alloy.
Deformation mechanisms were identified for AA6061. COF-deformation
mechanism map established relationships between the tribological behaviour and
v
DEDICATION
To my parents,
Jin Cui and Xiaohong Tang
and my grandmother
vi
ACKNOWLEDGEMENTS
My sincerest gratitude and thanks to Dr. A. T. Alpas for his dedicated supervision,
valuable suggestions, guidance and patience throughout this research during M.A.Sc. at the
University of Windsor.
I would also like to thank my committee members, Dr. D. Green and Dr. V. Stoilov,
for their time and helpful suggestions. Technical help from Mr. A. Jenner and Mr. S.
Budinsky are greatly acknowledged. Special thanks to Dr. S. Bhattacharya and Mr. O. Gali
for their constant encouragement and support.
I appreciate and thank all fellow researchers at the Tribology of Materials Research
vii
TABLE OF CONTENTS
DECLARATION OF ORIGINALITY ... iii
ABSTRACT ... iv
DEDICATION ... v
ACKNOWLEDGEMENTS ... vi
LIST OF FIGURES ... xi
CHAPTER 1 INTRODUCTION ... 1
1.1 Background ... 1
1.2 Thesis objective ... 4
1.3 Organization of the thesis ... 5
CHAPTER 2 LITERATURE REVIEW ... 7
2.1 Background of forming process ... 7
2.1.1 The forming process ... 7
2.1.2 Superplastic forming (SPF) and quick plastic forming (QPF) ... 8
2.1.3 Friction in hot forming ... 8
2.1.4 Adhesion in hot forming ... 9
2.2 Deformation mechanisms for superplastic forming ... 12
2.2.1 General creep equation ... 12
2.2.2 Diffusional flow ... 13
2.2.3 Grain boundary sliding (GBS) ... 14
2.2.4 Viscous glide controlled creep ... 17
2.2.5 High temperature deformation mechanisms in Al an Al-Mg alloys ... 18
2.3 The disturbed layer ... 19
viii
2.3.2 The ultra-fine grain of the sub-surface ... 21
2.3.3 Surface oxidation behaviour of Al-Mg alloy ... 21
2.3.4 Oxide ligament (fibre) formation within the oxide layer ... 23
2.3.5 Junction strength ... 24
2.3.6 Effect of oxide ligament (fibre) formation on friction ... 25
2.3.7 Effect of atmosphere on the tribological behaviour ... 26
CHAPTER 3: EXPERIMENTAL METHODOLOGY ... 51
3.1 Introduction ... 51
3.2 Hot forming experiments... 51
3.2.1 Heat treatment of the workpiece ... 51
3.2.2 The counterface material ... 52
3.2.3 Laboratory simulation ... 52
3.3 Adhesion force measurement by junction strength experiments... 55
CHAPTER 4: RESULTS ... 68
4.1 Introduction ... 68
4.2 Variation of COF with temperature and applied strain rate in air ... 69
4.3 Surface deformation and damage at high temperature in air ... 70
4.3.1 Pre-existing surface oxide ... 70
4.3.2. Surface morphology after deformation at 545 °C ... 70
4.3.3. Effect of strain rate on surface oxide ... 71
4.3.4. Surface morphology after deformation at 350 °C ... 72
ix
4.4 Wear track observation on the strips deformed in air ... 73
4.5 Adhesion and material transfer to P20 steel in air ... 73
4.6. Deformation mechanisms of the material at high temperatures ... 74
4.6.1. Mechanisms identified based on stress-strain rate data ... 74
4.6.2 Variation of the surface roughness ... 76
4.7 Variation of coefficient of friction (COF) with temperature and applied strain rate in argon. ... 77
4.8 Surface deformation and damage of polished strips at high temperature in an argon atmosphere... 78
4.8.1. Surface morphology after deformation at 545 °C in an argon atmosphere .... 78
4.8.2. Surface morphology after deformation at 350 °C in argon ... 79
4.9 Wear track and adhesion comparison in argon and air. ... 79
4.10 Junction strength tests ... 80
4.10.1 Measurement of junction strength of AA6061 alloys in comparison with others against steel in Air. ... 80
4.10.2 Analyses of the material transfer to steel from different alloys in air. ... 81
4.10.3 Microstructure of Al-Mg pins after sliding tests against steel in air. ... 82
4.10.4 Comparison of junction strength of AA6061 in Air and Argon ... 82
4.10.5 Comparison of material transfer and surface analyses of AA6061 in Air and Argon. ... 83
4.11 Summary of the results ... 84
CHAPTER 5: DISCUSSION... 132
x
5.2 Relationship between COF and deformation mechanisms... 132
5.3 Surface microstructure and morphology of the deformed alloy ... 134
5.3.1 Surface oxide damage mechanisms and oxide fibres formation in AA6061 alloy at 350 – 545oC in air ... 135
5.3.2 Surface oxide damage features and oxide fibres formation in AA6061 alloy at 350 – 545oC in argon. ... 136
5.4 Variation of COF in air and argon... 138
5.4.1 Friction test with tribolayer in air and argon. ... 138
5.4.2 Effect of surface condition on friction behaviour in air ... 139
5.4.3 Friction test without tribolayer in air and argon. ... 140
5.5 Adhesion and surface oxidation in junction strength tests ... 141
5.5.1 Effect of Mg content on adhesion and surface oxidation ... 141
5.5.2 Effect of atmosphere on adhesion and surface oxidation ... 142
CHAPTER 6: SUMMARY AND RECOMMENDATIONS ... 159
6.1 Summary ... 159
6.2 Recommendations for future work ... 161
LIST OF REFERENCES ... 162
xi
LIST OF FIGURES
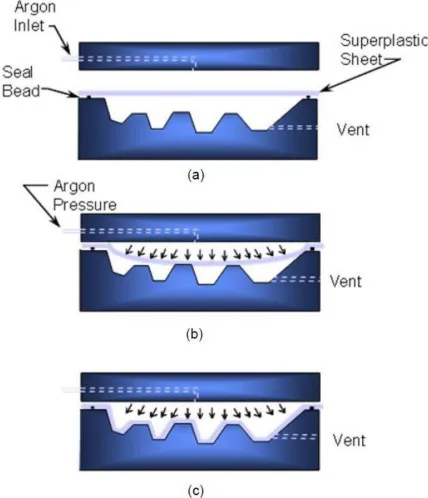
Figure 2.1 Schematic representation of the hot-forming process – (a) sheet of metal is
sealed around its periphery between an upper and lower die. The dies and sheet are
maintained at the SPF temperature. (b) the sheet is heated to its superplastic temperature
range, gas pressure is injected through inlets in the upper die (c) the lower cavity is
maintained under vacuum or can be vented to the atmosphere and at the same time gas
pressure is used to form the sheet down over the tool. ... 28
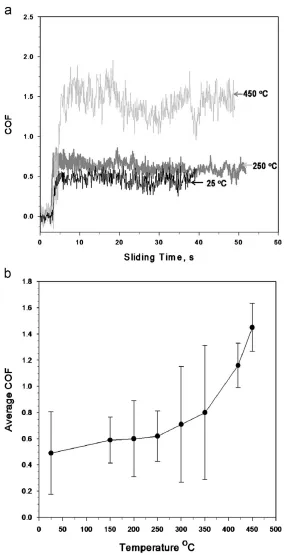
Figure 2.2 (a) COF vs. sliding time plots at25oC, 250oC and450oC that show the measured
COF during experiments at 0.04 s-1(b). Average COF vs. temperature plot
forAA5083alloy [25]. ... 29
Figure 2.3 Secondary electron images of AA5083 aluminium alloy strip surface after
deformation under a strain rate of 4×10⁻² s−1 at (a) 25 °C, (b) 150 °C, (c) 200 °C, (d)
250 °C, (e) 300 °C, (f) 350 °C, (g) 400 °C, and (h) 450 °C [25]. ... 30
Figure 2.4 (a) Average COF vs strain rate plot. (b) Average COF vs temperature plot [26].
... 31
Figure 2.5 Secondary electron images of material transferred to P20 steel pin from
AA5083 aluminium at (a) 25 °C, (b) 150 °C, (c) 200 °C, (d) 250 °C, (e) 300 °C, and (f)
350 °C [25]. ... 32
Figure 2.6 Secondary electron images of material transferred to P20 steel pin from the
as-received (with tribolayer) AA5083 aluminium alloy at (a) 350 °C, (b) 450 °C and (c)
545 °C [31]. ... 33
Figure 2.7 Secondary electron images of material transferred to P20 steel pin from the
polished AA5083 aluminium alloy at (a) 350 °C, (b) 450 °C and (c) 545 °C illustrating
the initial contact area (A0) [31]. ... 33 Figure 2.8 Deformation mechanism map for AA5083 plotted on temperature vs strain rate
axes, where the regions of dominance for each mechanism are identified based on the
stress exponent value n. The contours are for constant stress exponent values [26]. ... 34
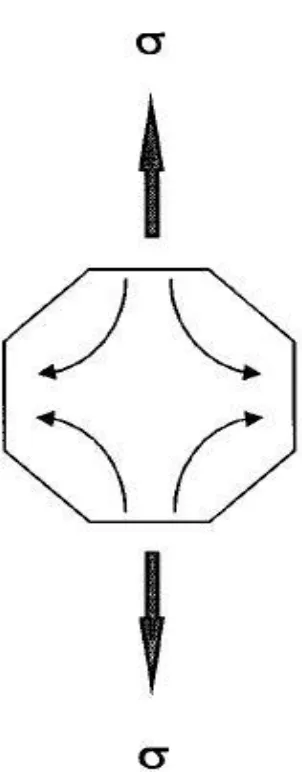
Figure 2.9 Nabarro-Herring model of diffusional flow. Arrows indicate the flow of
vacancies through the grains from boundaries lying normal to the tensile direction to
parallel boundaries. Thicker arrows indicate the tensile axis [35]. ... 35
xii Figure 2.11 The principle of the model of Ashby and Verrall [36] for grain
rearrangement by diffusion ... 37
Figure 2.12 Schematic illustration of the mechanism of superplasticity developed by Ball
and Hutchison [39]. At any instant during deformation, of grains whose boundaries are
suitable aligned will slide as groups. The shear stress on the group becomes concentrated
on any grain or protrusion that obstructs motion of the group. The local stresses would
generate dislocations in the blocking grain and dislocations would pileup at the opposite
grain boundary until their back stress prevents further generation of dislocations and thus
further sliding by the group. ... 38
Figure 2.13 Steady-state creep rate versus applied stress for an Al-2.2at%Mg alloy at
300oC. Three different creep regimes, I, II, and III, are evident [33]. ... 39
Figure 2.14 Deformation mechanism map (DMM) for pure aluminum of grain size 10
μm, showing boundary and lattice diffusion controlled diffusional flow, dynamic
recrystallization and power law creep [42]. ... 40
Figure 2.15 DMM for aluminum alloy at 800K [43]. ... 41
Figure 2.16 Minimum strain rate v. stress curves showing slopes for stress exponent n=1
and stress exponent n=3. ... 42
Figure 2.17 Schematic representation of the subsurface layer containing the
micriocrystalline oxides mixed with the small grained metal and covered with the
continuous surface oxide: (A) thickness of the continuous surface oxide, 250 – 1600 Å;
(B) thickness of the mixed subsurface layer, 1.5 – 8 μm [50]. ... 43
Figure 2.18 Schematic model of the growth of the oxide film on Al-Mg alloys during heat
treatment [57] – (a) oxide crystallites nucleate and the thickness increases by grain
boundary diffusion of aluminum and magnesium to the free surface, (b) The difference in
diffusivity of the species ensures that the surface becomes magnesium-rich and MgO
islands forms on the surface, (c) Al2O3 in the film is reduced by the outwardly diffusing
magnesium to form the spinel MgAl2O4, and (d) this leaves free aluminum within the
oxide and also leaves MgO islands that join to form an aluminum-free surface. ... 44
Figure 2.19 The average value of junction strength for each alloy (maximum tangential
xiii Figure 2.20 COF of AA5083 and AZ31 alloys for same homologous temperatures at
different strain rates [61]. ... 46
Figure 2.21 FIB cross-section of deformed surface taken along the tensile axis to illustrate
the superplastic ligament formed at the surface offset that resulted from GBS [61]. ... 47
Figure 2.22 Surface morphology of the strip deformed at T = 818 K (545 oC) and dϵ/dt =4
x 10-2s-1 [26]. ... 48
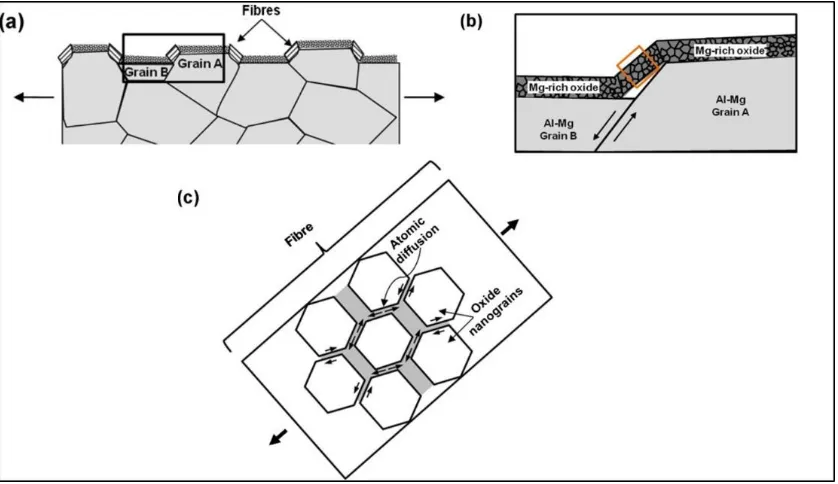
Figure 2.23 Schematics showing (a) GBS of bulk Al-Mg grains leads to the formation of
steps at the surface. (b) Surface step formed at the grain boundary due to relative sliding
between grain A and grain B of Al-Mg, and the tribo-layer above the grains stretched
over this step generating a fibrous structure. (c) Suggested microscopic process
responsible for the formation of fibres from the tribo-layer on the surface of the hot
deformed AA5083 alloy (representing the magnified view of the fibres in the box shown
in plate (b)) [62]. ... 49
Figure 2.24 Secondary electron images of (a) oxide fibres located within the sliding track
generated on the as-receivedAA5083 aluminium alloy at 545 1C and also shows the
fibres formed on the tribolayer surface outside the sliding track (b) higher magnification
image of boxed area in (a) which shows sliding debris lying on the oxide fibres [31]. .... 50
Figure 3.1Experimental methodology of the hot forming test. ... 58
Figure 3.2 Experimental methodology of the junction strength test. ... 59
Figure 3.3 Cross-sectional SEM image of AA6061 alloy showing the tribolayer covered
on the surface. ... 60
Figure 3.4 Image showing the polished pin used in the friction tests ... 61
Figure 3.5 Schematic of the experimental setup that shows the AA5083 strip under sliding
contact against the P20 steel pin being stretched by the linear actuators. ... 62
Figure 3.6 Photograph of the tribometer and heater assembly. ... 63
Figure 3.7 Photograph of the installation of the chamber on the tribometer. ... 64
Figure 3.8 AA6061 strip inscribed with grids that shows elongation along the direction of
the applied strain while being pulled. ... 65
Figure 3.9 Major and minor strain of the AA6061 strip, measured from two consecutive
xiv Figure 3.10 (a) Schematic view of setup and (b) Experimental setup for junction strength
experiment. ... 67
Figure 4.1 Typical COF vs. time curves at different strain rates: (a) at 0.01s-1 (b) at 0.04s-1
... 86
Figure 4.2 Aaverage COF vs. time plot: (a) at different temperatures (b) at different strain
rates. Error bars indicate range of fluctuations in mean COF values measured over 100 s
time test period on each strip (following the initial 20 s heating period) at a constant
temperature and strain rate. ... 87
Figure 4.3 Average COF values plotted on temperature vs. strain rate axes in air. ... 88
Figure 4.4 Secondary electron image showing the surface morphology of as-received
AA6061 strip surface. ... 89
Figure 4.5 Three-dimensional surface profile showing the surface morphology of
as-received AA6061 strip surface. ... 90
Figure 4.6 Secondary electron image showing the surface morphology of as-received
AA6061 strip deformed at elevated temperatures (545 °C and 4 × 10⁻² s-1). ... 91
Figure 4.7 Three-dimensional surface profile showing the surface morphology of
as-received AA6061 strip deformed at elevated temperatures (545 °C and 4 × 10⁻² s-1). ... 92
Figure 4.8 A higher magnification view of the sample surface deformed at 545 °C and 4 ×
10-2 s-1. Surfaces are covered by oxide layers, and GBS beneath oxide layers is evident. 93
Figure 4.9 SEM micrograph of the deformed surface corresponding to the condition
(545 °C and 1 × 10⁻² s-1) where a few oxide ligaments were observed at the grain
boundaries. ... 94
Figure 4.10 SEM micrographs of the sample deformed at 350 °C and 4 × 10⁻² s-1. Cracks
in surface oxide indicate the brittle nature of the oxide at low temperatures. ... 95
Figure 4.11 Crack width and fibre length vs. temperature plot at 0.04s-1 shows the length
of superplastic fibres increases with temperature. Crack width indicates the width of the
brittle cracks occurred on the grains. ... 96
Figure 4.12 Optical microstructure of the wear tracks on unpolished AA6061strips
obtained in air at 0.04s-1: (a) at 350oC, (b) at 450oC, (c) at 545oC... 97
Figure 4.13 SEM images of the wear tracks on unpolished AA6061strips obtained in air
xv Figure 4.14 Changes in the width of the sliding induced wear track on the AA6061 strip
unpolished condition in contact with the P20 steel pin at various temperatures and 0.04s-1.
... 99
Figure 4.15 3-D profilometery images of material adhered to counterface, P20 pin while
sliding against AA6061 strips at έ = 4× 10⁻² s-1 : (a) T = 350oC, (b) T = 450oC, (d) T =
545oC ... 100
Figure 4.16 Variation of material transferred to counterface P20 Pin while sliding against
AA6061 strips at έ = 4× 10⁻² s-1 ... 101
Figure 4.17 Tensile loads applied to AA6061 strips at different strain rates at (a) 350 °C;
(b) 450oC and (c) 545 °C. (The time axis indicates the duration of the test, during which a
different section of the forward moving strip – 170 mm in length – passes through the hot
zone. The flow stress of the strip was measured at the section that enters the hot zone.).
(d) Flow stress calculated from experimental data in (a) to (c) and plotted on temperature
vs. strain rate axes. ... 103
Figure 4.18 Strain rate vs. modulus compensated flow stress plots following the general
creep equation where ‘n’ is the stress exponent. ... 104 Figure 4.19 Deformation mechanism map (DMM) for AA6061plotted on temperature vs.
strain rate axes, where the regions of dominance for each mechanism are identified based
on the stress exponent value, n. The contours are for constant stress exponent values. .. 105 Figure 4.20 Surface roughness measurement for surface deformed at four temperatures (a)
T = 350oC, (b) T = 400oC, (c) T = 450oC, (d) T = 545oC. ... 107
Figure 4.21 Surface roughness map for AA6061 plotted on temperature vs. strain rate
axes, where the regions of dominance for each mechanism are identified based on the
stress exponent value, n. The contours are for constant surface roughness Ra. ... 108 Figure 4.22 COF vs. sliding time plot for unpolished strips at three temperatures and
strain rates of 4 × 10⁻² s-1 in (a) argon and (b) in air. ... 109
Figure 4.23 Average COF vs. temperature plot for unpolished strips at three temperatures
and strain rates of 4 × 10⁻² s-1 in argon and air, where error bars indicate range of
fluctuations in mean COF values. ... 110
Figure 4.24 COF vs. sliding time plot for polished strips at three temperatures and strain
xvi Figure 4.25 Average COF vs. temperature plot for polished strips at three temperatures
and strain rates of 4 × 10⁻² s-1 in argon and air, where error bars indicate range of
fluctuations in mean COF values. ... 112
Figure 4.26 Secondary electron image showing the surface morphology of as-received
AA6061 strip deformed at elevated temperatures in argon (545 °C and 4 × 10⁻² s-1). .... 113
Figure 4.27 A higher magnification view of the sample surface deformed in argon at
545 °C and 4 × 10⁻² s-1. Surfaces offset formed due to GBS. ... 114
Figure 4.28 Secondary electron image showing the surface morphology of as-received
AA6061 strip deformed at elevated temperatures in argon (350 °C and 4 × 10⁻² s-1). .... 115
Figure 4.29 . SEM micrographs of the sample deformed in argon at 350 °C and 4 × 10⁻² s
-1. Cracks in surface oxide indicate the brittle nature of the oxide at low temperatures and
no fibre formed in the crack. ... 116
Figure 4.30 Optical microstructure of the wear tracks on unpolished AA6061strips taken
from optical microscope obtained in argon at 0.04 s-1: (a) at 350oC, (b) at 450oC, (c) at
545oC. ... 117
Figure 4.31 Changes in the width of the sliding induced wear track on the AA6061 strip
unpolished condition in contact with the P20 steel pin at various temperatures in air and
argon environment. ... 118
Figure 4.32 Comparison of 3-D profilometery images of material adhered to counterface
P20 Pin while sliding against AA6061 strips with tribolayer in air and argon environment.
... 119
Figure 4.33 Comparison of transferred material to counterface: (a) maximum height of
material transferred to counterface P20 pin while sliding against AA6061 Strips with
tribolayer. (b) Area of material transferred to counterface P20 pin while sliding against
AA6061 Strips with tribolayer. ... 120
Figure 4.34 (a) The variations of the tangential forces versus time for each of the alloys
tested. (b) Average values of junction strength for each alloy (maximum tangential stress
reached before the failure of adhesive junction). ... 121
Figure 4.35 Microstructures of transferred material on M2 steel counterface surfaces
xvii Figure 4.36 3-D profilometry images of the adhered material on the steel counterface
surfaces tested against different alloys in air: (a) AA1100, (b) AA6061, (c) AA5083, (d)
AZ91. ... 123
Figure 4.37 Comparison of transferred material to M2 steel counterface: (a) maximum
height of material transferred to counterface sliding against alloys with different Mg
content (b) Area of material transferred to counterface sliding against alloys with different
Mg content. ... 124
Figure 4.38 EDS maps of the elements, Al, Mg, Fe, O, found on the contact areas on steel
counterface after testing against alloys with different magnesium content in air. The
images on the column (a) are the BSE images of the same areas for each alloy tested,
column (b) (c) (d) (e) are element maps of Mg, Al, O, Fe. ... 125
Figure 4.39 2-Dimensional surface profile measurements of the pin tips, starting from
point A and continuing upto B of a representative tip (shown in the inset), after sliding
tests. ... 126
Figure 4.40 EDS maps of the elements, Al, Mg, Fe, O, found on the contact areas on alloy
surface after testing against with counterface in air. The images on the column (a) are the
SE images of the same areas for each alloy tested, column (b) (c) (d) (e) are element maps
of Mg, Al, O, Fe. ... 127
Figure 4.41 (a) The typical curve of tangential forces versus time for AA6061 tested in air
and argon. (b) Average values of junction strength for AA6061 in air and argon
(maximum tangential stress reached before the failure of adhesive junction). ... 128
Figure 4.42 3-D profilometry images of the adhered material on the steel counterface
surfaces tested against AA6061 alloys in (a) air, (b) argon ... 129
Figure 4.43 Secondary electron images showing the surface morphology of AA6061 pin
deformed at 420oC: (a) in air (b) in argon ... 130
Figure 4.44 EDS maps of the elements, Al, Mg, Fe, O, found on the contact areas on
AA6061 alloy surface after testing against with counterface in air and argon. The images
on the column (a) are the SE images of the same areas for each alloy tested, column (b)
(c) (d) (e) are element maps of Mg, Al, O, Fe. ... 131
Figure 5.1 The combined coefficient of friction-deformation mechanism map
xviii values from Figure 4.3 are superimposed on the DMM from Figure 4.19. The contours
represent iso-COF values. ... 145
Figure 5.2 Secondary electron image showing the surface morphology of tribolayer
covered AA6061 strip: (a) deformed at 545 °C and 4 × 10⁻² s-1 GBS occurs (b) deformed
at 350 °C and 4 × 10⁻² s-1 power law creep occurs. ... 146
Figure 5.3 3-D optical surface interferometry profiles of the surfaces of AA6061 alloy
strips deformed at 545 °C and (a) 1 × 10⁻² s-1, (b) 2 × 10⁻² s-1 and (c) 3× 10⁻² s-1; (d) 4×
10-2 s-1 .The plots below the 3-D profiles are 2-D profiles that show grain boundary step
heights on the strip surface. The dash line indicates the traverse length. ... 147
Figure 5.4 Variation of the step height against the against strain rate at 545oC. ... 148
Figure 5.5 COF as a function of (step height/ flow stress) showing the combined effect of
surface characteristics and mechanical behaviour on COF. ... 149
Figure 5.6 Crack formed on the oxide layer in air at 350oC with fractured fibres (a) SEM
observation on the oxide layer at 350 °C and (b) The schematic representation of surface
damage features at 350 °C. ... 150
Figure 5.7 Superplastic oxide fibres triggered by surface offset due to GBS in air (a) SEM
observation on the oxide layer at 545 °C and (b) The schematic representation of surface
damage features at 545 °C. ... 151
Figure 5.8 Crack formed on the oxide layer in argon at 350oC with no fibre formation (a)
SEM observation on the oxide layer at 350 °C and (b) The schematic representation of
surface damage features at 350 °C. ... 152
Figure 5.9 Surface offset due to GBS, however, no oxide fibre formation in argon (a)
SEM observation on the oxide layer at 545 °C and (b) The schematic representation of
surface damage features at 545 °C. ... 153
Figure 5.10 Secondary electron images of sliding track induced on unpolished AA6061
alloy at 545oC 0.04s-1 (a) in air, (b) in argon ... 154
Figure 5.11 EDS maps of the elements, Al, Mg, O, found on the sliding track on
as-received AA6061 alloy after testing against P20 steel pin in air and argon atmosphere.
The images on the column (a) are the SE images of the sliding track, column (b) (c) (d)
xix Figure 5.12 Comparison of 3-D profilometery images of material adhered to counterface
P20 Pin while sliding against AA6061 strips in air with and without tribolayer. ... 156
Figure 5.13 Secondary electron images of sliding track induced on polished AA6061
alloy at 545oC 0.04s-1 (a) in air, (b) in argon ... 157
Figure 5.14 EDS maps of the elements, Al, Mg, O, found on the sliding track on polished
AA6061 alloy after testing against P20 steel pin in air and argon atmosphere. The images
on the column (a) are the SE images of the sliding track, column (b) (c) (d) are element
maps of Al, Mg, O. ... 158
1
1.
CHAPTER 1 INTRODUCTION
1.1 Background
One of the most important challenges for the automotive industry is to reduce the
fuel consumption along with safety improvements. These challenges can be realized by
reducing the weight of body–in-white components by using lightweight materials [1].
These lightweight materials have to be processed to complex shapes, consequently, the
quality of the final formed product should be high while maintaining high production rates
during the forming of the alloys.
The processing of alloys, which is performed to change the shape of the workpieces,
involves bulk plastic forming processes. These processes are classified into primary
mechanical working processes and secondary mechanical working processes [2, 3]. The
former are designed to induce significant deformation and shape changes in order to reduce
an ingot to a standard shape, while the latter are performed on metal sheet products shaped
by the previous stage to form a final finished shape, namely by sheet metal working
processes. They include cold forming processes and hot forming processes [4]. As an
important part of sheet metal hot forming process, quick plastic forming (QPF) and
superplastic forming (SPF) take advantage of the metallurgical phenomenon of
superplasticity to form complex and high contoured sheet metal parts [5]. During these
processes the clamped sheet material is heated to a certain temperature and argon gas is
applied to the back of the sheet to force a heated aluminum sheet into a certain shape by
the die. Some aluminum alloys, such as aluminum-magnesium alloys have been widely
2 corrosion and suitable weldability. An attractive property of these Al-Mg alloys such as
AA5083 is that they exhibit high ductility at elevated temperatures; and show a superplastic
behaviour under low strain rate of about 10-3s-1, where elongations in the 200-400% range
can be achieved [6]. These are referred to as superplastic alloys; they possess a fine, stable
grain size microstructure. Gholinia [7] studied the production of ultra-fine grain
microstructures in Al-Mg alloys by conventional rolling process, and found that small
second-phase particles in Al-Mg-Sc-Zr alloy stabilize the fine grain structure allowing it to
be formed at high temperatures. Furthermore, good superplastic properties of the
Al-Mg-Sc-Zr have been confirmed by others [8].
Hot-forming is a shaping operation that is performed at temperatures above 0.4TM
(where TM is homologous temperature) of a given metal and which allows near-net forming
of contoured parts [9]. It is a fast and cost effective deformation processing technique for
producing lightweight structural components made of aluminum and magnesium alloys [6].
Superplastic forming (SPF) and quick plastic forming (QPF) are variants of hot forming
techniques [5] and they take advantage of the superplastic properties of alloys, relying on
the hot gas blowing forming process to form a heated blank into a single-sided tool with
the use of pressurized air [10, 11].
SPF and QPF are quite similar; they both have a high strain rate sensitivity and
occur under high forming temperatures in excess of 400oC. In SPF, the materials exhibit
exceptionally high tensile ductility, commonly in the range of 400 – 2000%, which provides
significant design freedom. For aluminum alloys such as AA5083, SPF operates at
temperature and strain rate ranges of 460 – 545 °C and 10-4 – 10-3 s-1 [12], respectively.
3 SPF is performed under slow forming rates to obtain uniform final thickness distribution
and occurs at temperatures ranging between 450oC – 500oC at strain rates of 10-4s-1. The
main deformation mechanism is due to grain boundary sliding. While, QPF occurs at lower
temperatures and higher strain rates [5].
The success of hot forming i.e., good production rate with high workpiece quality
and decreasing in maintenance cost of the tool/die surfaces lies in understanding the
tribological issues occurring during the process and solving them effectively. High friction
between the die and the workpiece has been observed at elevated temperatures. High
friction behaviour occurring during the hot forming process is undesirable. This is
accompanied by material transfer between the aluminum workpiece and the tool surface.
All of these issues lead to a decrease in the quality of the final product and increase
maintenance costs of the tool/die surfaces as they have to be cleaned by removing the
adhered material mechanically [11]. Repeated action of the same die coming in contact
with different sample blanks leads to accumulation of the transferred material on the die
surface, especially in hot forming process of aluminum alloys. This is because the operating
temperature for both SPF and QPF is higher than 400oC where the aluminum alloys are
relatively soft [13]. Adhered material transferred from the blank to the die would result in
surface imperfections that reduce the surface quality.
The chemical composition and the mechanical behaviour of the surface layer on the
forming material and the contacting tool determine the tribological behaviour. Furthermore,
the composition of surface layers also affect the adhesive force between the workpiece and
tool. The variation of the composition of the surface layers can be achieved by changing
4 adhesive metallic junction and the fundamental theories of junction formation were first
developed by McFarlane and Tabor [14]. They also examined the role of combined stresses
on the contact surface. McFarlane and Tabor [14, 15] studied the relation between friction
and adhesion and established a relation between the adhesion of solid material and the effect
of surface films. They found that the metallic junctions formed between the metal surfaces
in contact are responsible both for friction and adhesion, furthermore, if the surfaces are
covered with an oxide films with an appreciable thickness, the metallic interaction is
reduced which result in a reduction in the adhesion. A magnesium-rich oxide surface film
has been observed to form when Al-Mg alloys are heat-treated in a temperature range of
200-600oC [16]. It was summarized that the growth of the magnesium oxide layer via the
diffusion of Mg in MgO-spinel and the transport of Mg vapor across voids formed between
the alloy substrate and the oxide layer [16]. Since the temperature of the Al–Mg sheet
reaches above 400oC during the hot-forming process, the effect of magnesium oxide on the
adhesion of Al–Mg sheets to the die surfaces is a significant tribological issue to address.
Thus, it is necessary to study the tribological behaviour of aluminum alloys during hot
forming and to understand the mechanisms of adhesion in different atmospheres.
1.2 Thesis objective
The general overview presented in Section 1.1 indicates that there are some
important issues which affect the tribological behaviour during hot-forming. There has
been limited tribological work done in the area of high temperature forming for aluminum
sheet products to date. AA6061 (Al-Mg-Si) which is an alternative to hot formable alloy,
it is a model material with tribolayer, lager grain size than AA5083 alloy, and exhibits GBS
5 elevated temperatures which includes the effect of deformation mechanism on friction
behaviour, and the role of the atmosphere and deformation mechanisms play in developing
the surface morphology during high temperature deformation. Thus, the present work was
carried out with the following objectives:
(1) Study the tribological behaviour of aluminum alloy (AA6061) under dynamic
conditions generated by the simultaneous effect of temperature and strain rate.
(2) Investigate the deformation mechanisms that influence the metal surface conditions
and the coefficient of friction (COF).
(3) Investigate the role of the atmosphere (air and Argon) on the formation of surface
oxides that control the friction and material transfer
(4) Examine the microstructural basis of the tribological behavior of AA6061 at
elevated temperatures.
1.3 Organization of the thesis
This thesis is arranged into six different chapters, each of which is briefly described
below.
Chapter 1 introduces the thesis, giving background information into the research
and the research objectives. It focuses on aluminum-magnesium alloys, its uses in today’s
market as well as some processing methods.
Chapter 2 provides a literature survey relating to the thesis. It describes the
hot-forming process, deformation mechanisms responsible for superplasticity observed in
aluminum alloys, the oxide layer on the surface of Al-Mg alloy, tribology of aluminum and
6 Chapter 3 presents the experimental procedures undertaken. This includes the
experimental setup devised for this research, the conditions under which they were carried
out, the parameters that were monitored, and the materials that were used. It is divided into
two parts, the first handling the simulations for hot forming, and the second, the junction
strength measurement. It describes the simulators designed for the purpose of the research
as well as the analytical tools used to examine the specimen surfaces.
Chapter 4 presents the experimental results including the coefficient of friction
(COF) of AA6061 alloy in air and argon gas and establishes a relation between COF and
deformation mechanism map (DMM). And also describes the surface oxide characteristics,
quantification of surface damage.
Chapter 5 discusses the results obtained, establishes a relation between COF and
deformation mechanisms of AA6061 alloy, and the surface damage caused by the
deformation at high temperature in different atmospheres are also discussed. Furthermore,
an interpretation of the higher COF value obtained in argon which compare with that
obtained in air is given as well as a discussion on adhesive metallic junction strength of the
interface generated at the first contact between the working material and counterface.
Chapter 6 is a summary of the entire thesis, and presents a summary of the results
7
2.
CHAPTER 2 LITERATURE REVIEW
2.1 Background of forming process
2.1.1 The forming process
Hot-forming is accomplished by clamping a sheet material into a die and
subsequently applying gas pressure to form the sheet into the die at a specified temperature.
The temperature and the gas pressure used to form Al-Mg sheets are in range of 450oC to
500oC and 0.45MPa to 3.1MPa [12] respectively. A schematic illustrating the process
inside the hot press is show in Figure 2.1. The sheet is heated to between 450oC and 500oC
for hot-forming against the forming die. The sheet is held against the tool, and the gas
pressure is applied to the back of the sheet using argon gas in order to force a heated
aluminum blank to stretch into a certain shape by the die.
The hot-forming operation can be improved by controlling and improving the
tribological conditions between the aluminum blanks and the forming die [12]. The
tribological problems that occur during these processes include metallic particle transfer to
the tool, which leads to adhesion and surface damage to both the die and the work piece
[17]. The most commonly used lubricants in hot – forming processes are boron nitride (BN)
and graphite [18]. Although graphite offers good lubricity at low cost, it decreases the
efficiency of the subsequent sheet welding process, and it must be removed from the surface
after forming. The use of coatings, including thermal spray coatings based on Cr
compounds, electroless nickel-based coatings, and PVD and plasma assisted CVD coating
based TiAlN have also been considered [19] to contribute toward reducing die – sticking.
Although low friction at temperatures above 400oC has been observed, these coatings
8
2.1.2 Superplastic forming (SPF) and quick plastic forming (QPF)
Superplasticity is the ability of a material to undergo very large uniform
tensile/compressive deformation prior to failure, at a temperature well below its melting
point [20]. Superplastic behaviour occurs at T ˃ 0.5TM . SPF is one of the hot-forming
techniques where the exceptionally high ductility of the working material allows for great
freedom of design. The aerospace industry uses SPF of parts because there has always been
a need to use high strength-to-weight materials such as aluminum and titanium [21]. SPF
alloys have a high strain rate sensitivity and occurs under high forming temperature in
excess of 400oC and it uses slow forming rates under which maximum strain sensitivity
occurs to obtain a uniform final thickness distribution. Compared with SPF, QPF takes
place at higher strain rates (˃10-3s-1), and QPF of aluminium sheet has enabled the
production of complex body closure panels that could not be manufactured by conventional
stamping, and at higher production rates than would be possible with SPF [5].
2.1.3 Friction in hot forming
During hot forming, friction occurs due to the sliding of the workpiece against the
die. It influences the material flow as well as the stress and strain distribution that occur in
the workpiece. Friction behaviour is quite complex, comprising interacting variables that
change constantly during the forming processes. These variables include deformation
magnitude, forming speed, sheet and tool material, surface roughness, and tool geometry,
the most significant of these being contact pressure and sliding velocity [22]. Friction
increase is observed with increasing temperature and strain rate, factors on which the SPF
(500oC/10-4s-1) and QPF (450oC/10-3s-1) operations are quite dependent. The evolution or
development of the microstructure of the workpiece during forming is dependent on the
9 workpiece. Friction also influences the state of stress at the interface between the tool and
the workpiece [23]. Friction is related to adhesion which is another mechanism detrimental
to hot forming. It has been stated in the literature to be controlled by adhesive forces and
deformation forces [24].
The friction behaviour of Al-Mg alloy AA5083 at warm forming temperatures has
been studied by Gali, et al.[25]. COF varies with temperature has been observed see Figure
2.2. At the constant strain rate of 0.04s-1, the mean COF values are observed to increase
with temperature. The highest COF was observed at 450oC (1.45 ± 0.18) while the lowest
is seen at 250oC (0.49 ± 0.32). They also studied the surface morphologies of AA5083
developed during the deformation see Figure 2.3, at high temperatures, the formation of
the surface offsets was due to the deformation by GBS which lead to the high COF, while
at low temperatures of 25oC to 250oC, no surface offsets were observed, and surface
roughening was due to the surface oxide fracture as shown in Figure 2.3.
Das, et al. [26] studied the friction behaviour of AA5083 at hot forming
temperatures (420oC to 545oC). It revealed the average COF value increased with the
increasing in temperature and strain rate see Figure 2.4. The lowest COF value occurred at
low strain rate and low temperature (0.95), however, the highest COF value was observed
at high temperature and high strain rate (2.09).
2.1.4 Adhesion in hot forming
Earlier work by previous researchers has shown that there is marked interaction
between metal surfaces when sliding occurs. Examination of the surface damage provides
10 of intimate contact. If the surfaces are freed of oxide or other contaminant films the friction
reaches very high values.
McFarlane, and Tabor [27] stated that with soft metals, large adhesions may be
observed during the intimate contact. They proposed an experiment set up on friction of
steel sliding on indium in air at room temperature. The results show that there is a direct
relation between the friction and the adhesion which may be expressed quantitatively in
terms of the plastic properties of indium. When the two solids are placed in contact plastic
flow occurs at the points of real contact until the area is sufficient to support the applied
load. At these regions metallic junctions are formed as a result of a process of cold welding.
These junctions are largely responsible for the adhesion and for the friction. If lubricants
are applied to the surface the behaviour may be profoundly affected. For example, at load
of 14.5g, the COF for clean surface is μ=5 whilst in the presence of paraffin oil it is of the
order of μ=0.9 and the normal adhesion is negligible small. The main effect of the lubricant
film is to hinder the growth of the metallic junctions so that the maximum value of the
friction is much lower. McFarlane, and Tabor [27] found that the oxide film on the surface
as a solid lubricant could lower the coefficient of friction in their proposed experiment.
McFarlane, and Tabor [27] did a further investigation on the effect of oxide film on
the soft metal surface. Adhesion experiments were carried out on surfaces of indium, lead
and tin which had been exposed to air in a desiccator for periods up to 30 days. With indium
there was a steady decrease in adhesion with time of exposure. The results illustrated that
no visible change occurred in the appearance of the indium surface even after 30 days.
While with lead and tin where the oxide formed more rapidly and is considerably thicker
11 may produce a marked reduction in adhesion. This is presumably because they reduced the
amount of metallic contact between the surfaces. According to the statement from
McFarlane, and Tabor [14], metallic adhesion depended primarily on the nature of the
surfaces or the surface film. Gwathmey, et al.[28] have shown that copper surfaces will
adhere strongly if the oxide films have been removed by reduction in a stream of hydrogen
at elevated temperatures. This is because the absence of the oxide film tends to increase the
amount of metallic contact between the surfaces. Similarly, Holm and Kirschstein [29]
found that metals outgassed in vacuum gave high frictions and often adhered together.
At elevated temperatures, adhesion, the material transfer of the softer workpiece
material to the tool, which causes critical issues during hot forming operations. If the
transferred material is welded to the tool/die surface, it leads to the accumulation of material
on the tool surface, resulting in a decrease in surface quality of the finished products [30].
This surface damage that occurs during sliding contact due to material adhesion is often
referred to as galling, scuffing, and scoring [24].
Adhesion and material transfer tend to be dependent on such factors as temperature,
tool roughness and surface composition, contact pressure, and sliding velocity [24]. High
friction is often associated with adhesion, it has been recorded as increasing the rate of
material transfer, and an increase in friction is used as an indicator of galling [3].
Aluminium adhesion on the die surface is a crucial problem for any elevated temperature
forming process. Gali, et al.[25] studied the effect of the temperature on material transfer
to pin surfaces. AA5083 alloy covered with oxide layer was used in their tests, and the
amount of material transfer increased with increasing temperature, see Figure 2.5. At
12 the operating temperature increased above 300oC, considerable amounts of transfer
occurred, and the transferred material at high temperature covered a large area on the
contact surface of the pin. Gali, et al. [31] also studied the effect of surface conditions on
the elevated temperature sliding contact deformation of AA5083 alloy, and polished and
tribolayer covered sample were considered in their tests. The transferred material was
distributed discontinuously over an area of the pin when it slid against the tribolayer
covered sample see Figure 2.6; material transfer was adhered however in a localised area,
comprising of a circular head and a tail having a semi elliptical appearance when it slid
against the polished sample see Figure 2.7.
Friction and adhesion behaviours during the hot forming processes were reviewed
in Section 2.1.3 and Section 2.1.4, and these behaviours are attributed to the surface
damage during the hot forming process. However, simultaneously, the bulk material below
the surface is subjected to plastic deformation. The next Section will present a review on
deformation mechanisms during superplastic forming.
2.2 Deformation mechanisms for superplastic forming
2.2.1 General creep equation
The Arrhenius equation is most widely used to describe the relationship between
the strain-rate, flow stress and temperature, especially at high temperatures. Deformation
behaviour of the material during SPF/QPF can be described by the power law function
[32]:
𝜀̇ =A (
ϭ𝐸
)
nexp (−
𝑄13 Where A is material constant, ϭ is the flow stress, n is the stress exponent, E is the
temperature compensated Young’s modulus, Q is activation energy for deformation, and R
is the universal gas constant.
The stress exponent, n, can be obtained from the slope of a ln
𝜀̇
vs. lnσ plot. In manycases deformation behaviour of the material is also described by the inverse of stress
exponent, 1/n (strain rate sensitivity, m). For example, n = 2 implies deformation by GBS [4].
Das, et al. [26] studied the plastic deformation behaviour of Al-Mg alloy (AA5083)
at elevated temperatures and established a deformation mechanism map see Figure 2.8.
Diffusional flow, GBS, and solute drag mechanisms were identified based on the stress
exponent value within the temperature and strain rate ranges studied. It revealed how the
temperature and strain rate affect the deformation mechanism during SPF/QPF process.
2.2.2 Diffusional flow
Diffusional creep may occur at low strain rate (<1.5x10⁻²s-1) for Al-Mg alloy
through the grain boundaries [26]. Two mechanisms are accompanied by the diffusion flow:
Coble creep (favoured at lower temperatures) through the grain themselves, and
Nabarro-Herring creep (favoured at higher temperatures). For Nabarro-Nabarro-Herring creep, diffusion of
vacancies through the grains from one grain boundary to another. Excess vacancies are
created at grain boundaries perpendicular to the tensile axis with a uniaxial tensile stress.
The constitutive equation under the diffusion of vacancies through the grain boundaries can
be described as:
𝜀̇
= k
1(
𝐷𝑔𝑏 𝑑3
) (
𝐸𝑏3 𝑘𝑇
) (
𝜎
𝐸
) (
grain boundary diffusion[33])
(2)Where Dgbis the grain boundary diffusion coefficient, b is the Burgers vector, d is the grain
14 These excess vacancies diffuse from the grain boundaries lying normal to the tensile
direction towards those parallel to it, as illustrated in Figure.2.9. Grain boundaries act as
perfect sources and sinks for vacancies. The constitutive equation for diffusional flow with
a predominant diffusion through the grain interior:
𝜀̇
= k
2(
𝐷𝐿 𝑑2
) (
𝐸𝑏3 𝑘𝑇
) (
𝜎
𝐸
)
(lattice diffusion [33]) (3)Where DL is lattice diffusion coefficient, k is Boltzmann’s constant, and k2 is material
constant.
2.2.3 Grain boundary sliding (GBS)
GBS involves the relative translation of two grains by a shear movement parallel to
their common boundary. In many well documented studies of superplasticity in
fine-grained materials, it has been observed that even after large elongations, there is no
appreciable change in grain shape, and the grains remain equiaxed [34]. With the
application of tensile stress, diffusion occurs along the grain boundaries as grain boundary
interfaces slide past each other. Thus, there is a strong dependence on the grain size. Also,
the entire grain rotates during this process. This typically results in the grains remaining
equiaxed and random in texture [34].
2.2.3.1 GBS mechanisms
There are two types of GBS mechanisms reported in the literature: Rachinger
sliding [33] and Lifshitz sliding [35]. Rachinger sliding is a mechanism where grains retain
their original shape even after large elongations, as shown schematically in Figure 2.10a.
Rachinger sliding occurs by the movement of extrinsic dislocations along grain boundaries,
and the climbing of accumulated dislocation within a grain controls the rate of sliding [33].
In Rachinger sliding, the shape change of the specimen occurred by neighbour-switching
15 Lifshitz sliding is considered to be due to stress-directed flow of vacancies either through
the grain interiors (Nabarro-Herring creep) [36] or along the grain boundaries (Coble creep)
[37]. A schematic illustration of Lifshitz sliding is shown in Figure 2.10b. In Figure 2.10b,
grains become elongated in the tensile direction due to the directional flow of vacancies
from grain boundaries experiencing tensile stresses to those which have compressive
stresses.
During superplastic deformation, large strains are achieved with grains retaining
their equiaxed shape, which is similar to Rachinger sliding. Therefore, it is considered that
Rachinger sliding is involved in superplastic deformation [33].
Some microscopical models were proposed to explain the superplastic deformation
behaviour. These models can be classified into two groups: GBS accommodated by
diffusional flow and GBS accommodated by slip.
2.2.3.2 GBS accommodated by diffusional flow
Ashby and Verrall [36] proposed a 2-D model based on GBS with diffusional
accommodation, and this can be explained by a grain-switching event for a four-grain unit
without obvious deformation of grains (Figure 2.11). The schematic illustrates the grain
switching mechanism, during the intermediate stages grains change their original shape by
diffusional flow occurring by mass transfer through grain boundaries. The inter-grain
distance perpendicular to the tensile direction contracts and the grain boundaries come
closer and engage the grains in the lateral direction, while along the tensile direction the
grains move apart.
Based on the analysis on many superplastic materials, Luthy et al. [37] confirmed
16 experimental data, and led to a constitutive equation for GBS accommodated either by
lattice diffusion or grain boundary diffusion as in Equations (4) and (5) respectively.
𝜀̇ = k
3(
𝐷𝑔𝑏 𝑑3
) (
𝜎 𝐸
)
2
(boundary diffusion controlled [38])
(4)
𝜀̇ = k
4(
𝐷𝐿 𝑑2
) (
𝜎 𝐸
)
2 (lattice diffusion controlled [38]) (5)
Where Dgbis grain boundary diffusion coefficient, DL is lattice diffusion coefficient, b is
the Burgers vector, d is the grain size, ϭ is the flow stress, E is Young’s modulus, k is Boltzmann’s constant, and k3, k4are material constants. In Equations (4) and (5), the stress
dependence of the power law is given by n = 2 (also implies strain rate sensitivity m = 0.5),
which corresponds to the GBS mechanism.
2.2.3.3 GBS accommodated by Slip
GBS can occur also by dislocation slip, which occurs due to dislocation pileups
within the grain and also due to pileups in the grain boundary. The model of dislocation
pileups in the grain interior was first proposed by Ball and Hutchinson [39] see Figure 2.12.
based on the sliding of a group of grains. In this mode, grains whose boundaries are suitably
aligned will slide as groups during deformation. The shear stress on the group becomes
concentrated on any grain or protrusion that obstructs the motion of the group. Local
stresses would generate dislocations in the blocking grain and dislocations would pileup at
the opposite grain boundary until their back stress prevents further generation of
dislocations and thus further sliding by the group.
By assuming climb is slower than glide, this model suggests climb of dislocation as
the rate controlling process. Based on this, the model predicts a stress exponent of n=2
17
2.2.4 Viscous glide controlled creep
Creep of solid solution alloys at intermediate stresses and under certain
combinations of materials parameters can often be described by three regions [33].This is
illustrated in Figure. 2.13. With increasing stress, the stress exponent, n, changes in value
from 5 to 3 and again to 5 in regions I, II, and III, respectively. The mechanism of
deformation in region II is viscous-glide of dislocations and it has been observed in Al-2.2
at% Mg alloy [33]. This is due to the fact that the dislocations interact in several possible
ways with the solute atoms, and their movement is impeded. Distribution of the solute
atoms (interstitial or substitutional) around a moving dislocation would cause a perturbation
force that acts on the dislocation opposite to the applied stress. Due to this opposing force
the motion of dislocations slows down. This force can be regarded as viscous drag, which
allows a steady state motion under a steady state stress, and the mechanism known as
viscous glide creep mechanism. There are two competing mechanisms over this stress range,
dislocation climb and viscous glide, and viscous glide is slower and thus rate controlling.
The constitutive equation that describes viscous glide creep mechanism is given in the form
of Equation (6).
𝜀̇
= k
5(
𝐷𝑠 𝑑2
) (
𝜎 𝐸
)
3
(6)
Where Dsis solute atom diffusion coefficient, b is the Burgers vector, d is the grain size, ϭ
is the flow stress, E is Young’s modulus, k is Boltzmann’s constant, and k5is a material
constant.
There are several possible processes in region II, where n = 3 [33]. Fisher [40]
18 the order. The generation of dislocation pileups of high density gives the possibility of
pushing leading dislocations through the regions of short-range ordering. Therefore, in the
course of their cooperated movement, the pileups of dislocations destroy the short-range
ordering. Cottrell and Jaswon [41] proposed that the dragging process is the segregation of
solute atmospheres to moving dislocations. The dislocation speed is limited by the rate of
migration of the solute atoms.
2.2.5 High temperature deformation mechanisms in Al an Al-Mg alloys
Higher temperature deformation mechanisms of an aluminum alloy depend on the
solute content and grain size of the alloy. To represent various deformation mechanisms
that operate in pure aluminum, a deformation mechanism map (DMM) see Figure 2.14
was constructed on stress vs. temperature axes by Frost and Ashby [42]. The zones of
different mechanisms were identified, based on the stress exponent (n) value. Figure 2.14
presents the DMM generated by frost and Ashby for pure aluminum of grain size of 10μm.
The range of strain rate and temperature over which the hot forming operation takes place
is narrow. Another DMM was constructed by Kim et al. [43] for aluminum alloy at a
temperature of 800K (527oC) is shown on grain size vs. stress axes in Figure 2.15. Different
deformation mechanisms under the circumstances where the initial grain size varies largely
were identified by this map. The earlier version of the DMM constructed by Frost and
Ashby [42] did not show the region of GBS. However, the DMM constructed by Kim et al.
[43]shows the region of GBS as lying between the regions of diffusional flow and
power-law creep.
There are two main creep mechanisms responsible for the diffusional flow. One is
19 ˃ 0.8Tm) and very low stresses (σ/E < 5 × 10⁻⁷) as a result of vacancy diffusion and causes
strain accumulation by strain elongation. This mechanism is characterized by lattice
diffusion that occurs at the grain interiors [35, 44](see Figure 2.9). Another one is Coble
creep, which is normally observed at T < 0.8Tm[42], and the grain boundaries are the
preferential diffusion paths (grain boundary diffusion). In both cases, the steady-state strain
(creep) rate increases linearly with the applied stress, producing a stress exponent, n = 1.
GBS is generally characterized by an activation energy that is equal to the activation
energy for either grain boundary diffusion or lattice self-diffusion and a stress exponent of
n = 2. GBS is favoured in alloys with equiaxed grains < 10 μm and the presence of second
phase particles that inhibit grain growth.
Requena, et al. [45] studied the creep behaviour of AA6061 alloy at 573K. They
found that a stress exponent of n ≈ 1 for stresses from 15 to 25 MPa indicates the dominating
diffusional creep mechanism. A stress exponent of n ≈ 3 is found from 25 to 50 MPa
concluding dominating dislocation creep as shown in Figure 2.16. Khamei, et al. [46]
performed the hot tensile tests to study the strain rate sensitivity m (m = 1/n) of AA6061 at
the temperature range of 300oC to 500oC. The value of strain rate sensitivity (m) was
observed equal with 0.3 (n = 3) when the dominant mechanism is dislocation creep.
2.3 The disturbed layer
The surface of aluminum alloy sheets contains a tribolayer know as disturbed layer
that forms during prior thermo-mechanical treatment particularly during hot rolling of the
sheet. The disturbed layer was first observed by Leth-Oslsen et al [47] while researching
20 plated surface of especially aluminum alloys. They believed that the sensitivity of
aluminum alloys to corrosion is related to the disturbed layer. Its formation has been
attributed to the much higher strains experienced by the surface of the alloy as compared
with that of the bulk, resulting in the difference in microstructural characteristics between
them [48]. The high strains observed are due to the high shear deformation that the surface
bears such as sliding [49]. These layers are characterized by rolled-in oxide patches and a
distribution of ultra-fine aluminum grains mixed with the comminuted fragments of
fractured second phase particles [50, 51]. The schematic representation in Figure.2.17
shows the subsurface layer containing the microcrystalline oxide mixed with small-grained
metal [50].
2.3.1 The formation of the disturbed layer
The formation of these layers is dependent on the tribological conditions at tool and
metal surface during rolling. The disturbed layer is formed due to the high shear
experienced by contact of the tool and the metal piece under lubricated conditions [50].
During metal working, the surface and subsurface region of metal are subjected to
different conditions from the bulk of the metal. Metal transfer is induced by the interactions
between the workpiece and the tool, variety of mechanisms can take place, and the
oxidation is accompanied by this stage. The oxidized transferred material can be
retransferred back to the work piece surface and a distinct surface appearance can be
observed [50]. Frolish et al. [52], from their simulation of industrial rolling proposed that
the mechanism causing the disturbed layer and the mixing in of the oxide particles was
from slip occurring at the interface of the roll and workpiece and the action of the roll
21 The surface/near-surface region of aluminum sheet is subjected to enhanced shear
strains during rolling, resulting in the formation of near-surface deformed layers with
different microstructures to the underlying bulk alloy [53]. Scamans [54] later suggested
the severe surface shear experienced during hot rolling as the reason the surface of the alloy
was ploughed and re-welded back together. This, he noted, caused the integration of the
oxide and explained the sharp transition observed from the disturbed surface to the
bulk-grained microstructure beneath it.
2.3.2 The ultra-fine grain of the sub-surface
Frolish et al.[47] noted that the diffusion of magnesium to the surface of the alloy,
which was observed to occur rapidly and increase in intensity with time, was in part
responsible for the formation of the subsurface layers as its oxides were observed to provide
the Zener pinning of the grain boundaries thus producing the fine grain features. They
suggested that the depth of the magnesium content correlated with the thickness of the
subsurface layer, although noting that the subsurface layer structure depended on the alloy
composition and the processing conditions [47].
Xia, [55] in his experiments observed precipitates also involved in the Zener
pinning of grains which prevented subgrain growth during the hot rolling of aluminum
alloys. Premendra et al. [56], also observed broken intermetallics on the surface of the metal
at grain boundaries, which he suggested were involved in pinning grains.
2.3.3 Surface oxidation behaviour of Al-Mg alloy
When Al-Mg alloys are heat-treated during their production and fabrication,
magnesium is lost from the bulk of the material. If heated in vacuum, the surface active
![Figure 2.3 Secondary electron images of AA5083 aluminium alloy strip surface after deformation under a strain rate of 4×10⁻² s−1 at (a) 25 °C, (b) 150 °C, (c) 200 °C, (d) 250 °C, (e) 300 °C, (f) 350 °C, (g) 400 °C, and (h) 450 °C [25]](https://thumb-us.123doks.com/thumbv2/123dok_us/1382836.1170955/50.612.108.542.136.526/figure-secondary-electron-images-aluminium-surface-deformation-strain.webp)
![Figure 2.4 (a) Average COF vs strain rate plot. (b) Average COF vs temperature plot [26]](https://thumb-us.123doks.com/thumbv2/123dok_us/1382836.1170955/51.612.152.496.121.664/figure-average-cof-strain-rate-plot-average-temperature.webp)
![Figure 2.5 Secondary electron images of material transferred to P20 steel pin from AA5083 aluminium at (a) 25 °C, (b) 150 °C, (c) 200 °C, (d) 250 °C, (e) 300 °C, and (f) 350 °C [25]](https://thumb-us.123doks.com/thumbv2/123dok_us/1382836.1170955/52.612.107.548.236.497/figure-secondary-electron-images-material-transferred-steel-aluminium.webp)

![Figure 2.14 Deformation mechanism map (DMM) for pure aluminum of grain size 10 μm, showing boundary and lattice diffusion controlled diffusional flow, dynamic recrystallization and power law creep [42]](https://thumb-us.123doks.com/thumbv2/123dok_us/1382836.1170955/60.612.112.526.68.482/deformation-mechanism-aluminum-boundary-diffusion-controlled-diffusional-recrystallization.webp)