ABSTRACT
KIM, NAYOUNG. Effective Connectivity Based ACT-R Modeling of Workload Transition in Multitasking. (Under the direction of Dr. Chang S. Nam).
Understanding how human operators cope with unexpected workload transitions is one of the important ergonomic issues. As the level of task demand changes, the level of effort operators exerted for the current task may influence subsequent behavior (e.g., performance, perceived mental workload, or brain activity). The impact of previous demand conditions on subsequent conditions is known as ‘workload transition effect’, or ‘hysteresis effect.’
Past research has shown inconsistent results on workload transition or Hysteresis effects at the behavioral, perceived workload, or neurophysiological level, resulting in three different hypotheses: Enhancement, Deterioration, or No change. Adaptive Control of Thought-Rational (ACT-R) is one of the cognition theories that seek to predict human performance in multitasking by utilizing a computational simulation of human cognitive processing. This study adopted ACT-R as a theoretical framework to address the challenges identified from the previous research, to better understand the underlying behavioral and neurocognitive processes that occur during workload transitions, and to predict the impacts of hysteresis effects.
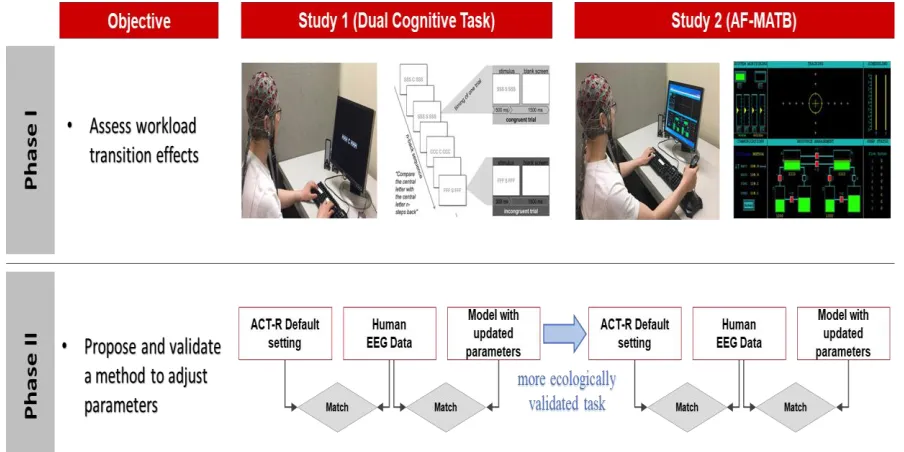
This study intended to achieve the following objectives: a) Confirm workload transition effects by comparing the transitioned group and the non-transitioned group in terms of performance, mental workload, and brain activity change over time in two different settings; and b) Propose and validate a new method to quantify and adjust ACT-R’s main parameters based on neural correlates of workload transition. This research consisted of two studies, each study with two phases.
measures in both a basic cognitive task (in Study 1) and a more ecologically valid task (AF-MATB) (in Study 2). The findings of the present study confirmed workload transition effects at the three measurement levels in both task settings.
The second research question, “What is the nature of the effects of workload transition variation types at the behavioral, perceived workload, and neurophysiological levels?” supported the “Enhancement” hypothesis. The cyclic transition type was shown to significantly affect task performance, perceived mental workload, and brain connectivity, as compared to other transition types. We investigated the effective connectivity and identified differentiating brain regions that coincide with the ACT-R module associated with memory retrieval.
Finally, answers to the third research question “What is a systematic way that can improve the fitness of the ACT-R model that simulated human performance during workload transitions?” (Phase II) outlined a parameter tuning framework using both behavioral measures and effectivity connectivity of human operators. We suggested an effective connectivity-based method, which significantly increases the amount of information that can be extracted from EEG data to distinguish workload profiles. By understanding neural correlates and ACT-R production rule processing, in the current study suggested a novel way to scale the significant three parameters of ACT-R; retrieval threshold, latency-scaling factor, and activation noise. Through Studies 1 and 2, we validated that the ACT-R model with the revised parameters resulted in better model fitness than the model with default parameters.
Effective Connectivity Based ACT-R Modeling of Workload Transition in Multitasking
by Nayoung Kim
A dissertation submitted to the Graduate Faculty of North Carolina State University
in partial fulfillment of the requirements for the degree of
Doctor of Philosophy
Industrial Engineering
Raleigh, North Carolina 2019
APPROVED BY:
_______________________________ _______________________________ Chang S. Nam Justin Post
Committee Chair
BIOGRAPHY
ACKNOWLEDGMENTS
TABLE OF CONTENTS
LIST OF TABLES ... viii
LIST OF FIGURES ... ix
LIST OF CONTRIBUTING PUBLICATIONS ... x
LIST OF ACRONYMS ... xi
1. Introduction ... 1
1.1. What is the workload transition effect or hysteresis effect? ...1
1.2. Research challenges ...4
1.2.1. Mixed findings on workload transition effects ...4
1.2.2. Needs for neurocognitive model-based modeling and simulation ...4
1.3. Objectives ...5
1.4. Organization of this dissertation ...7
2. Literature review ... 8
2.1. Workload transition in multitasking ...8
2.1.1. Changes in workload transition affect task performance ...8
2.1.2. Variability of task demand and mental workload ... 14
2.1.3. Workload transition effects on neurophysiological responses... 18
2.1.4. Individual differences and workload transition ... 20
2.1.5. Limitations of current studies on workload transition in multitasking ... 21
2.2. Adaptive Control of Thought-Rational (ACT-R): A cognitive architecture ... 22
2.2.1. Overview of ACT-R ... 23
2.2.2. Cognitive modeling of multitasking using ACT-R ... 26
2.2.3. ACT-R modeling approaches ... 28
2.2.3.1. Behavioral data-based modeling ... 30
2.2.3.2. Neurological data-based ACT-R modeling ... 32
2.2.3.3. How to tune ACT-R model parameters... 34
2.2.4. Limitations of current studies on ACT-R modeling of multitasking ... 35
2.3. Application of brain connectivity for ACT-R modeling ... 36
2.3.1. Analyzing effective connectivity with Granger causality ... 37
2.3.2. Measures of brain network ... 41
3. STUDY 1: ACT-R modeling of workload transition in dual cognitive tasks ... 48
3.1. Phase I: Workload transition affecting human performance and cognition ... 49
3.1.1. Objectives and hypotheses ... 49
3.1.2. Methods ... 53
3.1.2.1. Participants ... 53
3.1.2.2. Apparatus and materials ... 54
3.1.2.3. Experimental task... 55
3.1.2.4. EEG signal acquisition and processing ... 57
3.1.2.5. Effectivity connectivity analysis ... 58
3.1.2.6. Experimental design and independent variables... 61
3.1.2.7. Dependent variables ... 62
3.1.2.8. Procedure ... 63
3.1.2.9. Statistical analyses ... 65
3.1.3. Results and discussions ... 67
3.1.3.1. Behavioral measures ... 67
3.1.3.2. Mental workload ... 72
3.1.3.3. Neurophysiological measures ... 73
3.2. Phase II: Development of an effective model tuning method in ACT-R ... 78
3.2.1. Objectives ... 78
3.2.2. Methods ... 79
3.2.2.1. ACT-R modeling for n-back task ... 79
3.2.2.2. Procedures ... 80
3.2.3. Results ... 86
3.2.3.1. Behavioral measures ... 86
3.2.3.2. Neurophysiological measures ... 87
3.2.3.3. Adjustment of parameters ... 88
3.3. Discussions of Study 1 ... 89
4. STUDY 2: ACT-R modeling of workload transition in AF-MATB tasks ... 91
4.1. Phase I: Workload transition effects in multitasking ... 92
4.1.1. Objectives and hypotheses ... 92
4.1.2. Methods ... 95
4.1.2.1. Participants ... 95
4.1.2.3. Experimental design and independent variables... 99
4.1.2.4. Dependent variables ... 101
4.1.2.5. Procedure ... 103
4.1.3. Results and discussions ... 104
4.1.3.1. Behavioral measures ... 104
4.1.3.2. Mental workload ... 108
4.1.3.3. Neurophysiological measures ... 109
4.2. Phase II: Evaluating the feasibility of the proposed method in multitask ... 113
4.2.1. Objectives ... 113
4.2.2. ACT-R modeling of AF-MATB tasks ... 113
4.2.3. Results ... 116
4.2.3.1. Behavioral measures ... 116
4.2.3.2. Neurophysiological measures ... 117
4.2.3.3. Adjustment of parameters ... 118
4.3. Discussions of STUDY 2 ... 121
5. General discussion ... 122
5.1. Workload transition effects ... 122
5.1.1. Task type and workload profile... 122
5.1.2. Memory retrieval and temporal cortex ... 123
5.2. Proposed method on how to adjust the ACT-R model ... 124
6. Conclusions and future research... 125
6.1. Summary of research findings ... 125
6.2. Contributions and implications of this research ... 126
6.2.1. The nature of workload transition effects ... 126
6.2.2. Effective connectivity-based ACT-R parameter tuning method ... 128
6.3. Research limitations and future work ... 129
6.3.1. Limitations of the study ... 129
6.3.2. Directions for future research ... 130
REFERENCES ... 132
Appendix A: Demographic questionnaire ... 141
Appendix B: Handedness survey ... 142
LIST OF TABLES
Table 3.1. Demographics of participants (N=60) ... 53
Table 3.2. The sequence of the n-back levels by six variation groups during sessions ... 62
Table 3.3. Comparison template for time bins between the control and transitioned groups ... 67
Table 3.4 Mean and standard deviation of RTs (sec) ... 68
Table 3.5. ANOVA results on RT ... 68
Table 3.6. Mean reaction time: Control vs. Transitioned group on RT ... 69
Table 3.7. Mean and standard deviation of accuracy ... 70
Table 3.8. Significant ANOVA results on accuracy ... 70
Table 3.9. Mean accuracy: Control vs. Transitioned group on accuracy ... 71
Table 3.10. Mean and standard deviation of ISA rating ... 72
Table 3.11. ANOVA result on ISA ... 72
Table 3.12. Coordinates of the six independent components with residual variance < 10% ... 74
Table 3.13. Effective connectivity: V1 (Cyclic profile) group vs. Non-transitioned group ... 77
Table 3.14. Selected ICs and ACT-R module matching ... 82
Table 3.15. Cognitive dual-task behavioral fit for all relevant models. (Pre-model vs. data) ... 86
Table 3.16. Fit measures of the neural data between Model and data from Phase I... 87
Table 3.17. Proposed a new set of parameters... 88
Table 3.18. Fit measures between behavioral data and updated ACT-R model... 89
Table 3.19. Fit measures between neural data and updated ACT-R model. ... 89
Table 4.1. Event rates in each level of task difficulty ... 100
Table.4.2. The sequence of the difficulty levels by six variation groups during sessions ... 101
Table 4.3. Mean and standard deviation of CRRs ... 105
Table 4.4. Results of the ANOVA on CRR... 105
Table 4.5. Mean correct response ratio: Control vs. Transitioned group on CRR ... 106
Table 4.6. Mean and standard deviation of RMSDs ... 106
Table 4.7. Results of ANOVA on RMSD ... 107
Table 4.8. Mean RMSD: Control vs. Transitioned group on RMSD ... 108
Table 4.9. Coordinates of the six independent components with residual variance < 10% ... 110
Table 4.10. Effective connectivity: Control vs. Transitioned group ... 112
Table 4.11. AF-MATB task behavioral fit with the default setting of mMATB... 116
Table 4.12. Selected ICs and ACT-R module matching ... 117
Table 4.13. Fit measures of the neural data between Model and data from Phase I... 117
Table 4.14. Proposed a new set of parameters... 119
Table 4.15. Fit measures between behavioral data and updated model ... 120
LIST OF FIGURES
Figure 1.1. Changes in pilot workload during the flight ...1
Figure 1.2. Schematic diagram of the research framework ...6
Figure 2.1. Inconsistent hysteresis effects on performance ...9
Figure 2.2. Inconsistent hysteresis effects on mental workload ... 15
Figure 2.3. Neurocognitive modeling paradigm ... 23
Figure 2.4. Overview of ACT-R modules ... 25
Figure 2.5. Effective connectivity linked to executive functions during n-back tasks ... 44
Figure 2.6. Average and standard deviation of network measures ... 46
Figure 3.1. Framework of Study 1 with two phases ... 48
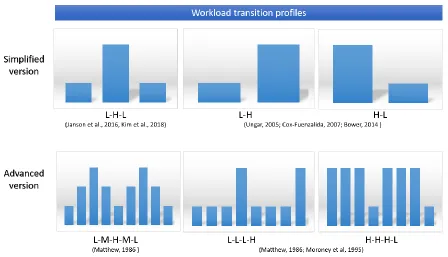
Figure 3.2. Workload transition profiles ... 49
Figure 3.3. Illustration of cognitive dual-task: ... 56
Figure 3.4. EEG electrode montage used ... 57
Figure 3.5. Validation of MVAR model using ACF, Ljung-box and Box-pierce ... 59
Figure 3.6. Flowchart of the connectivity analysis procedure ... 60
Figure 3.7. Experimental set-up in Study 1 ... 64
Figure 3.8. Schematic illustration of the procedure used in Phase 1 ... 65
Figure 3.9. Result of Tukey’s HSD test on RT... 69
Figure 3.10. Result of Tukey’s HSD test on accuracy ... 71
Figure 3.11. Result of Tukey’s HSD test on ISA ... 73
Figure 3.12. Time-Frequency grid ... 75
Figure 3.13. Timeline of n-back ACT-R model (revised from Nijboer et al., 2016) ... 80
Figure 3.14. Schematic representation of the ACT-R parameter tuning ... 81
Figure 3.15. ACT-R modules and selected ICs ... 82
Figure 4.1. Framework of Study 2 with two phases ... 91
Figure 4.2. Experimental task interface (a) mMATB (b) AF-MATB ... 96
Figure 4.3. System Monitoring task ... 97
Figure 4.4. Communication task ... 98
Figure 4.5. Tracking task ... 98
Figure 4.6. Resource management task ... 99
Figure 4.7. Experimental set-up in Study 2 ... 103
Figure 4.8. Result of Tukey’s HSD test on CRR ... 105
Figure 4.9. Result of Tukey’s HSD test on RMSD... 107
Figure 4.10. Mean unweighted composite NASA TLX scores ... 109
LIST OF CONTRIBUTING PUBLICATIONS
Peer-reviewed Journal Articles
Kim, N., House, R., Yun, M. H., and Nam, C. S. (2018). Neural Correlates of Workload Transition
in Multitasking: An ACT-R Model of Hysteresis Effect. Frontiers in Human Neuroscience, 12: 535.
Kim, N., Wittenberg, E., and Nam, C. S. (2017). Behavioral and Neural Correlates of Executive
Function: Interplay between Inhibition and Updating Processes. Frontiers in Neuroscience, 11:378.
Peer-reviewed Conference Proceedings
Sanders, N., Choo, S., Kim, N., and Nam, C. S. (2019). Neural Correlates of Trust During an Automated System Monitoring Task: Preliminary Results of An EEG Effective Connectivity Study. In Proceedings of the Human Factors and Ergonomics Society’s 63rd Annual Meeting. Sage CA: Los Angeles, CA: SAGE Publications.
Choo, S., Sanders, N., Kim, N., Kim, W., and Nam, C. S. (2019). Detecting Human Trust
Calibration in Automation: A Deep Learning Approach. In Proceedings of the Human Factors and Ergonomics Society’s 63rd Annual Meeting. Sage CA: Los Angeles, CA: SAGE Publications.
Kim, N., Kim, W., Hwan Yun, M., & Nam, C. S. (2018). Behavioral and Neural Correlates of
Hysteresis Effects during Multitasking. In Proceedings of the Human Factors and Ergonomics Society Annual Meeting. Sage CA: Los Angeles, CA: SAGE Publications.
Kim, N., McCune, E., Yun, M. W., and Nam, C. S. (2018). EEG-Based Neural Correlates of
ACT-R Model for Multitasking. The 2nd International Neuroergonomics Conference.
Kim, N., Wittenberg, E., & Nam, C. S. (2017). Working Memory Capacity, Memory Load, and
Cognitive Control Network. In Proceedings of the Human Factors and Ergonomics Society Annual Meeting (Vol. 61, No. 1, pp. 46-48). Sage CA: Los Angeles, CA: SAGE Publications. Liu, S., Wadeson, A., Kim, N., and Nam, C. S. (2016). Effects of Working Memory Capacity,
Task Switching, and Task Difficulty on Multitasking Performance. In Proceedings of the Human Factors and Ergonomics Society Annual Meeting (Vol. 60, No. 1, pp. 502-506). Sage CA: Los Angeles, CA: SAGE Publications.
Book Chapter
Kim, N., and Nam, C. S. (2020). Adaptive Control of Thought-Rational (ACT-R): Applying a
LIST OF ACRONYMS
ACC Anterior Cingulate Cortex
ACF Auto-Correlation Function
ACT-R Adaptive Control of Thought-Rational
AF_MATB Air Force_Multi Attribute Task Battery
ANOVA Analysis of Variance
BA Brodmann Area
BOLD Blood Oxygen Level Dependent
CLARION Connectionist Learning with Adaptive Rule Induction On-line
dDTF direct Directed Transfer Function
DLPFC Dorsolateral Prefrontal Cortex
DTF Directed Transfer Function
DWI Diffusion Weighted Imaging
EEG Electroencephalogram
EF Executive Function
EOG Electrooculographic
ERP Event-Related Potential
FA False Alarm
fMRI Functional Magnetic Resonance Imaging
FR Frustration
GCA Granger Causality Analysis
HSD Honestly Significant Difference
ICA Independent Component Analysis
LMP Li-McLeod Portmanteau
MD Mental demand
MEG Magnetoencephalography
MNI Montreal Neurosciences Institute
MVAR Multivariate Autoregressive
NASA-TLX NASA Task Load Index
PRP Psychological Refractory Period
RACE/A Retrieval by Accumulating Evidence in an Architecture
RMSE Root-Mean-Square Error
ROI Regions of Interest
RSME Rating Scale Mental Effort
RT Reaction Time
SIFT Source Information Flow Toolbox
SOAR State, Operator, And Result
SWAT Subjective Workload Assessment Technique
VAR Vector Auto Regression
1. Introduction
1.1. What is the workload transition effect or hysteresis effect?
Workload transitions are common in many situations where operators have been working at a level(s) of task demand for a while and are then confronted with a substantially different level(s) of task demand while performing multiple tasks at the same time. One example is piloting an aircraft (See Figure 1.1). While flying, a pilot needs to look out for obstructions, weather, and runway conditions while monitoring various metrics, such as airspeed, altitude, fuel levels, and navigation information. At the same time, pilots must pay attention to auditory cues from air traffic controllers as well as potential warning alarms such as ground proximity warnings. Pilots are also often tasked with manually controlling acceleration and guiding the plane using steering mechanisms. Although modern airplanes are equipped with sophisticated automation systems, pilots are still required to perform multiple tasks simultaneously.
Figure 1.1. Changes in pilot workload during the flight (adapted from Human Factors for Aviation: Basic Handbook, 2008)
Gray et al., 2005; Moon & Anderson, 2013), and develop computational models which help simulate human performance and cognitive activity (Maanen & Rijn, 2012).
Traditionally different levels of cognitive load were compared as if they are temporally independent. Specifically, it is assumed that counter-balancing or randomizing task demand levels remove any effects that one level might have on another. However, cases where workload levels are not temporally related rarely occur during real multitasking. In the aforementioned aircraft pilot example, demand transitions may occur at multiple points during a flight depending on travel conditions, even the weather regularly change, creating a temporally dependent cognitive load environment. It follows that measurement of the effects of the temporally dependent and dynamic workload is needed to improve performance prediction. Workload transition referred to as cognitive load has transitioned from one load at a specific time to a new load at a new time.
Increasing attention has been given to researching the impact of shifts in task demand on human performance and cognitive activity. An impact of previous demand conditions on current demand conditions, or hysteresis effects (Morgan & Hancock, 2011) is often the focus of such research. As such, an operator’s effectiveness and accuracy may be affected by these changes in workload (Bowers et al., 2016).
workload dynamics, such as workload transition. As more emphasis is being placed on understanding the interaction between human and system in the context of functions that are shared, it should be recognized that operator workload might vary dramatically over time as systems attain a more dominant role in controlling the information rate to which she/he must respond (Matthews, 1986).
A workload transition is a shift in the difficulty of a cognitive task. This is important because a performer’s effectiveness and accuracy may be affected by these transitions or workload profile (Bowers et al., 2016). For example, Morgan & Hancock (2011) used driving as an example and pointed out that the history of previously experienced events may be as influential on driver response and levels of workload as are current levels of demand. The term most applicable to the ongoing influence of such prior historical influences is “hysteresis” (Morgan & Hancock, 2011).
Any effects of prior task workload on post-transition performance are called hysteresis effects. For most professions, a transient change in effectiveness is not a concern; however, in some professions, there is little room for error. For instance, an investigation of air traffic control (ATC) operational errors showed that a high proportion of near misses occurred after a period of sustained high workload, suggesting that the hysteresis effect may have been a strong contributor (Farrell, 1999).
removed, is said to demonstrate hysteresis. Despite the crucial impact of workload transition on behavioral performance, and cognitive states, this effect remains still unclear.
1.2. Research challenges
Several studies have described how workload transition effects or hysteresis effects develop over
time by comparing aggregated performance data of multiple periods (e.g., Matthews, 1986;
Gluckman et al., 1993; Ungar, 2005; Cox-Fuenzalida, 2007). Various cognitive models and
approaches have been utilized to measure user performance in multitasking. Nevertheless, the
previous studies on workload transition effects during multitasking still have three significant gaps.
1.2.1. Mixed findings on workload transition effects
The previous studies demonstrated that the effects of workload transitions might significantly affect performance, mental workload, and brain activity. These studies mainly examined the impacts of workload transitions on performance. Only a few studies had shown neurophysiological changes when the workload transitions occurred. Despite these attempts, the overall results of workload transition studies have been mixed and inconsistent depending on transition profiles and tasks, resulting in three different hypotheses: Enhancement, Deterioration, or No change. (See section 2.1 for more details).
1.2.2. Needs for neurocognitive model-based modeling and simulation
Various cognitive models and approaches have been utilized to measure user performance in
multitasking. However, only a limited number of studies have quantitatively analyzed workload
dynamics (Kim et al., 2018). Even fewer studies have shown how to predict and understand
neural mechanisms. The lack of studies on neurocognitive modeling for workload transition effects
has caused inconsistent results. Therefore, we need a quantitative method including
neurophysiological matrices to understand workload transition effects.
1.3. Objectives
This dissertation aims at improving the ACT-R model that can quantitatively analyze workload changes and predict operators’ behavioral performance under multitasking environments. Adaptive Control of Thought-Rational (ACT-R) is a high-level computational simulation of human cognitive processing. ACT-R is one of the cognition theories that seek to predict human performance in cognitive tasks such as multitasking. ACT-R may be a useful tool for unifying multiple disciplines by incorporating behavioral, cognitive, and neurophysiological data into one computational model. In this study, we chose ACT-R as a theoretical framework and expected it to resolve the discrepancies seen in previous research and subsequently help us better understand the underlying neural mechanisms behind workload transition effects.
To address the limitations of previous research, this study addressed the following three research questions:
1) “What is the nature of workload transition effects?” by examining the behavioral, perceived workload, and neurophysiological measures in both a basic cognitive task (in Phase I of Study 1) and a more ecologically valid task (AF-MATB) (in Phase I of Study 2).
the three hypotheses on workload transitions effects (i.e., the “Enhancement,” “Deterioration,” or “No change”) can be supported.
3) “What is a systematic way that can improve the fitness of the ACT-R model that simulated human performance during workload transitions?” by validating a proposed ACT-R parameter tuning framework using both behavioral measures and effectivity connectivity of human operators.
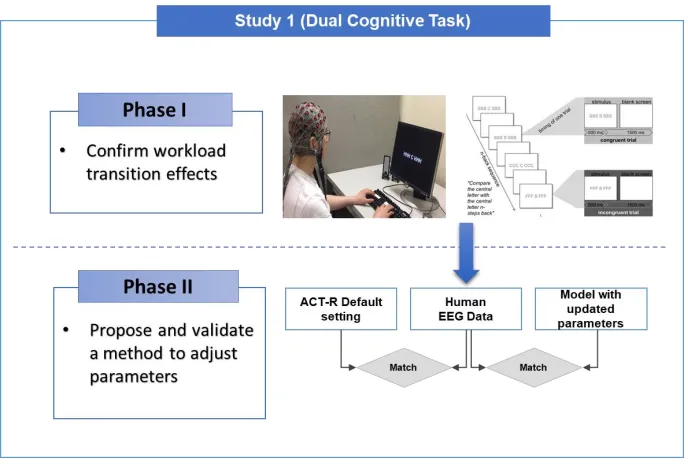
Figure 1.2 illustrates the framework of the present research that is composed of two studies, each having two phases. In Study 1, we used a simple cognitive dual-task to investigate hysteresis effects. In Study 2, we utilized the AF-MATB, which is a more ecologically valid task, to mimic the real-world multitasking settings.
1.4. Organization of this dissertation
The remainder of the dissertation is organized as follows:
Chapter 2 presented a comprehensive literature review related to three relevant topics of this research, including workload transition in multitasking, ACT-R, application of brain connectivity for ACT-R modeling.
Chapter 3 introduced Study 1. This chapter first explains the details of the experimental paradigm with a dual cognitive task (combined n-back and Flanker). In phase II, we proposed the method on how to modify the ACT-R parameters based on the acquired neuroimaging data, while reflecting the workload transition effect.
Chapter 4 described the research strategies of Study 2 in detail. The AF-MATB was employed as a multitasking platform, and the proposed ACT-R parameter tuning method was implied and validated on the application of AF-MATB tasks.
Chapter 5 discussed the general findings from Study 1 and 2.
2. Literature review
This chapter reviews a wide range of studies that investigated workload transition effects, ACT-R modeling of human performance, and brain effective connectivity. Section 2.1 covers the effects of workload transition on operators’ performance, mental workload, and neurophysiological measures. Section 2.2 presents ACT-R studies on multitasking and previous ACT-R modeling approaches. Finally, section 2.3 discusses what brain effective connectivity (EC) is and how we can incorporate EC measures into ACT-R architecture.
2.1. Workload transition in multitasking
This section reviews studies that mainly examined the effects of workload transition in multitasking on performance, mental workload, and neurophysiological responses. In addition, previous studies that investigated individual differences in workload transition are reviewed.
Workload transition, or a workload shift, has significant implications for many work environments. These implications are particularly salient in occupations, where individuals are confronted with varying levels of workload demands, especially safety-sensitive occupations. The finding that demand transitions make human performance more unpredictable may have implications for human performance modelers (Wickens et al., 1998).
2.1.1. Changes in workload transition affect task performance
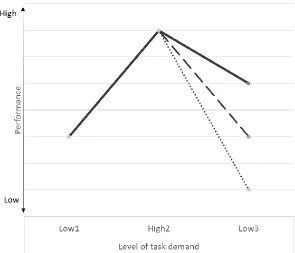
The directions of workload transitions (i.e., increasing or decreasing load) produced mixed evidence regarding their effects on task performance. In previous studies, a reduced performance (Krulewitz et al., 1975; Gluckman et al., 1993; Hancock et al., 1995; Moroney et al., 1995;
improvement (Matthews, 1986; Ungar et al., 2005; Kim et al., 2018) were observed (see Figure 2.1); hereinafter they will be referred to as the “Deterioration” hypothesis, “No change” hypothesis, and “Enhancement” hypothesis, respectively.
First, previous studies have shown that a decrease in task demand often caused subsequent performance deterioration ((C) in Figure 2.1).
Figure 2.1. Inconsistent hysteresis effects on performance
transitioned from a low number to a high number of background signals (low-high). The last two conditions had continuously high levels (high-high) or continuously low levels (low-low) of background signals. During the first twenty minutes of post-transition, significant performance differences were not found between the high-low and low-low conditions or between the low-high and high-high workload transition conditions. However, participants in the low-high condition performed significantly worse than those in the high-high condition in the second period of the post-transition session.
Gluckman et al. (1993) pointed out that demand transitions were induced by shifting from two parallel visual signal detection tasks to one signal detection task or vice versa. Pre-transition and post-transition performance were measured in two periods of ten minutes and compared against non-shifting control groups. A hysteresis effect in the form of lower performance was found only with the shift from dual-task to a single task.
Moroney et al. (1995) conducted a study examining the effect of abrupt and gradual changes in demand on performance during low-to-high and high-to-low demand transitions. In this study, the participants performed a vigilance task in which they were required to observe two identically oriented lines. A critical event occurred when the two lines were not oriented in the same direction. Each trial contained a transition from high to low workload or from low to high workload, and those transitions could occur abruptly or gradually. The results showed that in the low-high demand group, the participants in both the gradual and the abrupt transition conditions performed significantly worse than their non-shifted controls after the transition period. The participants in the high-low demand groups, in both the abrupt and gradual transition conditions, all began the vigil with detection scores below those of the non-shifted controls, and their scores remained low for the rest of the vigil.
to the means of the corresponding baseline trials, the difference between the two was larger than when the low-medium trials were compared to the corresponding baseline trials. This difference led the authors to conclude that sudden decreases in demand may be more damaging than sudden increases in demand.
Next, two studies did not find hysteresis effects during workload transition ((B) in Figure 2.1). Helton et al. (2004) conducted an experiment investigating the effects of salience on performance, using three salience conditions: low-high, consistently low, and consistent high. The analysis of the results revealed no significant differences when the performance of the participants in the high-low was compared to the performance of those in the low salience control group. Similarly, no significant differences were found in the performance of low-high as compared to the high salience control group. Cox-Fuenzalida (2007) manipulated the difficulty of an auditory signal detection task and did not find a hysteretic effect in the case of a shift from low to high.
demand for each block was randomized. For the third condition, there was a schedule of high demand for three blocks (twelve strings each), and then there would be one block of low demand (three strings each). That pattern was repeated four times. Finally, the fourth condition was the reverse of the third condition. There were three blocks of low demand (three strings) and then one block of high demand (twelve strings), with that pattern repeated four times. Additionally, there were four control conditions in which each of the participants completed 16 blocks, each at one of the four levels of demand (3, 6, 9 or 12 strings). Matthews (1986) expected that participants who were transitioned from a high level of workload to a lower level would maintain their high level of responding despite the change; thus, transitioned participants would perform better after the transition than participants in low-workload control conditions. Except for sudden demand changes, the other results of a cyclic transition group showed that any workload transition, whether it increased or decreased the level of demand, improved performance.
Ungar et al. (2005) used a manual, compensatory tracking task that was paired with a vigilance task under dual-task performance conditions. Performance for participants who were transitioned from a dual-task condition involving concurrent difficult tracking and vigilance performance to the single-task condition requiring difficult tracking was significantly worse than that of participants who only performed the difficult tracking task in a control condition. However, the performance for the participants who transitioned from a dual-task condition requiring concurrent performance of easy tracking and vigilance tasks to a single task involving easy tracking was significantly better than that of the easy tracking controls.
distinguished task demands in three stages (Low-High-Low). They found significant hysteresis effects on performance; specifically, post-transition reaction time was shorter than pre-transition. Overall, the effects of workload transitions on performance are inconsistent, but the majority of evidence suggests they are detrimental to task performance. These studies showed that the partitioning of performance data into a sequence of post-transition periods is essential to investigate how hysteresis develops during the time frame of an experimental condition and thus potentially in real-world situations. A next question, then, is whether hysteresis also affects mental workload.
2.1.2. Variability of task demand and mental workload
Although mental workload has been the subject of increased interest and research activity in recent years, one variable that may be of some significance, workload history, has been consistently overlooked (Morgan & Hancock, 2011). Traditionally, temporal effects that are most often reported in the vigilance literature are described in terms of workload levels that are stable over time, and interest has focused largely on the performance changes associated with time on task. Several studies on demand transitions assessed mental workload in addition to performance.
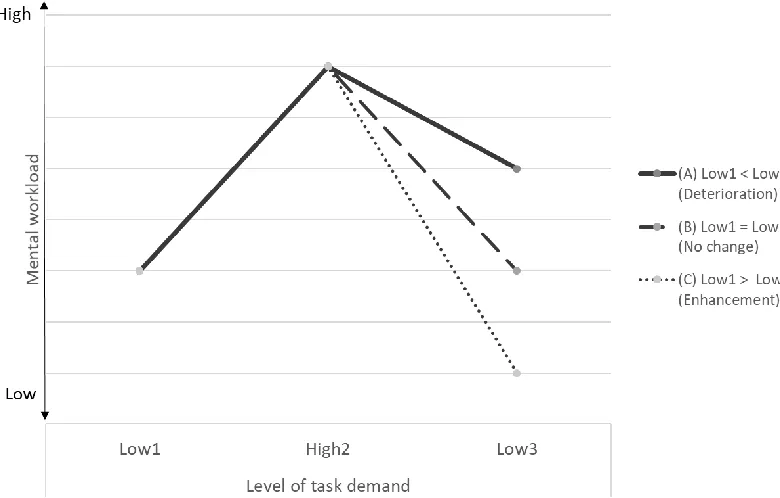
Figure 2.2. Inconsistent hysteresis effects on mental workload
As in the previously described studies in Section 2.1.1, in Moroney et al. (1995) study, the NASA TLX was administered to each participant at the conclusion of the vigilance task. Even though participants in the Low-High and High-Low conditions all experienced the same levels of demand during the vigil, there were some significant differences in the participants’ ratings on the mental demand subscale of the TLX. In the abrupt shift condition, those shifted from High-to-Low reported significantly higher mental demand than those who were transitioned from Low-to-High. Interestingly, the participants in the gradual transition condition reported the opposite effect. Those in the Low-to-High group reported significantly higher mental demand than those in the High-to-Low demand group. Thus, the results of the NASA TLX provide evidence that participants found the High-Low and Low-High conditions to be quite different in terms of the mental demand placed upon them and depending on the other conditions experienced at the time (but only for the mental demand scale).
Kim et al. (2018) used the unidimensional Instantaneous Self-Assessment (ISA) scale (Tattersall & Foord, 1996) to assess mental workload during an AF-MATB experiment with three stages (Low-High-Low). ISA questionnaires (i.e., “Report how much mental workload the task just required”) were collected verbally two times during each condition. The results showed a lower score in the post-transition period from high to low, but there was no significant difference between the first low condition and the third low condition.
Morgan & Hancock (2011) conducted a study using a driving simulation task to explore the effects of a sudden increase in workload on performance and subjective workload ratings. The workload was assessed by using a simplified version of the SWAT technique (S-SWAT; Luximon & Goonetilleke, 2001). Participants in this study completed four, 5-minute driving trials. During each trial, the heads-up navigation display would malfunction at approximately 3 minutes and 20 seconds into the drive. To correct the malfunction, the drivers would read a 10-digit alphanumeric code aloud to the experimenter. This was the only significant change in workload during the drive. Morgan & Hancock (2011) examined performance and subjective workload at three points during the drive: once at one minute and twenty seconds into the drive (low workload), again after the navigation error had been corrected (high workload), and finally, at the end of the trial (low workload). Since the S-SWAT assesses three factors (i.e. time, mental effort, and psychological stress) participants verbally reported their ratings (scale of 0-100) to the experimenter at those points during the drive.
differences between the first period and the third period in the S-SWAT overall workload scores and in each of the subscales scores all demonstrate hysteresis effects.
The aforementioned studies demonstrate that hysteresis is also manifested in mental workload. However, none of them partitioned the data in a sequence of post-transition periods because subjective workload ratings were collected only once after each experimental condition. Consequently, the development of mental workload during experimental conditions could not be investigated. Neuroimaging techniques can address this issue because they allow us to continuously measure the operator’s cognitive states during variable task load. Therefore, the next section covers workload transition studies using neuroimaging techniques.
2.1.3. Workload transition effects on neurophysiological responses
Studies have been conducted to investigate the relationship between the hysteresis effect and the brain activity caused by the change of cognitive states. This section reviews studies that used three different neuroimaging techniques; functional magnetic resonance imaging (fMRI), functional near-infrared spectroscopy (fNIRS) and electroencephalography (EEG).
To the best of my knowledge, there is no research on workload transition effects by using fMRI; only a few studies have shown different brain activities related to workload. Schweizer et al. (2013) used fMRI to identify differences in brain activation by the level of workload in distracted driving. Deprez et al. (2013) found that there is a difference in brain activation during single, dual, and multiple tasks in visual and auditory domains.
region of the ventrolateral prefrontal cortex (VLPFC) in which oxygenated hemoglobin (HbO2) was increased during post transition period from steady-state low load to transient high load. Task performance negatively modulated HbO2 in this brain region during that period. The results show neural effects specifically within the period of post-transition.
Two studies on workload transition (within the AF-MATB environment) have assessed the hysteresis effect by using EEG data. In the first of these, Bowers et al. (2014) reported there was a hysteretic effect in gamma activity of the EEG signal following a high- to low-demand transition as observed in a delay of gamma power’s changes. They found that temporal gamma oscillations changed rapidly following a transition and settled after task difficulty changed from easy to hard, but settled more slowly when the difficulty changed from hard to easy. Frontal theta oscillations, in contrast, exhibited consistently rapid settling, which may indicate rapid changes in working memory utilization and conflict resolution (Gevins et al., 1997). Secondly, Kim et al. (2018) found significant hysteresis effects on brain network measures such as prefrontal cortex outflow and connectivity magnitude, which allowed us to clarify the direction and strength of Granger causality flow under workload transitions. They showed that after completing the high-demand condition, the prefrontal area remained to activate, so the direction and magnitude of connectivity within the neural network might differ from the pre-transition period.
2.1.4. Individual differences and workload transition
Except in one case (Bowers et al., 2014), workload transition studies have made no attempt to adapt task demand manipulations to individuals. Without adaptation, individual differences in cognitive capacity can result in different levels of cognitive load in different individuals even when task demands are identical. When workload transitions to different levels of an ‘optimal’ cognitive load state have minimal confounding effects. However, if workload transitions cause some individuals to transition out of an ‘optimal’ cognitive load state and into an overload or underload state a lack of individual adaptation is problematic for assessing workload transition effects. The examination of overload and underload is important because these workload states have the greatest effect on task performance. While different levels of an ‘optimal’ cognitive load state should elicit positive task performance, both overload and underload are likely to elicit inferior task performance. The overload state should result in errors related to an inability to process more, or new information, leading to an inability to cope with the cognitive demands of current or novel tasks (Parasuraman et al., 2008). The underload state which is believed to be as detrimental (Hancock & Parasuraman, 1992) and more difficult to measure than overload (Hancock & Verwey, 1997) appears to induce its own unique task decrements. In order to address issues of workload transitions into overload and underload it is necessary to adapt task demands on an individual basis. Furthermore, given that cognitive load and task performance are not equivalent (Parasuraman et al., 2008) other objective measures of cognitive load are required.
memory refers to a limited capacity store (be it a unique buffer or part of long term memory) (Logie, 2011; Baddeley, 2012) that works in conjunction with a cohort of executive functions (Unsworth & Engle, 2007). Working memory capacity (WMC) is predictive of performance in several complex cognitive tasks. Specifically, individuals with high WMC exhibit superior visual attention (Engle, 2002), inhibition of irrelevant representations (Unsworth & Engle, 2007) and improved time-critical decision making (Endsley, 1995). Individuals with a greater working memory capacity also store more task-relevant information and recall that information more quickly. High working memory individuals also update information more efficiently, shift and maintain task goals with less error, and better cope with distractions (Unsworth & Engel, 2007). The theoretical underpinnings of working memory, specifically its predictive power for basic and complex tasks and its property of instantly affecting cognitive load make it a prime concept for studying workload transitions.
2.1.5. Limitations of current studies on workload transition in multitasking
From a systematic literature review of the workload transition in current studies in Section 2.1, two important issues were identified as follows:
(1) The overall results have been mixed, and workload transition effects are still poorly understood. Although the previous studies demonstrated that the effects of workload transitions may significantly impact performance, mental workload, and brain activity, those outcomes resulted in three different hypotheses: Enhancement, Deterioration, or No change.
develop a computational model to quantitatively analyze workload transition effects and multitasking performance.
2.2. Adaptive Control of Thought-Rational (ACT-R): A cognitive architecture
In order to overcome the limitations of the studies on the workload transition effects reviewed in the previous section, we need to consider various empirical data. Logical interpretation of the results of workload transition requires incorporating behavioral, cognitive, and neural outcomes. Specifically, brain activity measures would enable us to explain underlying neural mechanism, which has not been uncovered by previous studies. ACT-R is an effective model that can incorporate the various types of data (behavioral, cognitive, and neurophysiological).
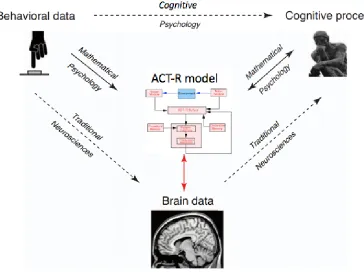
This section reviews one of the neurocognitive architectures, ACT-R that can unify different scientific disciplines: cognitive psychology, cognitive modeling, and traditional neurosciences.
Figure 2.3. Neurocognitive modeling paradigm (modified from Forstmann et al., 2011)
2.2.1. Overview of ACT-R
In 1983, Anderson published his seminal work The Architecture of Cognition (Anderson, 1983).
exist, such as State, Operator, And Result (SOAR) (Laird, 2012), ACT-R (Anderson et al., 2004; Anderson, 2007), and Connectionist Learning with Adaptive Rule Induction On-line (CLARION) (Sun, 2006; Sun, 2007), the current dissertation is focused on ACT-R.
Adaptive Control of Thought-Rational (ACT-R) is a rule-based system that has been widely used by cognitive scientists to model human cognitive performance. It is also one of the few cognitive architectures that have an explicit link to research in the neurocognitive domain: the structural elements of the core ACT-R architecture (i.e., its modules and buffers) map onto different regions of the human brain (Anderson, 2007). This enables cognitive modelers to predict the activity of different brain regions at specific junctures in a cognitive task (Anderson, 2007).
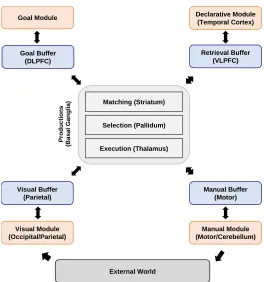
Figure 2.4. Overview of ACT-R modules (adapted from Kim et al. 2018)
It treats the mind as being composed of distinct modules that exist for particular functions. The ACT-R modules represent the functions of the brain as well as how these functions are mapped to different parts of the brain.
ACT-R incorporates both declarative knowledge (e.g., addition facts) and procedural knowledge (e.g., rules for solving multi-column addition) into a production system where procedural rules act on declarative chunks (Anderson et al., 2004). In ACT-R, the structures of declarative knowledge are called “chunks” and held in the Declarative module, whereas those of procedural knowledge is called “rules” and held in the Procedural module. The rules also have access to other modules, including the Visual module for perception, the Manual module for action, the Imaginal module for storing visual problem representation, and the Goal module for keeping track of current intentions. These modules are linked to specific areas of the brain: Manual in the
motor cortex (BA 3/4), Imaginal in the parietal cortex (BA 39/40), Declarative in the dorsolateral prefrontal cortex (DLPFC) (BA 45/46), Goal in the anterior cingulate cortex (ACC) (BA 24/32), Visual in the fusiform gyrus (BA 37), and Procedural in the caudate of the basal ganglia (Matessa, 2008) (Refer to Figure 2.4). Each module of ACT-R has its buffer that can store only one chunk of information extracted from the corresponding module. In ACT-R, the condition statements of all production rules are compared with the current contents of buffers every 50 ms (Anderson, 2007).
When there are one or more matching productions, the matching one or the one with the highest expected value among them, respectively, is selected to fire, and the action statement of the selected rule then makes each module exchange chunks of information or creates new chunks in the particular modules (Taatgen & Lee, 2003). At this time, only one chunk can be processed through each buffer at a time, while all modules can be executed simultaneously. For example, the declarative module cannot retrieve the additional memory chunk until it has completed the previous retrieval. In contrast, the manual module can perform the physical movement, while the visual module looks at a new object. Moreover, there is a limit to the number of objects and a time limit in the visual and retrieval buffer. These are related to the working memory limitation of human cognitive processing (Anderson et al., 2004).
2.2.2. Cognitive modeling of multitasking using ACT-R
include simulated representations of human cognitive processes such as memory, attention, visual and motor processing, problem-solving, learning, and other related phenomena (Anderson et al., 2004). Important insights about the cognitive mechanisms behind multitasking and how brain networks are affected by changes in internal cognitive strategies, external interface properties, and task demands arise by comparing simulated human cognitive data from the ACT-R architecture to real human data (Kim et al., 2018).
Previous studies conducted within the framework of cognitive architectures have focused on multitasking in small-scale (e.g., Psychological Refractory Period (PRP)) tasks (Byrne & Anderson, 2001; Salvucci et al., 2004). These models tend to have ‘customized executives’ (Kieras et al., 2000) that are limited to a particular task. Other modeling efforts have focused on the general characteristics of domain-independent multitasking by integrating smaller task models (Kieras et al., 2000). For example, Salvucci (2005) has described a general executive module for the ACT-R architecture, and Taatgen (2005) has explored a general way in which this architecture can account for multiple concurrent tasks.
dual-tasking is the result of interactions between different resources that together form a working memory system.
2.2.3. ACT-R modeling approaches
ACT-R has a subsymbolic level in which continuously varying quantities are processed in parallel to produce much of the qualitative structure of human cognition. These subsymbolic quantities participate in neural-like activation processes that determine the speed and success of access to chunks in declarative memory as well as the conflict resolution among production rules. The core of ACT-R memory modeling can be summarized in the following equations (Anderson et al., 2004).
In this study, we focused on three parameters for reflection of hysteresis effects based on Nijboer et al. (2015) study. The first is a retrieval threshold (𝜏) (see equation (3)), which determines the minimal amount of activation required to retrieve a chunk. Next, the activation noise (𝜀) (see equation (1)) is the amount of random activation added or subtracted to individual chunk activations. Lastly, the latency-scaling factor (F) (see equation (4)) scales the retrieval times of chunks based on their activation.
The activation A(t) of a particular chunk is defined as where B(t) is the base activation of the knowledge chunk at time t, and the summation is the associative strength of the chunk dependent on related chunks, defined as “the elements in the current goal chunk and the elements currently being processed in the perceptual field." (Anderson, 1993, p 51.)
𝐴(𝑡) = 𝐵(𝑡) + ∑ 𝑤𝑗 𝑗𝑠𝑖𝑗+ 𝜀 (1)
The 𝑠𝑖𝑗 ∈ [−∞ + ∞] are the strengths of association to i from elements j in the current context.
𝜀: The noise value, as described in the last unit.
The base activation B (t) is increased whenever it is used, either through practice (learning events) or when matched to a production rule.
𝐵(𝑡) = 𝑙𝑛 ∑ 𝑡𝑘 𝑘−𝑑 + 𝐵 (2)
The decay rate, d, is defined for the particular learning event k.
If we make a retrieval request and there is a matching chunk, that chunk will only be retrieved if it exceeds the retrieval activation threshold, 𝜏. The probability of this happening depends on the expected activation, Ai, and the amount of noise in the system which is controlled by the parameter s:
𝑟𝑒𝑐𝑎𝑙𝑙 𝑝𝑟𝑜𝑏𝑎𝑏𝑖𝑙𝑖𝑡𝑦
𝑖=
11+ 𝑒𝜏−𝐴𝑖𝑠
(3)
Inspection of that formula shows that as Ai tends higher, the probability of recall approaches 1, whereas as t tends higher, the probability decreases. When𝜏 = Ai, the probability of recall is 0.5. The s parameter controls the sensitivity of recall to changes in activation. If s is close to 0, the transition from near 0% recall to near 100% will be abrupt, whereas when s is larger, the transition will be a slow sigmoidal curve.
The activation of a chunk also determines how quickly it can be retrieved. When a retrieval request is made the time it takes until the chunk that is retrieved is available in the retrieval buffer is given by this equation:
F: The latency factor parameter.
If no chunk matches the retrieval request, or no chunk has an activation which is greater than the retrieval threshold, then a retrieval failure will occur (Taatgen et al., 2006). These equations provide an integrated foundation for theory development in memory encoding, storage, retrieval, and by extension to Workload Transition Effect analysis, which is critical for the explanation of hysteresis effects.
To evaluate models to be developed in the present study, the basics of ACT-R memory modeling steps are reviewed. Those previously well-defined structures allow us to model our paradigm by using a cognition framework that has been extensively tested. As stated before, current multitasking models do not incorporate the workload transition effect. The next section presents previous modeling approaches to workload based on behavioral data and neural data.
2.2.3.1. Behavioral data-based modeling
Lebiere et al. (2001) proposed a workload prediction method based on ACT-R to predict the workload in air traffic control simulations. The workload of an ACT-R model was assumed as the scaled ratio between the times spent on critical unit tasks to the total time of the task. However, he considered only time as the resource related to mental workload. Gray et al. (2005) suggested cognitive-metrics profiling, also based on ACT-R, as a theory-based prediction of transient changes in the workload demanded by dynamic task environments, but they did not introduce the detailed procedure or mathematical representation to predict the mental workload over time.
the likelihood that a chunk will be needed, like sequential sampling models of cognitive behavior (Ratcliff, 1978; Usher & McClelland, 2001). The dynamics of the competition between memory chunks governs the retrieval time from declarative memory. Because RACE/A dynamically updates the activation values of chunks, it can explain the interference effects observed in semantic memory retrieval better than existing ACT-R models. RACE⁄A differs from default ACT-R in a number of ways. However, these adaptations do not change the central assumptions (Cooper, 2007) that underlie ACT-R. The first obvious deviation from the default architecture is the inclusion of an accumulative process for memory retrievals. The new model increases the explanatory power of the architecture. However, in the absence of competition between chunks RACE⁄A makes the same predictions as ACT-R.
In order to assess what changes were required to the model to better fit the data, Nijboer et al. (2016) made several small changes that together resulted in the updated model: To accurately capture tone-counting performance, they introduced the possibility of making a mistake during counting. Anecdotal evidence suggested that participants were sometimes mistaking low tones for high tones. Therefore, model parameters were adjusted to optimize the quantitative fit: The retrieval threshold determines the minimal amount of activation required to retrieve a chunk. The activation noise is the amount of random activation added or subtracted to individual chunk activations. The latency-scaling factor scales the retrieval times of chunks based on their activation. Finally, the sound decay time determines how long sounds observed by the aural module are available for further processing before they are discarded.
decreases over time. This is implemented by giving each item an activation value, which is a numerical expression of its strength in memory. This activation value decays over time (Anderson, 2007), but increases when the associated fact is retrieved: Items that have been used more often or more recently will have a higher activation. The activation value is used during the retrieval phase, where it determines how long the retrieval will take (a higher activation value results in shorter retrievals), and whether retrieval is possible at all (a chunk can only be retrieved if its activation value exceeds a predefined retrieval threshold value).
2.2.3.2. Neurological data-based ACT-R modeling
Borst et al. (2016) maintained that cognitive models are hard to validate and estimate their quality based on behavioral measures alone. Neuroimaging data can provide additional constraints, but this requires a mapping from model components to brain regions. Several mappings between ACT-R modules and brain regions exist (Anderson, 2007; Anderson et al., 2008; Nijboer et al., 2016). One of the current research areas with ACT-R is utilizing the buffers to track the activity of their associated modules and then comparing that activity to data from neuroimaging studies (e.g., fMRI, MEG, or EEG) in order to identify correlations between regions of the brain and particular buffer/module activity in ACT-R models.
these regions increases. fMRI allows us to track this using the blood oxygen level-dependent (BOLD) signal. As such, the BOLD signal is often used as a proxy of brain activity in an area, though this proxy is delayed, as the flow is not instantaneous. (Rosenberg-Lee et al., 2009).
The ACT-R architecture is also flexible enough that innovations made in neuro-computational models can be implemented. Originally, the existence of a connectionist implementation of ACT-R was sufficient proof of the neural plausibility of the architecture (Lebiere & Anderson, 1993). But with the increased focus on mapping functionality to specific brain regions of interest (ROIs), the question of how the ROIs implement their respective modules' functionality has risen. This is especially so for modules that are part of the basic information processing circuit (Anderson et al., 2008), which function independently from specific inputs or outputs (Anderson et al., 2007). Explaining how they are connected to other brain regions is a crucial part of understanding their functionality.
Research using fMRI has been able to develop an understanding of the roles of various brain regions and assign the cognitive functionality of those regions to ACT-R modules and buffers (Cassenti et al., 2011). Despite the strong correlation between fMRI data and ACT-R, it is unknown whether ACT-R also holds a strong correlation with EEG data. Recently, interest in this area has piqued with researchers, who have been outlining methods to study the neural correlates of ACT-R in electrophysiological data and have been demonstrating how different ACT-R modules can be associated with observable EEG data (Cassenti et al., 2011; Vugt, 2012; Vugt, 2014). Despite initial attempts to correlate ACT-R and EEG data, more investigation is required in this area.
neuroscience and cognitive modeling with ACT-R. Specifically, this study aimed to develop models of multitasking behavior in a realistically complex workspace, incorporating a wide range of cognitive processes that are affected by task demand transitions. Multitasking environments can often give rise to such transitions in task demand and subjective mental workload, as the operator is actively monitoring and engaging in several different tasks at once.
In this dissertation, we also proposed a method to create data-driven parameter mappings from components of cognitive models to brain regions. The new ACT-R model parameters mapping/tuning method would be at least as powerful as an existing parameter adjustment that was based on the literature and indicated where the models were supported by the data and where they have to be improved. In the next section, we reviewed previous literatures regarding how to adjust ACT-R model parameters in order to improve models.
2.2.3.3. How to tune ACT-R model parameters
(2017) optimized the value of the same parameter in a later study using automatic methods, ending up with a smaller fixation duration around 250 ms, which resulted in a better model fit to observation data.
Their fit and generalizability often evaluate computational cognitive models. These properties of a model are related to two aspects of model complexity: (1) the number of parameters and (2) the functional forms of computation. In part, such evaluations seek to evaluate the extent to which noise is unnecessarily captured (Pitt et al., 2002; Oaksford, 2002). Using cross-validation, Taatgen et al. (2007) estimated parameters of a base-model once and then made use of these estimated values throughout subsequent models. To provide an alternative to estimate parameters, Wong et al. (2010) developed a database by collecting estimated and modified ACT-R parameters from the ACT-R modeling community. However, no systemically assessment has validated whether there is any sustained regularity of these estimated parameters for ACT-R models across other published studies.
2.2.4. Limitations of current studies on ACT-R modeling of multitasking
as well as the modules' interaction (van Vugt, 2014; Kim et al., 2018). (3) The ACT-R architecture requires multiple parameters (Bothell, 2010) which affect the model's performance. However, as previously mentioned many researchers have used the default values for all parameters (Baker, 1963; Gartenberg et al., 2014) or found optimized parameters through trial and error (Wong et al., 2010).
This study proposed a new method to quantitatively calibrate ACT-R parameters based on brain connectivity measures. Many ACT-R studies reported their parameter modifications or estimations, with the average 5.93 parameters modified for each study (Wong et al., 2010). Among the ACT-R parameters that were modified in these studies, the three most frequently modified ones were retrieval threshold, module activation noise, and latency-scaling factor. The next section presented how our method calibrates these three parameters by using EEG data and brain effective connectivity.
2.3. Application of brain connectivity for ACT-R modeling
As previously mentioned, one of the ACT-R model's advantages is its ability to control the activation of modules by a millisecond. For example, time duration to activate the production rule is set to 50ms. One of the best ways to fully utilize this advantage is comparing EEG data and time-series data of module activation (Perzenski, van Vugt). Unlike fMRI, EEG data can collect data with superior temporal resolution, thus contributing more to ACT-R modeling adjustments. Specifically, ACT-R model is suitable to quantify neural mechanism behind workload transition effects that change over time.
measures into ACT-R modeling as a major model component. This allows us to evaluate the interactions between modules and causal relationships based on brain effective connectivity. Therefore, based on several connectivity measures, we proposed a new way to adjust three major ACT-R model parameters mentioned in the previous section. This section reviews previous studies on brain connectivity.
2.3.1. Analyzing effective connectivity with Granger causality
Studies of human brain connectivity generally fall under three categories: structural, functional, and effective connectivity (Bullmore & Sporns, 2009). Structural connectivity denotes networks of anatomical (e.g., axonal) links. The primary goal is to understand the influences of brain structures via direct or indirect axonal connections. This might be studied in vivo using invasive axonal labeling techniques or noninvasive MRI-based diffusion-weighted imaging (DWI/DTI) methods (Bullmore & Sporns, 2009). Functional connectivity denotes (symmetrical) correlations in activity among brain regions during information processing. Here the primary goal is to understand which regions are functionally related through correlations, as measured by some imaging technique. fMRI is a popular tool to analyze functional connectivity. The analysis has computed the pairwise correlation (or partial correlation) in BOLD activity for a large number of voxels or regions of interest within the brain volume. In contrast to the symmetric nature of functional connectivity, effective connectivity denotes asymmetric or causal dependencies between brain regions. Here the primary goal is to identify which brain structures in a functional network are (causally) influencing other elements of the network during information processing. Often the term “information flow” is used to indicate directionally specific (although not necessarily causal) effective connectivity between neuronal structures. Popular effective connectivity methods applied to fMRI and/or electrophysiological (EEG, iEEG, or MEG) imaging data, include dynamic causal modeling, structural equation modeling, transfer entropy, and Granger-causal methods (Mullen, 2010).
concept was first introduced by Wiener (1958) and later reformulated by Granger (1969). In the context of linear stochastic autoregressive models, it relies on two assumptions:
1. Causes should precede their effects in time (temporal precedence)
2. Information in a cause’s past should improve the prediction of the effect, above and beyond the information contained in past of the effect (and other measured variables)
Granger causality is based on the principle that directional causal influence from time series A to time series B can be inferred if past values of time series A help predict the present and future values of the time series B (Granger, 1969).
Given k time series 𝑋(𝑡) = [ 𝑥1(𝑡) × 𝑥2(𝑡) … 𝑥𝑘(𝑡)], The multivariate vector autoregressive (MVAR) of order p is
𝑋𝑡 = ∑𝑝𝑘=1𝐴𝑘𝑥𝑡−𝑘+ 𝐸(𝑡) (1)
Where A(n) is the coefficient of the model, as shown in Eq. (2) and E(t) is the model error.
𝐴𝑘= [
𝑎11(𝑛) ⋯ 𝑎
1𝑘(𝑛)
⋮ ⋱ ⋮
𝑎𝑘1(𝑛) ⋯ 𝑎𝑘𝑘(𝑛)
]
The Directed Transfer Function (DTF) allows for analysis of short epochs of EEG activity to analyze information flow between different brain structures while making it possible to determine the spectral content of the signal (Kamiński et al., 2001). Below formula indicates normalization of the DTF, where A(f) = ∑𝑝𝑘=0𝐴̂𝑒𝑘 −𝑖2𝜋𝑓𝑘, H(f) is the transfer matrix of A(f).
η2
𝑖𝑗(𝑓) =
|𝐻𝑖𝑗(𝑓)|2
∑ ∑𝑓 𝑀𝑘=1|𝐻𝑖𝑗(𝑓)|2
However, DTF is limited by its ability to differentiate between direct and indirect connections. By combining DTF and partial coherence (pCoh) measures, dDTF quantifies conditional, directionally-specific information transfer between sources over the trial time period at each frequency (Korzeniewska et al., 2003).
The partial coherence between i and j is the remaining coherence which cannot be explained by a linear combination of coherence between i and j and other measured variables.
𝑃𝑖𝑗(𝑓) = 𝑆̂𝑖𝑗(𝑓)
√𝑆̂𝑖𝑖(𝑓)𝑆̂𝑗𝑗(𝑓)
Thus, 𝑃𝑖𝑗(𝑓) can regards as the conditional coherence between i and j with respect to all other measured variables, where spectral density matrix S(f) = H(f)ΣH(f)−1, Ŝ = S−1 (Brillinger,
2001).
The direct Directed Transfer Function (dDTF) from process j to i is obtained from a fitted VAR[p] model by
δ2
𝑖𝑗(𝑓) = η2𝑖𝑗(𝑓)P2𝑗(𝑓)
It can be shown that η2
𝑖𝑗(𝑓, 𝑡) will be nonzero if and only if there exists a direct (multivariate)