Study of Comparison between Bat Algorithm, Particle Swarm Optimization
(PSO), Grey Wolf Optimization (GWO) for user’s bank loan and their related
due history
R. BharathiM.Tech (Network and Internet Engineering), Department of CSE, Pondicherry University, Puducherry, India
ABSTRACT
This paper shows the users loan details and their payment history. It focusses on the user loan details and whether they are punctual in their due amount that has to be paid by them to bank. Such users loan related issues have to be solved by using three optimization algorithms (Bat algorithm, Particle Swarm Optimization (PSO), Grey Wolf Optimization (GWO)). Thus, the comparison of these three optimization algorithms have been made.
Keywords : Bank Loan, Bat Algorithm, Optimization, Particle Swarm Optimization (PSO), Grey Wolf Optimization (GWO)
I.
INTRODUCTIONThe request of the user for his loan amount depends on the financial status and background of the particular user. When the user request for a loan from a particular bank, they decide whether they can sanction the amount to the user with some specified constraints. If the user satisfies those constraints then the bank is ready to give the loan amount to that particular user as he becomes a confidential person according to the bank.
Some users have the habit of paying the loan amount within the specified time interval. Also some users may not even respond i.e., they do not pay their due and loan amount to the bank in return. To avoid those circumstances the bank creates the users loan related details history as a separate database and keeps track off the current loan amounts and the remaining amount to be paid by the pending users.
The importance of default risk assessment is recognized through the Basel I (1988), Basel II (2004) and Basel III (2010)5 regulatory agreements [1]. The Basel framework introduces common rules regarding capital reserves requirements, which are linked to the degree of default risk for each loan [2]. These rules are incorporated into national laws in the great majority of developed and developing countries around the world [3]. Banks are required to use internal or external credit rating models to classify borrowers according to their default risk probabilities.
Different classes of assets are weighted according to their perceived industry risk [6]. For example, shipping loans have a risk weighting of 100%, whereas house mortgage loans have a risk weighting of 50% [7]. Then, loan applications within shipping are classified according to the credit rating of the obligor applying. The capital requirements are determined based on the classification of loans [8]. It is done through the credit rating process rather than being constant irrespective of the credit type because they were under previous versions of the capital accord. The Basel III agreement retains the bank loans that have introduced in Basel II [9]. The banks have the incentive to underestimate the probability of default (PD) for a borrower in order to keep a lower capital reserve.
The regulators pay more attention to test the accuracy of the internally developed credit risk models by using several validating procedures [10]. The efforts to understand the impact of Basel II risk weighting include Ruthenberg and Landskroner (2008). It is done by using the Israeli economic data of a leading bank for the period 1998–2006 [11]. It shows that a high quality corporate and retail customers usually enjoy lower interest rates for loans drawn by relatively big banks that has adopted the more sophisticated IRB approach [12].
During the late 2000s - Subprime crisis, the Basel III (2010) agreement poses further controls on Tier I and Tier II pillars introduced originally in Basel I (1988) [13]. Then it has been retained in Basel II (2004) agreement [14]. The Basel III (2010) agreement requires banks to hold 4.5% of common equity (2% in Basel II) and 6% of Tier I capital of risk-weighted-assets (RWA) (4% in Basel II) [15].
The agreement poses a leverage ratio in excess of 3% and liquidity requirements based on the computation of ‘‘Liquidity Coverage Ratio” (LCR) [16]. The leverage ratio is calculated by dividing Tier I capital
by the bank’s average total consolidated assets and the ‘‘Liquidity Coverage Ratio” requires a bank to hold sufficient high-quality liquid assets to cover its total net cash outflows over 30 days [17]. TierI(core capital) consists primarily of shareholder’s equity.
It is not inclusive of any ‘‘goodwill”, defined as an intangible asset of the firm which represents the company’s brand name, solid customer base, good customer relations, good employee relations and any patents or proprietary [18-23]. Tier II supplementary capital comprises long-term subordinated loans and fixed assets reserves and is limited to 50% of Tier I capital [24].
The bat algorithm is a meta-heuristic algorithm for global optimization. It was inspired by the echolocation behaviour of microbats, with varying pulse rates of emission and loudness [25].
Echolocation consists in producing a sonar composed of 2 steps:
1. emitting sound pulses,
2. detecting surrounding objects from the reflected echo
The sonar is also used under water by i.e., some kinds of fishes. It is also used by humans (Japanese) to
attract and catch fishes. Micro-bats perceive their environment by:
1. Measuring the distance and orientation of the objects.
2. Detecting the type and the speed of the preys.
Grey Wolf Optimization (GWO) is a swarm intelligent technique which mimics the leadership hierarchy of wolves are well known for their group hunting. Grey wolf belongs to Canidae family and mostly prefer to live in a pack [33]. They have a strict social dominant hierarchy i.e., the leader is a male or female called Alpha (α). The alpha is mostly responsible for decision making. The orders of the dominant wolf should be followed by the pack.
The Betas (β) are subordinate wolves which help the alpha in decision making. The beta is an advisor to alpha and discipliner for the pack. The lower ranking grey wolf is Omega (ω) which has to submit all other dominant wolves. If a wolf is neither an alpha or beta nor omega then it is called delta. Delta (Δ) wolves dominate omega and reports to alpha and beta. The hunting techniques and the social hierarchy of wolves are mathematically modelled in order to develop GWO and perform optimization.
The GWO algorithm mimics the leadership hierarchy and hunting mechanism of grey wolves in nature. There are four types of grey wolves such as alpha (α), beta (β), delta (∆) and omega (ω). They are employed for simulating the leadership hierarchy. The three main steps of hunting are: 1) searching for prey, 2) encircling prey and 3) attacking prey. They are implemented to perform optimization. The GWO algorithm is tested with the standard test functions that indicate that it has superior exploration and exploitation characteristics than other swarm intelligence techniques. The GWO has been successfully applied for solving various engineering optimization problems.
1.2 Motivation
From the past decades various optimization algorithms are addressed to solve the NP Hard problems. Thus, the algorithms are 1) Memetic algorithm, 2) Differential evolution, 3) Evolutionary algorithms, 4) Dynamic relaxation,5) Genetic
algorithms 6) Hill climbing with random restart based Nelder-Mead 7) Particle swarm optimization 8) Ant colony optimization 9) Grey wolf optimizer. The above said algorithm have been used to solve some of the applications but still there more requirements and specifications that must be satisfied. Grey wolf optimizer performs well compared all the other
optimization algorithms, but it flaws in
diversification.
Among all the optimization algorithms, Grey Wolf Optimization (GWO) is best suited. To overcome some of the disadvantages, performance requirements involved in grey wolf optimization.
Meta-heuristic is a population based search paradigm which guides a subordinate heuristic by joining intelligently different concepts for exploiting and exploring the search space but still meta heuristic methods tend to be not performing well. So, we use the Grey Wolf Optimization (GWO) algorithm for to overcome some of the disadvantages that have been addressed in the Bat algorithm, Particle Swarm Optimization (PSO) algorithm.
1.3 Objective
The objective of this project is as follows 1. Users request for bank loan.
2. Users previous loan history has been maintained by the bank.
3. If again the user approaches the bank for loan, the bank will check whether the user is capable of paying the loan amount within the stipulated time interval. 4. This is found by using the users previous amount loan history.
Meta heuristic optimization algorithms are becoming more familiar in engineering applications because they (i) rely on rather easy concepts and being straightforward to implement, (ii) do not require gradient information, (iii) can bypass local optima, (iv) are often used in a wide range of issues covering different disciplines. Vast numbers of algorithms are introduced for different combinatorial optimization problems. The Grey Wolf Optimization (GWO) is one of the new algorithms proposed in 2016. This algorithm is inspired by the social behaviour of grey wolves and it works on leadership hierarchy hunting strategy.
Grey wolves are considered as the top-level predators, they live in a group size of 5–12 wolves. Based on the hunting strategy the grey wolves are classified into four categories such as alpha, beta, delta and omega .The alpha wolves are leader of the bundle. This wolf has the authority to make decision for sleeping place, hunting and so on. These wolves are otherwise called dominant wolves and they strictly instruct other wolves to follow his/her orders [46].
The alpha wolf plays a major role in producing new solutions. Beta wolves are second level of wolves next to the alpha wolves. These wolves are assistant wolves that guide the alpha wolves in decision-making. It also has certain rights to make decision whenever alpha wolves are passed away. These wolves listen to the alpha decision and provide response to the alpha. The delta wolves are next level wolves which are also called subordinate wolves. These wolves are belonging to the categories of elders, sentinels, hunters, scouts and caretakers.
Deltas follow the instruction of alphas and betas but they manage the next level wolves named omega. Finally, omega is the lowest ranking wolves and play the role of scapegoat. These wolves must follow the
instructions of all other dominant wolves. Omegas are not important wolves but they help others from facing internal problems.
GWO algorithm is one of the interesting algorithms due to the group hunting strategy. Thus the wolf hunting is classified into three categories (i) tracking, chasing and approaching the prey, (ii) pursuing, encircling, and harassing the prey until it stops moving and (iii) attacking towards the prey.
In GWO, symbolic representation of alpha, beta and deltas is represented as 𝛼, 𝛽 and 𝛿. The grey wolf optimization algorithm contributes in both the exploration and exploitation phase. The exploitation is to search optimal solution in a local search space. In grey wolf, encircling prey and attacking for prey are two exploitation phases used to explore the optimal solution in a local search space. Here the search for prey works as the exploration phase in which the grey wolves search for the prey in a global search space.
In encircling prey, the grey wolves recognize the location of prey and encircle them. In this phase, the position vector of the prey is defined and other search agents adjust its position based on the best solution obtained. The equation of encircling prey is given below
⃗⃗ =| · p (k) - (k)
⃗⃗⃗ (k+1)= p (k) - · ⃗⃗
where k represents the individual, p represents the prey and A,C are coefficient parameters.
II.
APPROACH/ALGORITHM/TE CHNIQUES
USED
2.1 Bat Algorithm
Fig 1 : Bat emitting the ultrasonic waves and gets it as an echo
Bat algorithm begin
generate at random a population of k bats(k solutions) for each bat i do define its loudness Ai ,its pulse
frequency fi and velocity vi;
set its pulse rate to ri ;
select the best solution x*;
while ((Max-Iter not reached) do
for each i=1 to k do compute a new solution (fi,vi ,xi )
using these formulas if(rand > ri) then
select a solution x’ among the best solutions;
improve the solution using this formula ; end if;
generate at a random a new solution (fi,vi ,xi );
if(rand<Ai) and (f(xi)<f(x*)) then
accept the new solution ;
increase ri and reduce Ai using these formulas end if
end for
The bat algorithm is a meta-heuristic algorithm for global optimization. It was inspired by the echolocation behaviour of microbats, with varying pulse rates of emission and loudness.
Echolocation consists in producing a sonar composed of 2 steps:
1. emitting sound pulses,
2. then detecting surrounding objects from the reflected echo.
The sonar is also used under water by some kinds of fishes. It is also used by humans (Japanese) to attract and catch fishes. Micro-bats perceive their environment by:
1. Measuring the distance and orientation of the objects.
2. Detecting the type and the speed of the preys.
2.2 Particle Swarm Optimization (PSO)
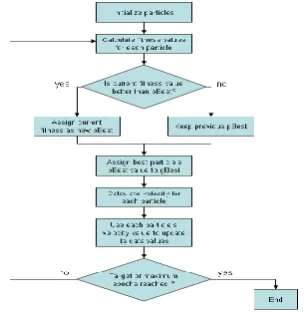
Particle Swarm Optimization (PSO) is a computational method that optimizes a problem by iteratively trying to improve a candidate solution with regard to a given measure of quality [27]. It solves the problem by having a population of candidate solutions i.e., the dubbed particles and moving these particles around in the search-space according to simple mathematical formulae over the particle's position and velocity [28].
Each particle's movement is influenced by its local best known position [29]. It is also guided toward the best known positions in the search-space [30]. They are updated as better positions that has been found by other particles [31]. This is expected to move the swarm toward the best solutions [32].
Fig 2 : Flowchart of PSO Algorithm
Grey wolf optimization is a swarm intelligent technique which mimics the leadership hierarchy of wolves. They are well known for their group hunting. Grey wolf belongs to Canidae family and mostly prefer to live in a pack. They have a strict social dominant hierarchy. The leader is a male or female called Alpha (α) [33]. The alpha is mostly responsible for decision making. The orders of the dominant wolf should be followed by the pack. The Betas (β) are subordinate wolves which help the alpha in decision making.
The beta is an advisor to alpha and discipliner for the pack. The lower ranking grey wolf is Omega (ω) which has to submit all other dominant wolves. If a wolf is neither an alpha or beta nor omega then it is called delta. Delta(Δ) wolves dominate omega and reports to alpha and beta. The hunting techniques and the social hierarchy of wolves are mathematically modelled in order to develop GWO and perform optimization [34]. The GWO algorithm is tested with the standard test functions which indicates that it has superior exploration and exploitation characteristics than other swarm intelligence techniques. The GWO has been successfully applied for solving various engineering optimization problems.
2.3.1 Pseudo code for GWO Algorithm 1: Generate initial search agents Gi(i=1,2,....,n)
2: Initialize the vector’s a ,A and C
3: Estimate the fitness value of each hunt agent Gα=the best hunt agent
Gβ=the second best hunt agent
Gδ=the third best hunt agent
4: Iter:=1 5: repeat
6: for i=1:Gs(grey wolf pack size)
Renew the location of the current hunt agent End for
7: Estimate the fitness value of all hunt agents 8: Update the vectors a, A and C
9: Update the value of Gα, Gβ, Gδ
10: Iter=Iter+1
11: until Iter>=maximum number of iterations {Stopping criteria}
12: output Gα
End
2.4 Implementation
The study of comparison between Bat algorithm, Particle Swarm Optimization (PSO), Grey Wolf Optimization (GWO) have been made. The example application taken here is the bank loan data set. To represent the data analysis, we create a separate menu option for data analysis with seven buttons representing the Data file, Discrete file, Feature selection, Rules generation and Tuneling, Multi Classification, Performance Measures, Exit.
In Data file button we have the bank loan data base as a data set that gets executed in command window. Automatically, at the end of data set we get Go to Discrete file. After the Discrete file button is selected we can find the data that has been separated and shown in the command window.
When the feature selection button has been selected we get a graph and its corresponding feature selection has been represented in a separate graph format as a figure. The Rules Generation and Tuneling is a set of rules that represents the account transaction, their accuracy, etc. Multi classification gives the exact accuracy that has been obtained with the particular data set.
their comparison by using the three measures such as accuracy, sensitivity, specificity.
III.
RESULT
IV. CONCLUSION
Thus the study of comparison between Bat Algorithm, Particle Swarm Optimization (PSO), Grey Wolf Optimization (GWO) for user’s bank loan and their related due history has been simulated using the MATLAB simulator and the corresponding results have been obtained.
In the comparison of these three optimization algorithms, Grey Wolf Optimization (GWO) algorithm is considered as the best optimization algorithm and it can also be modified with the improved diversification process to overcome the
local optima stuck. Later, the Modified Grey Wolf Optimization (MODGWO) algorithm has been applied to many applications that solve those problems for a better and efficient performance.
V.
Future Work
Later, the proposed algorithm is compared with the existing standard optimization algorithms to prove its efficiency. Thus the users bank loan related history and their current balance i.e., remaining amount to be remitted to the bank has been found. In the comparison of these three optimization algorithms,
the Grey Wolf Optimization (GWO)
algorithm is considered as the best optimization algorithm. Later, the Modified grey wolf optimization algorithm has been applied to solve the users bank loan related history and their current balance for a better and efficient performance.
VI. REFERENCES
1. Hong Hanh Le, Jean-Laurent Viviani Research in International Business and Finance 44 (2018) 16–25 Predicting bank failure: An improvement by implementing a machine-learning approach to classical financial ratios
2. Adya, M., Collopy, F., 1998. How effective are neural networks at forecasting and prediction?: A review and evaluation. Int. J. Forecast. 17 (5– 6), 488–495.
3. Aktas, R., Doganay, M., Yildiz, B., 2003. Predicting the financial failure: a comparison of statistical methods and neural networks. Ankara Univ. J. SBF 58, 1–24.
4. Altman, E.I., 1968. Financial ratios: discriminant analysis and the prediction of corporate bankruptcy. J. Finance 23, 589–609.
6. Bell, T.B., 1997. Neural nets or logit model?: A comparison of each model’s ability to predict commercial bank failures. Int. J. Intell. Syst. Account. Finance Manag. 6,249–264.
7. Boser, B.E., Guyon, I., Vapnik, V.N., 1992. A training algorithm for optimal margin classifiers. In: Pittsburgh, ACM. Proceedings of the Fifth Annual Workshop of Computational Learning Theory 5. pp. 144–152.
8. Boyacioglu, M.A., Kara, Y., Baykan, O.K., 2009. Predicting bank financial failures using neural networks, support vector machines and multivariate statistical methods: a comparative analysis in the sample of savings deposit insurance fund (SDIF) transferred banks in Turkey. Expert Syst. Appl. 36, 3355–3366. 9. Canbas, S., Cabuk, A., Kilic, S.B., 2005.
Prediction of commercial bank failure via multivariate statistical analysis of financial structures: the Turkish case. Eur. J. Oper. Res. 166, 528–546.
10. Chiaramonte, L., Croci, E., Poli, F., 2015. Should we trust the Z-score? Evidence from the european banking industry. Global Finance J. 28, 111–131.
11. Demyanyk, Y., Hasan, I., 2010. Financial crises and bank failures: a review of prediction methods. Omega 38, 315–324.
12. Fethi, M.D., Pasiouras, F., 2009. Assessing Bank Performance with Operational Research and Artificial Intelligence Techniques: A Survey. University of Bath School of Management visualization and prediction using neural networks: a study of U.S. commercial banks. Expert Syst. Appl. 42, 2857–2869.
15. Lantz, B., 2013. Machine Learning with R. Packt Publishing Ltd.
16. Lee, S., Choi, W.S., 2013. A multi-industry bankruptcy prediction model using back-propagation neural network and multivariate discriminant analysis. Expert Syst. Appl. 40, 2941–2946.
17. Lee, K., Booth, D., Alam, P., 2005. A comparison of supervised and unsupervised neural networks in predicting bankruptcy of Korean firms. Expert Syst. Appl. 29, 1–16.
18. Lo, A.W., 1986. Logit versus discriminant analysis. a specification test and application to corporate bankruptcies. J. Econometr. 31 (2), 151–178.
19. Martínez, I., 1996. Forecasting company failure: neural approach versus discriminant analysis: an application to Spanish insurance companies. In: Sierra Molina, G.,Bonsón Ponte, E. (Eds.), Intelligent Systems in Accounting and Finance, pp. 169–185 Huelva.
20. Martin, D., 1977. Early warning of bank failure: a logit regression approach. J. Bank. Finance 1 (3), 249–276.
21. Min, J.H., Lee, Y.C., 2005. Bankruptcy prediction using support vector machine with optimal choice of kernel function parameters. Expert Syst. Appl. 28, 603–614.
22. Mitchell, T.M., 1997. Machine Learning. McGraw-Hill.
23. Ohlson, J.A., 1980. Financial ratios and the probabilistic prediction of bankruptcy. J. Account. Res. 18, 109–131
Proceedings, IEEE international conference on; 1995. p. 1942–1948
27. Mirjalili SM, Mirjalili S. Light property and optical buffer performance enhancement using Particle Swarm Optimization in Oblique Ring-Shape-Hole Photonic Crystal Waveguide. In: Photonics global conference (PGC);2012. p. 1–4 [2012].
28. Mirjalili SM, Abedi K, Mirjalili S. Optical buffer performance enhancement using Particle Swarm Optimization in Ring-Shape-Hole Photonic Crystal Waveguide. Optik – Int J Light Elect Optics 2013;124:5989–93.
29. Mirjalili SM, Mirjalili S, Lewis A. A novel multi-objective optimization framework for designing photonic crystal waveguides. Photonics Technol Lett IEEE 2014;26:146–9.
30. Mirjalili SM, Mirjalili S, Lewis A, Abedi K. A tri-objective particle swarm optimizer for designing
line defect photonic crystal
waveguides.Photonics and Nanostructures – Fundamentals and Applications.
31. Wu J, Li Y, Peng C, Wang Z. Wideband and low dispersion slow light in slotted photonic crystal waveguide. Optics Commun 2010;283:2815–9. 32. Caer C, Le Roux X, Marris - Morini D, Izard N,
Vivien L, Gao D, et al. Dispersion engineering of wide slot photonic crystal waveguides by Bragg-like corrugation of the slot. Photonics Technol Lett, IEEE 2011;23:1298–300.
33. Muro C, Escobedo R, Spector L, Coppinger R. Wolf-pack (Canis lupus) hunting strategies emerge from simple rules in computational simulations. Behav Process 2011;88:192–7. 34. Mech LD. Alpha status, dominance, and division