Comparative Analysis of Distributed Adaptive Opportunistic
Routing and Extremely Opportunistic Routing (Exor) in
Mobile Ad Hoc Network
P. Balamurugan1, Dr.S.Dhanalakshmi2
1Research Scholar, Periyar University, Salem, India
2Professor, Department of Computer Science, Vivekanandha College of Arts and Science for Women
(Autonomous), Tiruchengode, India
ABSTRACT
Opportunistic routing is a new standard protocol in routing process for performing with wireless sensor network. Opportunistic routing has essentially boosted the efficiency, transmission reliability of sensor networks, and network throughput by taking benefit of the broadcast nature of the wireless sensor networks. Opportunistic routing has attracted in recent times to pay more attention as it is regarded as a promising direction for enhancing the performance of the wireless sensor networks and wireless ad hoc networks. By way of opportunistic routing, it chooses only the node closest to the target node for forwarding the packet and intermediate nodes collaborate on packet forwarding in a consistent and localized manner. From this paper, an extremely opportunistic routing scheme and distributed adaptive opportunistic routing scheme for utilizing multi-hop wireless ad-hoc networks is clarified in detail manner.
Keywords: Distributed Adaptive Opportunistic Routing (d-AdaptOR), Extremely Opportunistic Routing (ExOR),Packet Ratio and formation, Traffic Rate, Transmission Delay
I.
INTRODUCTIONA Mobile Ad hoc Network is considered as a wireless communication network, wherever the nodes are not communicated within range of direct transmission of each other that needs the intermediate nodes to forward data. In which a networking paradigm begin from the needs in emergence operations, disaster relief operations, search and rescue, and battle field communications. It has infrastructure less, maintains mobile users, and reduces under the group of using multi-hop wireless networking. The two most significant operations are performed at the network layer, there are routing and data forwarding, are considered as distinct concepts. Routing decides the path way to allow a data packet must determine to follow from the source node to the target node and it
grants forwarding date with control inputs. Data forwarding controls how packets are must taken and handled from one link to another link. The opportunistic routing defeats the negative aspect of unreliable wireless transmission through broadcasting one transmission that can be overheard by multiple neighbors. MANET is to make wireless links as better as wired ones, so as to developments in the field of routing. Opportunistic routing enhances network throughput rate and the transmission reliability of networks.
Opportunistic routing includes a candidate set that has a group of nodes selected while the next-hop forwarders, if any of the candidates of a node is already received from the transmitted packet that may forward it again. The next forwarder is completed the decision of choosing via coordination between candidates and successfully received the transmitted packet. Only one of the node is very close to the target destination to perform and to handle the forwarding data as the rest can just drop the packet when they have successfully received it. Hence, opportunistic routing acquires several benefits, up till now unreliable wireless links in the network while they actually received. In Opportunistic Routing, the transmission reliability of sensor networks and network throughput rate know how to be automatically increased by using a dynamic relay node to forward the packet. For example, Opportunistic routing includes distributed adaptive opportunistic routing (d-AdaptOR)[1], geographic forwarding opportunistic routing (GeRaf)[2], Extremely Opportunistic Routing (ExOR) [3], etc.
II.
EXOR PROTOCOLExOR is an opportunistic routing protocol that has been increased for multi hop wireless networks [6]. This routing protocol combines the routing and MAC protocols; however, whole packets are broadcasted at the network layer. The routing performance is developed by using the dynamic approach and opportunistic routing for selection of the links, if the links routed on the default path be converted into between the nodes or it can be distance between the
nodes. The forwarding lists of the source nodes have only all nodes that are much close to the target destination while compared the distance between the destination node and source node. Each and every packet should be performed with marking packets which have been received by the nodes with higher priorities or the sending node. A forwarder use in a have the stored fragments of the group will require to schedule their transmissions. For the reason that, each forwarder in the list by performing with a forwarding timer which ExOR is set to five packet durations times of the number of higher priority nodes in the forwarder list. An estimation of the time taken in which node should start forwarding packets from its queue. After that process each schedule cycle the batch maps require to be updated by means that of negative acknowledgments, if the destination has received ninety percent of the batch of packets. The rest of the packets are transmitted by using traditional routing because the overhead would be forbidding otherwise. The most essential aspect of this scheme is centralized scheduling process and coordination between the destination and the forwarders. Finally, results state is in high overhead if the set of packets to transmit is small because of short lived flows and burst, otherwise the number of candidate forwarders is large [7].
A. Design
forwarding is performed in rare case. Secondly, the nodes receive a packet, after that the node “closest” to the destination must be the one that forwards the packet. Therefore, ExOR should have a metric reflecting probably cost of moving a packet from each node to the destination. Thirdly, there is a penalty of using too numerous nodes as potential forwarders in a large dense of the network, given that the costs of agreement develop with the number of participants. Consequently, ExOR should select only the most helpful nodes as participants. Finally, ExOR should avoid concurrent transmissions by using different nodes, to reduce collisions occurrence. The highest priority forwarder broadcasts the packets in its buffer storage and that transmissions are known the node's fragment of the batch. A copy of each packet includes the sender's batch map; the sender's guess of the highest priority node to contain received each packet in the batch. In order to transmit the remaining forwarders, transmitting only if the packets are not acknowledged within the batch maps of higher priority nodes. The forwarders persist cycle through the priority list until the destination has received 90% of the packets and then the remaining packets are transmitted by way of traditional routing technique.
B. Node State
ExOR nodes preserve secrecy state for each batch of packets while participating as specified the node‟s presence in the batch‟s forwarder list. Following steps clearly explain how the packet transmission done in an accurate manner.
Packet buffer: It stores the current batch of received packets in a success manner.
Local forwarder list: It contains high-prioritized list of nodes and then copied from one of the packets within the packet buffer. Afterward, all the nodes operate the same forwarder list, at first produced by the source.
Forwarding timer: The node pre-sets the timer far enough to provide higher-prioritized nodes
sufficient time to transmit and the node regulates the timer, if it hears other nodes‟ packets.
Transmission tracker: The tracker mechanism records the measured rate as a result of which the currently transmitting node transfers; all along with the expected number of packets left to transmit. The node utilizes this information to regulate the forwarding timer.
Batch map: It specifies each packet in a batch, the highest-priority node recognized to contain the received copy of that packet.
C. Packet Format
ExOR packet header format demonstrates in figure 1. The Ethernet header is followed by the ExOR header, and that has followed by the packet‟s data. Whole the ExOR packets are broadcasts and they verified and showed the current version of ExOR. Both the Payload Length and Header length fields are mentioned the size of the ExOR header and payload respectively.
Figure 1. ExOR packet header format.
Ethernet Header
Ver HdrLen PalyloadLen
Batch ID
PktNum BatchSz FragNum
FragSz
FwdListSize
ForwarderNum
Forwarder List
Batch Map
Check sum
The BatchID field point out the packet belongs to which batch and it represents the current packet‟s offset in the same batch or not. Accordingly, the batch map entry for the packet corresponds to offset [9]. The total number of packets in the batch indicates by using the BatchSz. The size of the currently node‟s fragment (in packets) specifies by FragSz. FragNum represents the current packet‟s offset within the fragment. The FwdList-Size field specifies the number of forwarders in the list, and the Forwarder Num is the current sender‟s offset within the list. The source and destination are specified within the forwarder list. The Batch Map is a copy of the transmitting node‟s batch map so as to reduce space; each entry is considered as an index to the Forwarder List before refer as a full IP address.
D. Batch Preparation
The source selects a unique batch ID and then chooses a forwarder list. In Batch Preparation, the source starts with a batch of packets all perceptive to the same host. An ExOR header to each packet of the batch pretends using the source, which includes the forwarder list and batch ID. The source has received each packet only if the batch map indicates within each header. The source point out how many packets are transmitted within both the FragSz and BatchSz fields. At last, each packet in the batch broadcasts by using the source.
E. Forwarder List
The source indicates the forwarder list in the highest-priority order which depends upon the expected cost of dispatching a packet from the node to the destination in an effective manner. The cost metric is defined as the number of transmissions that needed to transmit a packet all along to select the best traditional route from the source node to the destination; both hops and retransmissions have been counted. This metric is same as like ETX [4], but differ in which ExOR applies only if the forward delivery probability case. To calculate ETX values,
ExOR exploits knowledge of the complete set of contains the node, the node automatically attaches the packet to the packet buffer in support of the corresponding batch. The packet batch maps perform as a gossip mechanism, carrying packet reception information from high priority to lower priority nodes. Therefore, a lowest priority node is improbable to forward a packet with the intention of the packet received already from a higher priority node.
G. Scheduling Transmissions
III.
d-ADAPTOREarlier than continue with the explanation of d-AdaptOR and provide the following notations. Let Ϭi
denote the set of potential reception outcomes due to a transmission from node i € Ɵ, i.e. Ϭi = {S : S ≤ N(i), i
€ S}. Let N(i) denote the set of neighbors of node i including node itself. Refer to Ϭi as the state space for
node i‟s transmission. Moreover, let Ϭ = U i € ƟϬi. Let
A(S) = S U {T} denote the space of all permissible actions available to node i upon successful reception at nodes in S. Lastly, for each node i define a reward function on states S € Ϭi and potential decisions a €
A(S) as,
-ca if a € S
g (S,a) = R if a= T and d € S 0 if a = T but d S
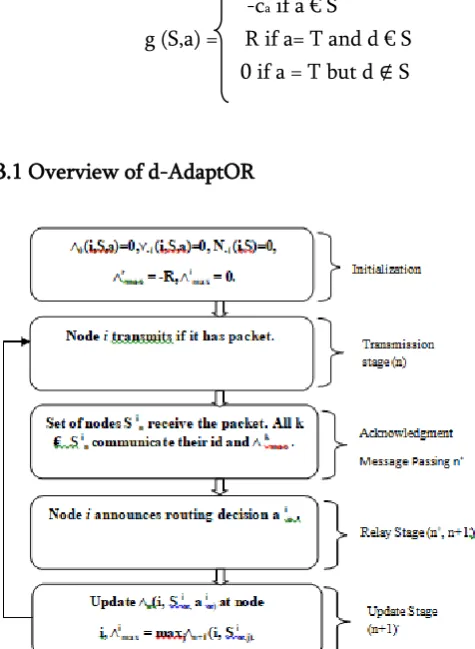
3.1 Overview of d-AdaptOR
Figure 2. Flow of the algorithm.
As earlier discussion, the routing decision at all time is completely depending on the reception out come. It involves selecting the next relay, retransmission or
termination. This decisions scheme perform in a distributed manner by the use of the following three-way handshake between neighbors N(i) and its node i.
At time n node i transmit a packet.
The set of nodes Sin who have successfully received the packet from node i, transmit acknowledgement (ACK) packets to node i. Here, acknowledgement packet of node k € Sin
includes a control message called as estimated best score (EBS) and denoted by kmax.
Node i announce node j € Sin as the next transmitter or announce the termination decision T in a forwarding (FO) packet.
The routing decision of node i at time n depend upon an adaptive (stored) score vector n(i,.,.). The score
vector n(i,.,.) lies in space vi , where vi =
∑ ( ) , and is updated by node using the EBS
messages kmax obtained from neighbors k € Sin . Furthermore, node i uses a set of counting variables
n(i,S,a) and Nn(i,S) and a sequence of positive scalars
{ n}∞ n=1 to update its score vector at time n. The
counting variable n(i,S,a) evaluates equal to the
number of times neighbors S have received (and acknowledged) the packets transmitted from node i and routing decision a € A(S) has been made up to time n. In the same way, Nn(i,S) is equal to the
number of times that a set of nodes S have received (and acknowledged) packets transmitted from node i up to time n. Lastly, { n}∞ n=1 is a fixed sequence of
numbers available at all nodes. Table 1 provides the notations applied in the description of the algorithm, whereas Figure 2 provides an outline of the components of the algorithm.
3.2.Detailed description of d-AdaptOR
the start of nth slot and (n + 1) - to denote some (small)
time before the end of nth slot such that n < n+ < (n +
1) - < n + 1.
Initialization:
For all i €
Ɵ
, S €
Ϭ
i, a € A(S), initialize
0
(i, S, a) =
-1
(i, S, a) = N
-1(i, S)=0,
imax= 0,
while
Tmax
= -R.
Table 1. Notations used in the description of the
algorithm
Symbol Definition
Sin Nodes receiving the transmission
from node i at time n
ain Decision taken by node i at time n
A(S) Set of variable actions when nodes in S receive a packet
N(i) Neighbors of node I including node i
g(S,a) Reward obtained by taking decision a when the set A of nodes receive a packet
(i, S, a) Number of times up to time n, nodes S have received a packet from node I and decision a is taken Nn(i, S) Number of times up to time n, node
S have received a packet from node i
(i, S, a) Score for node I at time n, when nodes S have received the packet and decision a is taken
Estimated best score for node i
Transmission Stage: In this stage occurs at any time n wherein node i transmit if it has a packet.
Reception and acknowledgement Stage: In the reception and acknowledgement stage, successful reception of the packet transmitted by node i is acknowledged by all the nodes in Sin. Let Sin denote the (random) set of nodes that have received the packet transmitted by node i.
Assume that the delay for the acknowledgement stage is small enough (not more than the duration of the time slot) such that node i infers Sin by time n+.
In support of all nodes k € Sin, the ACK packet of node k to node i includes the EBS message kmax. The
counting random variable Nn is incremented depend
upon acknowledgement and reception as follows:
Nn(i,S) = Nn-1(i,S) + 1 if S = Sin
Nn 1(i,S)
if S Sin
Relay Stage: Node i chooses a routing action ain
A (Sin) corresponding to the following (randomized) rule parameterized by n (i ,S) =
( ) :
With probability (1- n (i ,S)),
ain ( ) ( )
is selected,
With probability n (i , Sin )
ain A (Sin)
is selected uniformly with probability,
( ) .
Node i broadcasts FO, a control packet that contains information about routing decision ai n at some time strictly between n+ and (n + 1)-. If ain T, then node
ain prepares for forwarding in next time slot, while nodes j Sin , j ain remove the packet. When termination action is selected, i.e. ain = T, all nodes in Sin expunge the packet.
Furthermore, the counting variable n is updated
depend upon selection of a routing action.
n(i,S) = n-1(i,S, a) + 1
if (S, a) = ( Sin, ain)
n-1(i,S, a)
Adaptive Computation Stage: On time (n+1)-,
after being done the process with transmission and relaying, node i updates score vector n(i, .,
.) as follows:
For all S = Sin , a = ain ,
n+1 (i, S ,a) = n (i, S ,a) + (i, S ,a)
( - n (i, S ,a) + g (S , a) + ) ,
Otherwise,
n+1 (i, S ,a) = n (i, S ,a).
Moreover, node i updates current EBS message
for future acknowledgements and reception as:
( ) ( ).
IV.
EXPERIMENT RESULTSIn this simulation process, both the EXOR and d-AdaptOR compare with the performance of an OR policy (with the ETX metric) respect to the network parameters and design parameters within a grid topology. Projected technique simulates by using NS2 which is open source and also for adding new protocol. NS2 is helpful to use different kinds of research groups to suggest new protocols within the area of wireless networks and it supports to analyze and incorporate between the new routing protocols. For simulation process within support of substantial NS provides routing technique, TCP and multicast protocols over wireless and wired networks. In support of networking research work, Network simulator (NS) is considered as an object–oriented simulator and discrete event simulator. As a result of the simulator is an ongoing endeavor of research work enlarged and developed. NS is not responsible for a polished product other than allow the bugs are being find out and corrected continuously in an accurate manner. NS is written by using OTcl interpreter and C++ as a configuration and command interface. The OTcl part runs very slower compare than C++ but, it can be rapidly modified for
performing simulation configuration. Alternatively, the C++ part runs fast manner but, ii can be modified slower to change, for utilizing detailed protocol implementation.
As the packet length differs from 512 to 1024 bytes by using simulation result performance. The packet size is increased by the expected routing cost per packet and decreased the packet transmission reliability. But, d-AdaptOR optimality result does not based on the packet length.
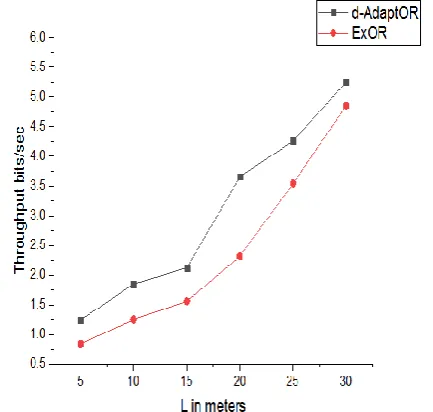
In Average Hop Length L, the two OR algorithms (d-AdaptOR and ExOR) are utilized with the expected transmission cost as the distance between the neighboring nodes in the grid topology. Measurements of the L meters differ from 10 meters to 30 meters. For high values of L, the receiver diversity is low because the retransmission packet losses providing nearly related performance for candidate protocols, at the same time as small L communicates with a network and then gain large receiver diversity. A significant improvement over conventional routing provide by the entire opportunistic routing schemes during if the L is small, other than what is more exciting is the performance increase of learning-based d-AdaptOR above the greedy-based solutions in medium ranges.
Figure 3. Node topology
In a 200 × 300 feet square region,- 10 feet of transmission range organize 9 wireless nodes, after that source-destination pair to be maximally and diagonally divided from each other in a perfect manner. L is selected to be 5 meters distance and neighbors are divided by distance L m; Let source node denotes S to destination node denotes D within a wireless ad hoc network is selected at the maximal distance. The entire packets are transmitted with the 802.11b one megabit/second bitrates. Packets are produced in accordance with a constant bit rate (CBR) source with rate 40 packets/sec. Assume that the length of 512 bytes equipped with uncomplicated CRC error detection. The pause time is 6 seconds and node speed is 6 m/s. Power level of transmission is 200m and transmission cost is assumed with one unit, at the same time as reward for effectively delivering a packet to the destination is assumed to be 20.
Throughput:
The total amount of bytes is transmitted over a specific time with the reference of throughput. To measure network performance using throughput is a benchmark criterion required. Both ExOR and d-AdaptOR routing protocols are compared with the QoS parameter throughput for ad hoc wireless networks and comparison results are demonstrates in figures 2. The throughput of d-AdaptOR is consistently processed compare than experimental results from a 9 wireless nodes tested the existing adaptive routing algorithm (ExOR). The throughput of the network illustrates in figure 2 and also
performs the biggest factor of network performance. The number of packets are received and transmitted based on the lifetime performance of the network and also delay while transferring the packets from source station to base station.
Figure 4. Throughput comparisons for d-AdaptOR and EXOR
In a wireless network, ExOR performs dynamically choose several paths during a per transmission basis. A Cost metric is to transmit a packet on per transmission basis from source to destination with the support of EXOR. The path discovers between the source and the destination by using the cost metric ETX with superior throughput. Under ExOR performance, all packets are constantly routed “shortest path” to the destination place that results within high delay under heavy traffic scenarios. The main benefit of ExOR's throughput differs with the set of nodes connected between the source and destination. The results point out OR schemes normally perform better.
Transmission Time Varying Cost:
We assume that the transmission costs are fixed during our analytical setup. A network performs in which nodes may perhaps go into an energy saving mode after that they do not participate in routing
7 8 9
4 5 6
1 2 3
L
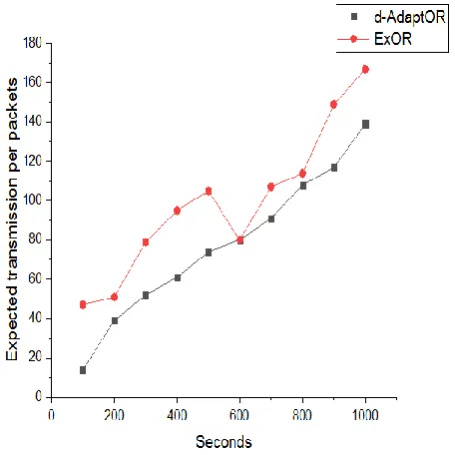
process (example: to recharge energy sources). Next step, we converse a trouble-free scenario where the nodes have time varying transmission costs. A node publicizes a high cost of transmission while assume that they entering into the energy saving mode (100 instead of transmission cost of 1). If two nodes perform at the center of the grid transmit into an energy saving mode by using d-AdaptOR. The expected average cost of d-AdaptOR illustrate in figure 3 track the genie aided solution after that all nodes shift into the energy saving mode. The entire nodes state is going into sleep mode at time 600 seconds.
Figure 5. Time varying cost
Transmission Traffic rate:
CBR rate versus number of transmissions for opportunity algorithms are clearly explained in figure 4. Although the performances increases or decreases for d-AdaptOR in the load, if there is constantly a non-negligible benefit more than other solutions.
Figure 6. Performance of d-AdaptOR as CBR traffic is varied.
d-AdaptOR schemes perform better than to the conventional routing and it provide the network high diversity. Thus, the values are computed to visualize the simulation results graphically using „Gnuplot‟. For depicting the scientific data, an interactive data plotting program is mainly intended. This routing technique improves the end-to-end or uninterrupted throughput and efficiently utilizes resources.
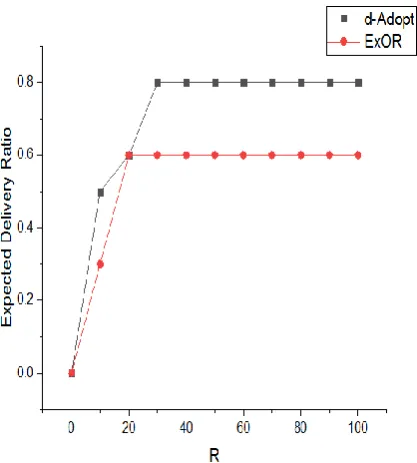
Packet Delivery Ratio:
Proportionally, the packet delivery ratio is directly performed with the number of packets take delivery by the destination to transmit the number of packets by the source.
Packet Delivery Ratio = ∑ packets delivered by destination / ∑ packets send by source
(OR) PDR= S1÷ S2
respect to R that have plotted the variation in the performance. The expected delivery cost and delivery ratio of d- AdaptOR as R increases from 10 to 100: For small R, all the packets are nearly dropped as the cost of transmission of the packet and relaying is not worth the obtained delivery reward in figure 5 plot. But, as R increases away from a threshold R0 (example provided here, this threshold value is 10, other than in general that based on the network diameter), the delivery ratio remains fixed.
Figure 7. Packet Delivery ratio varied in R
V.
CONCLUSION
In recent times, the mobile ad hoc network has been utilized in several areas. At this point, the work focused on one of the routing technique called as Opportunistic Routing in the mobile ad hoc networks. From this paper, it provides overview of the opportunistic routing protocols and their transmission techniques and involves more benefits of the existing techniques. Simulation results show that d-adaptOR outperforms the ExOR protocols. In this simulation we also found that ExOR takes advantage of longer transmission distances to forward the packet but lossy links. Future work includes extending the d-adaptOR protocol and comprises
developing adaptive algorithms that ensure optimal growth of regret as a performance measure of interest..
VI. REFERENCES
[1]. C. Lott and D. Teneketzis, "Stochastic routing in ad hoc wireless networks," in Proc. 39th IEEE Conf. Decision Control, 2000, vol. 3, pp. 2302–2307, vol. 3.
[2]. M. Zorzi, R.R. Rao, Geographic Random Forwarding (GeRaF) for ad hoc and sensor networks: energy and latency performance, in IEEE Trans. on Mobile Computing, this issue. [3]. S. Biswas and R. Morris, "ExOR: Opportunistic
Multi-Hop Routing for Wireless Networks", in Proc. ACM Conference of the Special Interest Group on Data Com-munication (SIGCOMM), Philadelphia, PA, USA, Au-gust 2005, pp. 133144.
[4]. D. De Couto, D. Aguayo, J. Bicket, and R. Morris. A high-throughput path metric for multi-hop wireless routing. In Proc. ACM/IEEE MobiCom, September 2003.
[5]. Multihop Wireless Networks: Opportunistic Routing ,Dr Kai Zeng, Drwenjing Lou, Ming Li, Wiley July 2011.
[6]. C. L. Barrett, S. J. Eidenbenz, L. Kroc, M. Marathe, and J. P. Smith. Parametric probabilistic sensor network routing. In proc. ACM WSNA '03, doi 10.1145/ 941350.941368, 2003.
[7]. Probabilistic Routing in Wireless Ad hoc Networks by Vangelis Angelakis, Di Yuan and Niki Gazoni.
[8]. C. Cetinkaya and E. Knightly. Opportunistic traffic scheduling over multiple network paths. In Proc. IEEE Infocom. IEEE, September 2004. [9]. R. Roy Choudhury and N. Vaidya. MAC layer
[10]. J. Boyan and M. Littman, "Packet routing in dynamically changing networks: A reinforcement learning approach," in Proc. NIPS, 1994,pp. 671–678.
[11]. J. W. Bates, "Packet routing and reinforcement learning: Estimating shortest paths in dynamic graphs," 1995, unpublished.
AUTHORS PROFILES
P. Balamurugan received his M.phil degree from Periyar University, Salem in the year 2008. He has received his M.Sc Computer Science degree from Bharathidasan University, Tiruchirapalli in the year 2003. He is working as an Assistant Professor, Department of Computer Science, Sengunthar Arts and Science College, Tiruchengode, Tamilnadu. He is pursuing his Ph.D degree at Periyar University Salem, Tamilnadu, India. His areas of interest include computer networks, Network security and cryptography.