Opportunities and limitations of using SOA concepts and
technologies for building BI applications
a Delphi Study
Author: Sefan Linders
Master: Business Information Technology
University of Twente
Committee: Dr. Roland M. Müller (University of Twente)
Dr. Luí s Ferreira Pires (University of Twente) Drs. Niels van der Zeyst (Capgemini Netherlands)
Annemarie Grote Gansey (Capgemini Netherlands)
Date: June 12, 2008
Preface
This thesis marks the end of my studies at the Twente University, where I have studied the past several years to receive both a bachelor and master degree in Business Information Technology. It also marks the end of my life as a student, a life that I have appreciated in many ways.
Service-Oriented Architecture and Business Intelligence, the two research areas that are at the basis of this thesis, were rather unknown concepts to me when I started working on this thesis. Over the past ten months, I have gained an considerable amount of knowledge on both of these research areas, and have tried my best to add some knowledge to the scientific community. During the process that led to this thesis, I have been supported and guided by several people who I would like to thank here.
First of all, I would like to express my gratitude to Roland Müller and Luís Ferreira Pires, both associated with the University of Twente. I have been blessed with their excellent guidance during the entire process, providing me with their insights and opinions whenever was in need. I truly believe they greatly improved the quality of my research.
The research has been carried out at Capgemini Netherlands, at the SAP Netweaver & Intelligence practice. Thanks goes out to my supervisor Niels van der Zeyst, with whom I have had many energetic discussions on the direction of my research, and who always found the energy to support me during my downs. I would also like to thank my second supervisor at Capgemini, Annemarie Grote Gansey, for her knowledgeable insights during our meetings, and her enduring faith in a successful completion of this research. I would also like to thank my practice manager Frank Wammes for inviting me to many joyful and interesting activities, where I’ve had the chance to meet many of my colleagues.
During my full stay at Capgemini, I have been very happy with the companionship of Chris Jager and Annemaaike Daniel, who started on their thesis about the same time as I did. Wonderful enough, we all managed to graduate in the same month! In my opinion, we have had many interesting and helpful discussions about our research, not in the least to help us manage our thesis frustrations. The less serious discussions might have helped even more. Chris, thanks for teaching me some of your advanced juggling skills. Annemaaike, thanks for pointing me –daily- on the awkward behavior of seagulls.
Apart from the people directly involved in the process of my thesis, I would like to thank my family and friends for their support and the many enjoying moments we shared in the past months. Special thanks goes out to my parents for their care, patience, and unwavering support.
Participating experts
I owe a debt of gratitude to all the experts who participated in the Delphi study, which was so important for this research. All input to the study, as well as all the other feedback I have received, have been deeply appreciated.
Thanks goes out to the following individuals, who each have participated in the Delphi study:
Michael Bienstein, Manager, Bearingpoint, France
Frans Tolen, Senior Managing Consultant, IBM Global Services, The Netherlands
Rik Laurens, Principal Consultant, SAP Architect, Capgemini, The Netherlands
Liya Wu, BI Architect, Hewlett Packard, United States
Richard Veryard, Industry Analist, CBDI, United Kingdom
Hans-J. Lenz, Professor, Free University Berlin, Germany
Oleg Figlin, Senior NetWeaver Solution Architect, SAP, United Kingdom
Rogier Poelmann, Managing BI Consultant, Capgemini, The Netherlands
Stephen Robson, BI Architect, Capgemini, Canada
Bill Baker, Software Development Manager, Microsoft, United States
Remy van der Kleij, Professional Services Consultant, Informatica, The Netherlands
Mike Bergman, Senior Sales Consultant, Business Objects - an SAP company, The Netherlands
Bert Oosterhof, Director of Technology EMEA, Informatica, The Netherlands
Pascal de Haan, Managing Consultant, Capgemini, The Netherlands
Jürgen Kress, SOA Partner Adoption EMEA, Oracle, Germany
Jack Esselink, Principal Solutions Specialist, Cognos – an IBM company, The Netherlands
Edwin Scheepstra, Data Warehouse Architect, Capgemini, The Netherlands
Maurice van Keulen, Assistant Professor, University of Twente, The Netherlands
Management Summary
Service-Oriented Architecture (SOA) is gaining increasing attention to improve the flexibility and agility of organizations. However, the current focus is mainly on supporting operational systems, not on supporting Business Intelligence (BI) systems. This thesis aims to identify potential benefits or challenges of using SOA for the organization and use of BI. The thesis is guided by the following research question:
“What are the opportunities and limitations of using SOA concepts and technologies for building BI applications?”
To answer this question, we first performed a literature study on the concepts and technologies of both BI and SOA. After that, we applied a Delphi study to a panel of experts in order to generate and discuss opportunities and limitations. In this study, we used models from our literature study for guidance of the experts.
The result of this Delphi study is a ranked list of opportunities and limitations, which include the arguments and comments from the experts. We have further investigated a small subset of these opportunities and limitations, by using the comments from the expert panel, having private interviews with some of our experts, and consulting additional literature.
Literature study on SOA and BI
We identified BI as the process of gathering and analyzing data, and using the produced information to steer the organization. The process consists of four phases, (1) planning and direction, (2) collection of data, (3) analysis of data, and (4) distribution of data. We also identified the areas of the organization for which BI delivers information, and what this information is about.
We defined SOA as an application architecture within which all applications logic is defined as services, which can be called in defined sequences to form business processes. We discussed how services interact and to what principles they should adhere. The main benefits that would justify the use of SOA are improved possibilities for both reuse and integration, which could result in increased agility and adaptability of the organization as a whole.
Opportunities
The majority of the opportunities that have been identified and rated correspond to the reuse and integration benefits that are also associated with SOA. Our main observations on the identified opportunities are as follows:
Reuse of services for the collection of data and distribution of information.
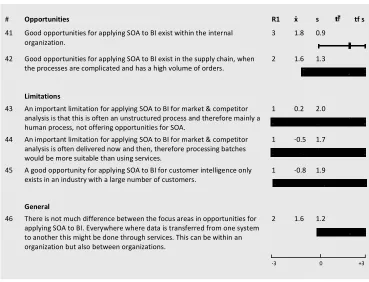
Integration with operational systems for the collection of data. SOA is perceived as offering capabilities for better integration of (operational) systems with the BI systems.
Integration with operational systems for the distribution of information, to improve the use of BI information in operational processes.
For the tactical and operational level more opportunities are identified than for the strategic level, probably because BI is most often used at these levels, and because they have a greater need for a flexible BI organization that can adapt to the more frequent changes at these levels. No
considerable differences in the value of opportunities for different focus areas have been identified.
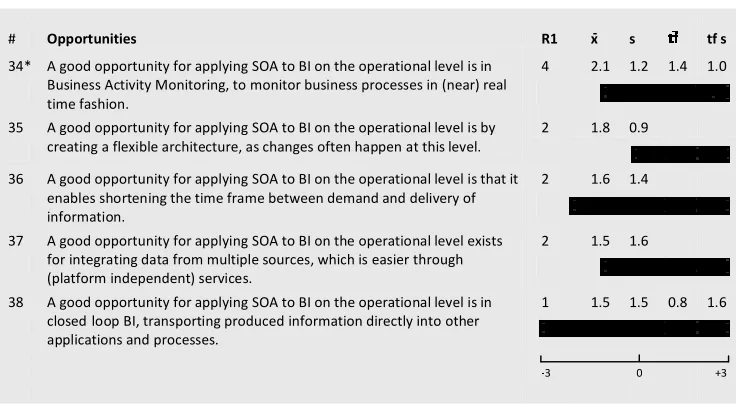
We have further investigated Business Activity Monitoring (BAM), which is one of the identified opportunities. BAM supports the steering of operational processes by providing real-time information on the current state of these processes. BAM systems need to collect data from various operational systems, and SOA provides the means for integrating these systems. Part of this support is found in event-based messaging, which enables real-time data collection.
We also further investigated Master Data Management (MDM). MDM serves to maintain a consistent definition of business entities throughout operational systems, and can also store the data of those entities in a central location. MDM can provide consistent and up-to-date data on entities to the BI system, and can improve the consistency of the data analyses. SOA is identified as a suitable delivery system to integrate the operational systems with the MDM system. Furthermore, transformation and cleansing services could be used to build the MDM system.
Limitations
The most serious and most discussed limitation in the Delphi study is the transportation of large data sets over web services. Large sets of data often need to be transported from the operational systems to the data warehouse, for the collection of data for BI. Web services, often employed for the exchange of rather small messages, currently do not seem suitable for transporting large data sets. Although event-based communication is regarded a possibility for using services for the collection of data, we have no knowledge of viable implementations of this concept.
Further research on handling large data sets in an SOA is needed to find viable approaches for realizing actual benefits of handling this data for the collection of data for BI.
Conclusion
Table of contents
2.2. Steering of organizations ... 5
2.3. BI-cycle ... 6
2.4. BI functions ... 6
2.5. Traditional BI Systems ... 8
2.6. Conclusion ... 9
3. Service Oriented Architecture ... 10
3.1. Definition ... 10
3.2. Services ... 11
3.3. Principles ... 12
3.4. Service Composition ... 13
3.5. Enterprise Service Bus ... 14
3.6. Web services ... 15
3.7. Benefits ... 15
3.8. Conclusion ... 17
4. Delphi Study ... 18
4.1. Basics ... 18
4.2. Suitability for this research ... 19
4.3. Expert selection ... 19
4.4. Communication Method ... 20
4.5. Data analysis ... 20
4.6. Conclusion ... 21
5. Rounds setup & participation statistics ... 22
5.1. Participating experts ... 22
5.2. First round setup & response ... 23
5.3. Second round setup & response ... 24
5.4. Third round setup & response ... 25
5.5. Conclusion ... 25
6. Results ... 26
6.1. General observations ... 26
6.2. BI-cycle ... 28
6.3. BI Functions model ... 33
6.4. Catch-all question ... 36
6.5. Further statistical analysis ... 37
7. Further investigation ... 44
7.1. Master Data Management ... 45
7.2. Large data sizes ... 49
7.3. Business Activity Monitoring ... 52
8. Final remarks ... 56
8.1. Conclusions ... 56
8.2. Recommendations ... 58
8.3. Limitations of the study ... 58
8.4. Directions for further research ... 59
References ... 60
Appendix A – Duncan’s MRT for separate categories ... 64
Appendix B – Significance difference means 2nd/3rd round ... 67
Appendix C - Stability Measurement ... 69
Appendix D - Correlation general rating and technical feasibility rating ... 70
Appendix E – Round 1 questionnaire ... 71
Appendix F – Round 2 questionnaire ... 79
Chapter 1: Introduction
1
Introduction
Companies experience an increasing need to obtain information about their internal organization and environment, for supporting the decision making processes necessary for steering the organization. Business Intelligence (BI) provides support for delivering this information, by gathering and analyzing data available in- and outside the organization. To retrieve the needed data, BI systems interact with the internal systems that provide operational information, the so-called operational systems.
In recent years, Service-Oriented Architecture (SOA) is gaining considerable attention in practice and research. The main promise of this architecture is increased flexibility and agility of the organization, while at the same time lowering the costs of IT. Although limited research on the actual realization of SOA and its promises has yet been performed, many organizations are currently adopting the concepts and technologies of SOA.
However, little is known in theory and practice about how SOA could support the organization and use of BI. Now that the diffusion of SOA into organizations is taking place, one could wonder if this presents potential benefits or challenges for the organization and use of BI systems, or if service-orientation principles can be smoothly applied to BI architectures as well.
This thesis aims at providing insight into the relation between SOA and BI, by identifying the opportunities and limitations of building BI applications using SOA concepts and technologies.
1.1
Objectives
The main goal of this thesis is to provide an overview of the opportunities and limitations for building BI applications using SOA concepts and technologies. An opportunity is defined as a concept or pattern that involves the use of SOA and can improve the organization (design, development, maintenance) and use of BI. A limitation is defined as a constraint of using SOA for the organization and use of BI.
Chapter 1: Introduction
1.2
Research problem
This thesis is guided by a main research question, which has been formulated as follows:
What are the opportunities and limitations of using SOA concepts and technologies for building BI applications?
To answer the main research question, a number of sub-questions have been formulated as follows:
1. What are the concepts and technologies of Business Intelligence?
BI has a broad perspective on the organization: information is produced for many different persons steering a part of the organization. Furthermore, the process of delivering BI consists of a number of steps. To classify the different areas of BI, the following questions are formulated:
a. What are the main steps of a BI process?
b. What are the different BI functions?
When describing new ways of organizing BI, we should analyze the traditional way of organizing BI first, to see how these can be replaced by or combined with new technologies and concepts. Therefore we have formulated the following question:
c. What constitutes the common architecture of traditional BI systems?
To gain insight in SOA, we have formulated the following questions:
2. What are the concepts and technologies of a Service-Oriented Architecture?
3. What are the benefits of using a Service-Oriented Architecture?
The main research question has been answered by answering the following questions:
4. Which opportunities exist for using SOA concepts and technologies for building BI applications?
5. Which limitations exist for using SOA concepts and technologies for building BI applications?
6. How do these opportunities and limitations rank in importance?
7. How can the opportunities be technically realized?
1.3
Scope
This research covers the whole BI area within an organization. However, we have limited the research to a technology perspective, and have not investigated organizational consequences of using SOA concepts and technologies.
1.4
Approach
The approach taken to answer the research questions is depicted by Figure 1. Research question 1 has been answered by performing several literature studies. For describing the BI concepts and technologies, the book “The organization of Business Intelligence” by Den Hamer (2005) has been guiding in this thesis. This book presents a BI function model and describes the main steps of the BI process. For details on the architecture of traditional BI systems, we have used Kimball & Ross (2002) and Inmon (2002), which focus on the architecture of BI systems.
Chapter 1: Introduction
Research questions 4-6 have been answered through empirical research. For identifying opportunities and limitations to build BI applications using SOA concepts and technologies, we have invited a number of experts that have knowledge of SOA and/or BI, to take place in a discussion panel. This panel of experts has been guided to propose and discuss opportunities and limitations for using SOA concepts and technologies for building BI applications. This discussion has been organized in the form of a Delphi study (Linstone & Turoff, 1975), which is a method for structuring a group discussion. The discussions have taken place through questionnaires. The preceding literature study provided us with appropriate models to guide the group discussion.
After completing the Delphi, we have selected two opportunities and one limitation for further investigation. The selection of these subjects has been based on the amount of input provided by the expert panel during the Delphi study, the amount of information available in literature, and our observation that these three subjects are related to several other identified opportunities. Our investigation of only these items implies that research question 7 has been answered only for a small subset of the total set of identified opportunities and limitations. Researching all of them would not have been feasible within the time frame of this research.
Literature study
The structure of this thesis reflects the order in which the research questions are formulated. The thesis is structured as follows:
Chapter 2 gives an overview of the concepts and technologies of Business Intelligence. The need for BI is described in the context of organizational steering. The BI process is described, the BI functions model is presented, and the architecture of traditional BI systems is described.
Chapter 3 presents an overview of the concepts and technologies of the Service-Oriented Architecture. The concept of a service is described, which is the basic component of an SOA. Furthermore we discuss how services are composed to support a business process, what benefits can be realized by adopting SOA, and the most popular set of technologies for implementing SOA.
Chapter 4 presents the details of the Delphi study, which we used to structure the group discussion between the experts. The chapter describes the Delphi study and its validity for this research, the basic criteria that apply to the selection of experts, and the statistical methods that have been employed.
Chapter 5 describes the process of the Delphi study as it has taken place. The goals, structure and general outcome of each Delphi round are also discussed.
Chapter 6 presents the results of the Delphi study. An overview is given of all identified opportunities and limitations, which are categorized according to the models that have been used throughout the study. Statistical analyses of the significance of the results of the study are also discussed.
Chapter 7 discusses a selection of the results in more detail. Two opportunities and one limitation are further investigated by consulting literature and a small number of interviews with some experts.
Chapter 2: Business Intelligence
2
Business Intelligence
Information is needed to gain insight in the state of an organization and the environment of an organization. The availability of the right information at the right time allows people in making decisions, to steer their organization in a proper way at the right time. Business Intelligence supports the information needs for steering organizations.
This chapter discusses Business Intelligence. Section 2.1 defines Business Intelligence. Section 2.2 discusses why information is important for steering organizations, and explains the support of BI to produce this information. Section 2.3 discusses the BI-cycle, which constitutes the main steps of the BI process. Section 2.4 introduces the BI functions, which cover the different kinds of information for different people of the organization. Section 2.5 presents the architecture of traditional BI systems, after which Section 2.6 presents the conclusion of this chapter.
2.1
Definition
In BI, information is produced by analyzing data, which is often stored in the operational systems of the organization. There is a clear distinction between data and information. Within the context of decision-making, we define data as raw, not interpreted facts that have no meaning in themselves. Information is produced when data is interpreted, by placing the data in a certain context, filtering it on relevancy, and correlating it with other data (Agnar & Nygard, 1995; Philips & Vriens, 1999; Den Hamer, 2005). For example, when a store manager needs an overview of the total sales per week over the last year, the data consists of all the individual customer transactions at the counter of that store. By analyzing all these transactions on their date and price, the information of total sales per week can be produced.
In most definitions, BI is seen as a process in which data is used to produce information (Philips, 2004). In this research, we use the following definition, based on the definition of Den Hamer (2005):
“Business Intelligence denotes the process, supported by corresponding facilities, of gathering and analyzing data, and using the produced information to steer the organization.”
Chapter 2: Business Intelligence
2.2
Steering of organizations
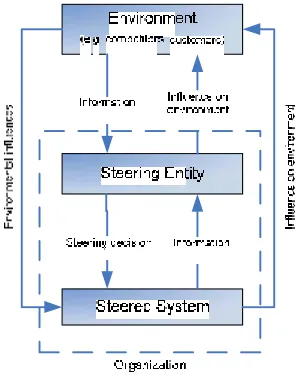
As BI is meant to deliver information, it is necessary to explain why information is so important for steering an organization. De Leeuw (1982) defines steering as any form of directed influence, like changing, educating, automating, motivating, and managing. Effective steering is required for an organization to properly adapt to the environment in which it operates. Figure 2 depicts a basic model of a steering situation, consisting of a steered system, a steering entity, and the environment. The steering entity and steered system are abstractions that can correspond to any steering situation in an organization. The steering entity receives information from the steered system and its environment, and influences the steered system by taking steering actions. While the environment can also directly influence the steered system, the steering entity, as well as the steered system, can influence the environment.
Figure 2: Steering of organizations (De Leeuw, 1982)
De Leeuw (1982) states the importance of information for effective steering. Among others, sufficient information concerning the state of the environment and the steered system is needed, because the need for changes should be identified, and because the future outcome of a steering action depends on the current state of the system and the environment. Also needed is sufficient information processing capacity to have the right information on time, namely before the steering action needs to be taken.
So, to be able to take the appropriate steering decisions at the right time, enough information processing capacity should be available. However, due to growing pressures of competition, the time to take steering actions is decreasing; organizations have to adapt increasingly faster to the changing environment. At the same time, the amount of data that needs to be processed is increasing, caused by the increasing amount of data that resides in the organization. Therefore, the needed information processing capacity is increasing. An information gap emerges as soon as this capacity is too low to deliver the required information at the right time (Den Hamer, 2005).
Chapter 2: Business Intelligence
2.3
BI-cycle
To produce information out of data, a number of steps need to be taken that apply to all different forms of BI. Several authors describe these steps in a BI-cycle (Figure 3), which consists of the main steps taken in the production of information (Bernhardt, 1994; Den Hamer, 2005; Philips & Vriens, 1999; Kahaner, 1996).
The cycle consists of four phases:
1. Planning and direction. The first phase consists of designing the whole cycle. First the needed information is determined, then the needed data to produce this information is identified (Philips & Vriens, 1999; Kahaner, 1996);
2. Collection of data. The second phase consists of identifying the needed sources of data, after which the data can be stored or distributed in a structured format that is suitable for analysis (Den Hamer, 2005). For example, when data is collected from multiple sources, the data needs to be converted to a common structure in order to be combined;
3. Analysis of data. In the third phase information is produced, by providing meaning to the data, e.g., by searching for patterns and connections in the data collection, and aggregating data (Den Hamer, 2005);
4. Distribution of information. In the fourth phase, the produced information is distributed to the right people or departments in the organization, presented in a suitable format (Philips & Vriens, 1999).
These four phases can be repeated continuously. In the first phase of each new cycle the success of the previous cycle can be evaluated, and taken into consideration when designing the new cycle. The planning and direction phase does not have to be repeated each time; phase 2-4 can be repeated over and over again, resulting in a continuous and automated process of collecting and analyzing data, and distributing the produced information. Some authors (Den Hamer, 2005; Bernhardt, 1994) mention only these last three phases in their BI-cycle, and ignore the planning and direction phase.
2.4
BI functions
There are many different situations in organizations in which decisions have to be made requiring different kinds of information in different formats. To structure the broad perspective on BI, we use the BI function model of Den Hamer (2005), which covers the generally known variations of BI. The model, which is depicted in Figure 4, aligns the BI functions to two axes: the
Chapter 2: Business Intelligence
The steering entity needs information on the state of the steered system, which can be any part of the internal organization or the environment, to support the decision making process. We discuss below the BI functions by describing the information they produce and deliver.
Competitors
Figure 4: BI Function Model (Den Hamer, 2005)
Internal BI,Corporate Performance Management, and Business Activity Monitoring are BI functions that focus on information about the internal organization. The currently most used function of BI is Internal BI, which can serve all organizational levels, but most often serves the tactical level, by providing management information for steering operational processes. This often happens on weekly or monthly basis. Business Activity Monitoring (BAM) provides (near) real-time information on the state of the operational process. This enables real-timely steering actions by the people controlling the operational process directly and informs higher management of the most current state of the operational processes. Corporate Performance Management (CPM) focuses on managing the performance of the organization as a whole, using performance measures that follow from the strategy, to monitor the performance of the whole company in the context of the strategy (Melchert et. al. 2004).
Customer Intelligence and Market Intelligence focus on information about (groups of) customers and markets respectively. This information supports decisions about the sales of products, customer retention and personalized marketing efforts. Market Intelligence focuses on providing information from a general market perspective, e.g., on certain customer groups, regions or market developments. Customer Intelligence, also known as analytical CRM, focuses on the individual customer, e.g., by developing a profile of each individual, slicing through all communication channels and products that binds the customer to the organization.
Competitive Intelligence and Strategic Intelligence focus mainly on information about the world outside the company, and is used in making strategic decisions. Competitive Intelligence informs about competitors and markets, and Strategic Intelligence extends this by providing multiple year overview on, e.g., macro-economic trends, technological developments, and government policies. Both BI functions serve to enable fast response on competitors, market developments, and social trends in the environment in which an organization operates.
Chapter 2: Business Intelligence
2.5
Traditional BI Systems
The data needed for producing information is often stored in several operational systems, which are transactional systems that are used by the operational business. Queries against these systems are often narrow, one-record-at-a-time queries that are part of the normal transaction flow. The operational systems generally maintain little historical data, and the data format and contents are often optimized for performing transactions (Kimball & Ross, 2002).
Thedata warehouse is often the heart of the BI infrastructure (Den Hamer, 2005). A data warehouse can be described as a database that contains the (historical) data of one or more operational systems or systems external to the organization, in which the combined data serves solely the analytical processes. In this section we further discuss the traditional setup of BI systems, which center around the data warehouse. Kimball & Ross (2002) describe the main components of a traditional BI system, which are the operational systems, the data staging area, the data presentation area, and the data access tools, as displayed in Figure 5. Each of these
components is discussed below.
Figure 5: Basic elements of a BI system (derived from Kimball & Ross, 2002)
The operational systems support the operational business, and consist of the applications and their databases. The main priorities of these systems are processing performance and availability for the operational business. Getting the data out of those systems for BI purposes should therefore not reduce the performance of these systems in case they are needed for transactional purposes by the business.
The data staging area consists of both a storage area and a set of processes that collect data from the operational systems and store it in a common format. These processes constitute three main steps, known as extract-transform-load (ETL): first data is extracted from the various operational source systems into the data staging area, then this data is transformed into a common format, after which the data can be combined, and finally, the data is loaded into the data presentation area.
Chapter 2: Business Intelligence
Figure 6: The Data presentation area - Inmon (2002) vs. Kimball & Ross (2002)
Data access tools are the applications that actually use the data that is in the presentation area to deliver the information for which the system is built. Examples of these are reporting tools, which process standardized reports, forecasting tools, which use the data to identify trends, or Online Analytical Processing (OLAP), which can quickly provide answers to analytical questions.
2.6
Conclusion
Chapter 3: Service Oriented Architecture
3 Service Oriented Architecture
Over the past four decades IT systems have grown exponentially, increasing the complexity of software architectures that companies have to manage. The software industry has gone through multiple computing architectures, resulting in reduced implementation time and increased integration possibilities (Channabasavaiah, 2004).
Service-Oriented Architecture (SOA) is currently promoted as the next step to support IT organizations to meet their increasing complex challenges (Channabasavaiah, 2004). Through applying service-orientation principles to the IT organization, the alignment of IT to the business can be improved, and the adaptability and agility of the organization as a whole can be improved. This chapter introduces the commonly identified concepts and technologies of SOA, and discusses its potential benefits for organizations.
In Section 3.1, we first discuss some common terminology used throughout this chapter. Section 3.2 discusses the concept of a service, which is the basic components of an SOA. In Section 3.3, the design principles of SOA are described. Section 3.4 discusses how application logic can be composed using services. Section 3.6 introduces web services, which consist of a collection of technologies popular for implementing an SOA. In Section 3.7, the benefits of SOA are discussed, and finally Section 3.8 contains the conclusion of this chapter.
3.1
Definition
The collective logic that defines and drives an organization is referred to by Erl (2005) as enterprise logic. Enterprise logic is an entity constantly changing in response to external and internal influences. From an IT perspective, this enterprise logic can be divided into business logic and application logic. According to Erl (2005), business logic is generally structured into processes that express requirements of the business, along with any associated constraints, dependencies, and outside influences. Application logic is an automated implementation of business logic into various technology solutions. Through purchased or custom-developed systems, the application logic supports the business processes within the constraints of technology and the organization.
Application logic is often divided into several applications. According to Pressman (2001), an application is a specifically designed set of elements of application logic, organized to reach a certain goal by processing information. Ideally such an application relates to a specific process or part of the organization.
Anapplication architecture is the standardized definition of a baseline application that can act as a template for other applications (Erl, 2005). It describes the technology, boundaries, rules,
Chapter 3: Service Oriented Architecture
SOA applies to application architecture, or to the collection of application architectures of an organization. Channabasavaiah et al. (2004) defines SOA as follows:
“SOA is an application architecture within which all application logic is defined as services, which can be called in defined sequences to form business processes”.
3.2
Services
An important feature of service-orientation, as stated by Erl (2005), is the approach for separating concerns, in the context of decomposing large problems into a collection of smaller, more manageable pieces. Each piece addresses a specific part of the larger problem. From an architectural perspective, this means that a system is decomposed into smaller units of logic. Within an SOA, these units of logic are known as services, and represent the basic components of the architecture.
Logic is decomposed into different services depending on its context (Erl, 2005). We take a business process as an example for which a system exists that consists of services. As displayed in Figure 7, each service can encapsulate the logic of an individual step of the business process, or of a sub-process comprised of a set of steps. A service can also encapsulate other services, forming one resulting service. By combining services, the whole business process can be supported by application logic.
Figure 7: Services can encapsulate varying amounts of logic (Erl, 2005)
Two key roles exist in every relation between services, which are the service requester and service provider (Colan, 2004b; Papazoglou, 2007a). By sending a message, the service requester invokes the service provider, who processes the request and responds by returning a message. To enable this interaction, services must be aware of each others’ characteristics. This awareness is achieved through the use of service descriptions (Erl, 2005; Colan, 2004b). Service descriptions contain information such as the service inputs, outputs, and associated semantics. To determine and locate the most suitable service provider to perform the function for the requester, a service broker can be used. A service broker is an intermediary between a service provider and a service requester, and maintains an index of available service providers, which includes information like their function, quality and location (Papazoglou 2007a, Colan 2004b). Figure 8 illustrates the relation between the service requester, provider, and broker.
Chapter 3: Service Oriented Architecture
3.3
Principles
Ranging from public IT organizations to vendors and consulting firms, there are many opinions about what constitutes an SOA. Although an official set of service-orientation principles does not exist (Erl, 2005, p290), there is a common set of principles that is most associated with service-orientation. These principles do not come automatically with the implementation of an SOA. Realization of these principles requires a conscious modeling and design effort (Erl, 2005). We describe the principles below.
Services are autonomous. The range of logic governed by a service exists within an explicit boundary. This allows the service to manage all its processing itself, and makes the service independent from other services. Service autonomy is a primary consideration when deciding how application logic should be divided up into services (Channabasavaiah et al., 2004; Erl, 2005).
Services hide underlying logic. The only part of a service that is visible to the outside world is what is exposed via the service definition. The internal structure of the service is invisible and irrelevant to service requesters. Components using the service should not know or care about the implementation logic of a service, but just want the expected result to be returned
(Channabasavaiah et al., 2004; Erl, 2005).
Services are loosely coupled. A service requester should be loosely coupled to a service provider. This means that the service requester has no knowledge of the technical details of the provider’s implementation, such as the programming language and the deployment platform. The loose coupling allows the internal structure of requester or provider components to change, without impacting the other, as long as the message format and semantics stay the same. Loose coupling is achieved through the use of service contracts that allow services to interact through messages rather than through the use of API’s or file formats (Erl, 2005; Colan, 2004a).
Services are self-contained. Service requesters require a persistent state between service invocations (the service is then stateful), but the service provider should not be required to maintain state information over a longer period of time. This means that service requests should consist of self-contained messages, with all the information the service provider needs to process a request (Erl 2005, p290; Colan 2004a, Papazoglou 2007a).
Chapter 3: Service Oriented Architecture
3.4
Service Composition
An important consideration in the design process is which services should be designed, and how these services should be composed to support a business process. In this section we discuss the details of this composition, guided by Figure 9, which depicts the relation between a business process and the automation logic of services.
Figure 9: Service orchestration (adapted from Erl (2005) and Channabasavaiah et. al. (2004))
3.4.1
Business process layer
Business logic is a documented implementation of the business requirements that originate from the business areas of an organization (Erl, 2005). Business logic is generally structured into processes that express these requirements. Figure 9 represents the abstraction of a business process layer, in which is a large piece of work is drawn as a composition of smaller units of work (Erl, 2005).
When using service-orientation to support parts of a business process with application logic, it is important to consider how the logic should be supported by different services, as this determines the autonomy of each service. In Section 3.3 we already discussed service autonomy as one of the main principles of service-orientation.
3.4.2
Service interface layer
Figure 9 also depicts the service interface layer, in which the composition of services with respect to a business process is illustrated. The composition can be organized through three layers:
The application service layer. Services in this layer serve to provide reusable functions that represent common enterprise resources and capabilities (Erl, 2005). For example, they can be used to expose functionality from legacy applications, or build services from scratch that provide new functionality.
The business service layer. Services in this layer provide functionality closely related to the business process they support. They can use the application services to implement their functions.
Chapter 3: Service Oriented Architecture
A benefit of abstracting business and automation logic of services in layers is that a loosely coupled relationship between the business and automation domain can be realized. This allows each domain to evolve independently and adapt to changes imposed by the other (Erl, 2005).
3.4.3
Organizational service-orientation
Some authors (Erl, 2005; Bieberstein et al., 2005; Cherbakov, 2005) argue that besides applying service-orientation to application logic, service-orientation should also be applied to
organizational structures. This would result in services in which core tasks and activities are considered as units of business services in which each business service has a unique purpose, and provides one or more services for consumption by other services (Bieberstein et al., 2005). Individual business services can then be orchestrated to form a business process (Bieberstein et al., 2005; Erl, 2005; Cherbakov, 2005).
When an organization consists of business processes composed out of business services, it becomes straightforward to support a business process by mapping its business services onto IT services. This can significantly improve the flexibility and agility with which processes can be remodeled (Erl, 2005).
Although some authors regard organizational service-orientation as a promising concept, in this work we do not further focus on this concept.
3.5
Enterprise Service Bus
To further support integration of services, a connectivity layer can be inserted between service requesters and service providers (Schmidt et al., 2005; Papazoglou 2007a). A version of such a layer often associated with SOA is the Enterprise Service Bus (ESB) (Papazoglou, 2007a). Papazoglou defines the ESB as follows:
“An ESB is an open-standards-based message backbone designed to enable the implementation, deployment, and management of SOA-based solutions.”
Papazoglou (2007a) further describes the ESB as a set of infrastructure capabilities implemented to enable an SOA and alleviate disparity problems between applications that run on heterogeneous platforms and use diverse data formats. The ESB promotes loose coupling of systems taking part in integration and can break up integration logic into distinct easily manageable pieces
(Papazoglou, 2007a).
The ESB functions as both transport and transformation facilitator to allow distribution of services over disparate systems and computing environments (Papazoglou, 2007b). When messages are transported from service requester to service provider (and vice versa), the ESB is responsible for routing the message to the designated service. The ESB can also provide functionality for the translation of messages to foster interoperability between services, or provide delivery through another protocol.
Chapter 3: Service Oriented Architecture
3.6
Web services
For implementing an SOA, a suitable technology is needed that can support the principles of service-orientation. A currently popular collection of technologies that provide this support is web services. However, web services is not a synonym of SOA. Other technologies can be employed as well for implementing an SOA (Channabasavaiah et al., 2004; Papazoglou, 2007a), which is illustrated by the existence of the term “service-oriented” in the software industry long before the introduction of web services (Erl, 2005). However, no technology has been more suitable and successful in manifesting SOA than web services (Erl, 2005; Colan, 2004b)
Web services are based on open standards that are independent from any implementation platform (Papazoglou, 2007a). All major vendor platforms currently support the creation of service-oriented solutions with the understanding that the SOA support provided is based on the use of web services (Erl, 2005).
The web services framework consists of a collection of technologies that apply to the use of services. Below, we introduce the technologies that support the basic SOA concepts we have mentioned earlier:
The basis for all web services technologies is the Extensible Markup Language (XML), which provides a standard for formatting messages (Moitra and Ganesh, 2005). XML documents are written in plain text, forming a common data representation that can be used as the medium for data exchange between systems from different implementation platforms (Moitra and Ganesh, 2005; Colan, 2004b).
The Simple Object Access Protocol (SOAP) is a protocol that defines the use of XML-formatted messages for communication between a service requester and service provider. The request is written in XML and transported in a SOAP envelope (Colan, 2004b).
Service definitions are written in the Web Services Description Language (WSDL). A WSDL document contains the details required by the service requester to use a particular service, like a description of the functionality it offers, how it communicates, and where it is accessible.
As mentioned in Section 3.2, a service broker can serve as an intermediary between the service requester and service provider, by keeping track of published services. The Universal Description, Discovery, and Integration (UDDI) registry is the web services implementation of a service broker.
Another web service technology often mentioned in relation to SOA, is the Web Services Business Process Execution Language (WS-BPEL) (Erl, 2005). WS-BPEL is an
orchestration language that serves to model business processes in terms of composition of web services.
To support event-based messaging, the ESB supports WS-Notification, providing support for publish/subscribe mechanisms (Papazoglou, 2007a).
3.7
Benefits
Several benefits are mentioned in literature that justify the use of SOA. This section discusses the commonly identified benefits.
3.7.1
Improved integration
Chapter 3: Service Oriented Architecture
any device, using any operating system, in any programming language, can access another service (Papazoglou, 2007a).
Using standards can therefore result in the creation of solutions that consist of inherently interoperable services. When application logic is represented by standardized services, creating interaction between them requires less effort since the communication proceeds using the same protocol. SOA can therefore significantly reduce the efforts of application integration over traditional methods (OASIS, 2006; Erl, 2005). The benefit of interoperability does not only apply to services that are built from scratch, but also applies to legacy systems. Functionality from these older systems can be exposed by wrapping their functions with standardized services, enabling further integration with other systems.
3.7.2
Reuse
Service-orientation promotes the design of reusable services. Creating a library of services that support reuse, provides increased opportunities for leveraging existing application logic (Erl, 2005; Papazoglou 2007a). When new application logic is built, the time for designing, developing, testing, and deploying the application can be reduced when the required logic is (partly) available in existing services, enabling composition of services, rather than developing all application logic from scratch (Channabasavaiah et al., 2004).
The principles that we discussed drive the opportunities for reuse of services. According to Erl (2005), the principles that should be applied to the design of services foster reuse in the following ways:
Autonomy and loose coupling of services results in independency of services, which broadens the applicability of its reusable functionality;
Self-containedness of services maximizes the availability of a service;
Hiding underlying logic fosters reuse, because service requesters are presented a generic public interface;
A well-defined service promotes reuse, because it allows (developers of) service requestors to search and discover reusable services.
3.7.3
Agility and adaptability
The agility of an organization represents the speed with which an organization can adapt itself to changes in the environment (Erl, 2005). The agility of an organization depends in part on the agility of the application logic that supports the business processes of the organization. Through the opportunities for both reuse and integration, SOA can increase the ability of the organization to cope with changes (Channabasavaiah et al., 2004). A standardized IT environment comprising composable, interoperable and reusable services establishes a more adaptive organization, in which automation solutions can be delivered faster, with less effort involved (Erl, 2005; OASIS, 2006). Therefore, cost reductions could be realized for building applications.
3.7.4
Validity of benefits
Chapter 3: Service Oriented Architecture
3.8
Conclusion
We defined SOA as an application architecture within which all applications logic is defined as services, which can be called in defined sequences to form business processes. Services take the role of either requester or provider, and can be defined at application or at business level. We discussed how services interact, and to what principles they should adhere. Enabling the implementation, deployment, and management of services is the Enterprise Service Bus (ESB). Currently, web services are the most popular technology for implementing an SOA. The main benefits that would justify the use of SOA are improved possibilities for both reuse and
Chapter 4: Delphi Study
4
Delphi Study
Now that both BI and SOA are introduced, we turn to the main research question which relates these two concepts: What are the opportunities and limitations of using SOA concepts and technologies for building BI applications?
As the previous chapters show, sufficient literature has been published on SOA and BI separately. However, literature on the relation between the two concepts is very limited, and the information that does exist is often restricted to vendor-specific products. Therefore we have decided to gain knowledge from people working with SOA and/or BI, who have the ability to provide us with valuable information on this subject. From now we refer to these people as experts. To collect and analyze information from the experts, we have identified the Delphi study (Linstone & Turoff, 1975) as the most suitable method.
This chapter discusses the Delphi study in general, and how we have designed a Delphi study that suited our resources and goals. In Section 4.1, we describe the basics of a Delphi study. In Section 4.2, we discuss the validity of using the Delphi study in our research. In Section 4.3, we discuss how we have selected our experts. In Section 4.4, we discuss the communication methods that we employed during the study. In Section 4.5, we discuss the statistical methods that we have applied in order to produce meaningful results. Finally, in Section 4.6, the conclusion is given.
4.1
Basics
A Delphi study enables experts to discuss a complex problem through a structured communication process (Linstone and Turoff, 1975). In this process, individual experts submit their ideas to the organizing researchers, defined as the monitor group, who collate the responses from the whole panel of experts into one overview. In turn, this overview is provided to the experts, who can revise their submitted ideas on basis of opinions of other experts. In the end, this process should produce the collective thought of the group (Linstone & Turoff, 1975). According to Scholl et al. (2004), a Delphi study lends itself especially well to exploratory theory building on complex, interdisciplinary issues, which often involve a number of new or future trends.
Chapter 4: Delphi Study
Monitor group Expert panel Monitor group
Expert panel Expert panel
Submit questionnaire to expert panel
Monitor group
Figure 10: Process of the Delphi study
Rowe and Wright (1999) have identified the four common characteristics of a Delphi study:
1. Anonymity of Delphi participants. This allows the experts to freely express their opinions without experiencing social pressures to conform with others in the group. Because of the anonymity of participants, the ideas proposed in a study are evaluated without a bias towards the participant that proposed the idea.
2. Iteration. This allows the participants to refine their views in light of the progress of the group’s work from round to round.
3. Controlled feedback. The participants are informed of the other participant’s perspectives, on basis of which they can clarify or change their views.
4. Statistical aggregation of group response. This allows for quantitative analysis and interpretation of data.
4.2
Suitability for this research
We already discussed the need for involving experts on SOA and/or BI to provide us with their ideas for opportunities and limitations of SOA concepts and technologies for building BI-applications. We have found the Delphi study as a very suitable approach to this empirical research, because of the interdisciplinary nature and new trends our research concerns. As we expected the participants of this research to have different opinions on the subject and to come up with a small set of different opportunities and limitations, the Delphi study provided us the means to share all these opportunities and limitations with the whole experts panel, and have the participants widen their scope and provide their opinion again. This resulted in an informative and educational process, in which the participants could learn from each other’s ideas and evaluate them as a group. By implementing a rating system in the questionnaires, which is common for a Delphi study (Skulmoski & Hartman, 2007), we were able to generate an overall ranking of opportunities and limitations, enabling us to select the ones regarded most important.
4.3
Expert selection
For composing the expert panel, the requirements for selecting experts as described by Adler & Ziglio (1996) have been considered. According to the authors, experts should have:
1. Knowledge of and experience with the issues under investigation;
2. The capacity and willingness to participate;
3. Sufficient time to participate, and
4. Effective communication skills.
Chapter 4: Delphi Study
Considering the other three requirements, all experts have been invited on a voluntary basis, which has led to the assumption that all participants had the capacity, willingness, and sufficient time to participate in the study. At the time of invitation, all experts were working for a company or research institute, where the nature of their work required them to communicate. Therefore we have assumed that each participant possessed the required communication skills for this study.
To generate a broad spectrum of opinions throughout the study, we have invited experts working from different perspectives on the relevant concepts and technology. The invited experts were either working for a consulting firm, for a research institute, for a BI-vendor, or for the client company of a consulting firm, that uses BI products in their organization.
For determining the needed panel size in order to produce valid results, we have studied previous articles on Delphi studies. As identified by Skulmoski & Hartman (2007) and Rowe and Wright (1999), there is a large difference in panel size from study to study. A common method for determining a suitable size has not been found. Therefore we have based our needed panel size on a comparable study. Akkermans et al. (2003) organized a Delphi study for identifying supply chain management issues, and the ERP support for these. The panel consisted of 23 experts on supply chain management. The authors reported that at least 20 participants were needed for this Delphi. Therefore we have tried to get at least 20 experts to participate in our study.
4.4
Communication Method
Two main alternatives exist for the setup of a Delphi study. In a real-time study, the experts are gathered in the same location at the same time, enabling a real-time communication process in which the whole study can be carried out in a limited time frame. In an asynchronous study, participants are sent a questionnaire individually, which they can answer at a location and time suitable for them. Our study has been organized as the latter, using the Internet for communication between the experts and the monitor group. This provided us with three advantages over a real-time study:
1. Enough experts could participate, as it would have been difficult to get the required number of participants together for a real-time Delphi study, because of high costs and time constraints involved.
2. Participants were not bound to any geographical region. This enabled us to invite experts from distant locations.
3. We could adjust new questionnaires as a function of the group response without major time constraints (Linstone and Turoff, 1975), because the next round would start when the design of the new questionnaire was finished. In a real-time study, there would be little time to analyze the results from the previous round to change the setup of the next one.
In the first round, in which qualitative answers have been given, the questionnaire was designed as a word processing document. In subsequent rounds, the questionnaire was designed as a
spreadsheet, which suited the quantitative questions and answers. The questionnaires have been sent and received by e-mail.
4.5
Data analysis
Chapter 4: Delphi Study
Another popular method for rating a list of items is by ranking them, so that the relative position of one item with respect to the others determines its importance (Scheibe et al., 1975). We have preferred the Likert scale over this method for two reasons. First, ranking a large list of items residing in different categories, which is the case in our study, requires quite some time from the experts. Second, rankings only measure importance of an item with respect to other items. If an item is important in itself may not be identified. In this study, however, this is important to know.
The quantitative group opinion is presented by the central tendency and level of dispersion of the ratings. A high level of dispersion characterizes a low level of consensus. In calculating these two measures, we have considered that Likert scales do not fall within the interval level, but the ordinal level of measurement. Some authors claim that calculating the means and standard deviation is illegitimate, since that would require interval data (Jamieson, 2004; Shields et al., 1987; Scheibe et al., 1975). Their advice is to use the median as the measure of central tendency, and the inter-quartile range as the level of dispersion. However, during our analysis we have experienced that many items have the exact same median and inter-quartile range values, making it impossible to distinguish among some of them, while there seems to be a difference in the ratings. Therefore we did use the mean and standard deviation for our statistical analysis, because they produce more precise results.
We have not found commonly accepted criteria for determining consensus among the participants, when a Likert scale is used. According to Miller (2006), consensus on a topic can be decided if a certain percentage of the votes falls within a prescribed range. One criterion recommends that consensus is achieved by having 80 percent of participants’ votes fall within two categories on a seven-point scale (Ulschak, 1983). However, as Shields et al. (1987) and Hsu & Sandford (2007) argue, a common definition of consensus cannot be derived from the literature, as many studies employ arbitrary criteria. We have used the standard deviation for measuring the consensus, so that a high consensus is represented by a low standard deviation. However, we could not continue the study until consensus was reached, for several reasons. First, as we mentioned before, there is no agreed definition of consensus in literature. Second, we did not have enough time to continue the Delphi study until consensus had been reached. Third, this was the most we could do considering the availability of the participants.
4.6
Conclusion
Chapter 5: Rounds setup & participation statistics
5
Rounds setup & participation statistics
The objective of our Delphi study was to produce an overview of opportunities and limitations of using SOA concepts and technologies for building BI applications. On basis of the requirements as described in Section 4.3, we have invited a number of candidate experts for participating in this study. All invitees were informed on the goal and structure of the study, and on the estimated time the study would consume. A total of 26 experts agreed to participate. The entire overview of the identified opportunities and limitations can be found in Chapter 6. In this chapter we discuss the setup and results of each round.
Section 5.1 discusses the participation of the experts, Section 5.2, Section 5.3, and Section 5.4 discuss the setup and response of the first, second and third round of this Delphi study,
respectively. in respectively. Section 5.5 contains the conclusions. The original questionnaires can be found in Appendices E, F and G.
5.1
Participating experts
Table 1 presents the background and response rates of the experts, which comprise a total of 26 experts that agreed to participate. For the second and third round, the original group of experts was invited, disregarding their participation in the previous rounds.
In the first round, 16 experts participated. There has been a significant decline in the participation rate over subsequent rounds. According to Adler & Ziglio (1996), this is a known phenomenon in Delphi studies. In our study, the short time frame of two weeks in which the questionnaires needed to be answered has sometimes coincided with experts being out of office. This possibly led to a total absence or an increasing busy schedule of the experts during the time frame of a round, making him or her unable to participate in our study. One expert has not taken part in any of the three rounds, but has provided valuable input on some of the subjects in the third round. We have not included this expert in the participation statistics. All rounds together, 18 experts participated in the study.
Invited Round 1 Part. Round 2 Part. Round 3 Part.
BI-vendors 8 7 5 3
Clients 3 0 0 0
Consultants 9 5 4 5
Researchers 6 4 4 3
Total 26 16 13 11
Chapter 5: Rounds setup & participation statistics
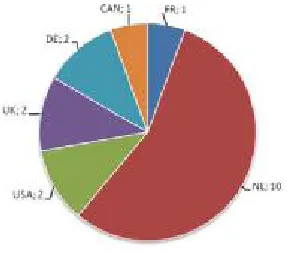
The invited experts reside in different countries. Figure 11 shows the countries of residence of the experts that participated in at least one round. As the figure shows, most of the participants reside in the Netherlands, which is also the residence of the author of this research.
Figure 11: Residing country of participants
To measure the experience of the participants on the topics discussed, we designed a short self-assessment in which the participants were asked for their years of experience with BI and/or SOA, and the number of projects related to BI and/or SOA they had participated in. Table 2 shows the results of this self-assessment. It is clear that most participants have had considerably more experience with BI than with SOA, for both the number of years and number of projects. This is easily explained from the relatively short period of existence of SOA comparison with BI.
BI Experience SOA Experience
No. Years No. Projects No. Years No. Projects
0 2 0 3 0 5 0 7
1-5 2 1-10 8 1-2 4 1-3 6
6-10 10 11-20 2 3-5 7 4-10 4
>10 4 >20 5 >6 2 >10 1
Table 2: Experience participants with SOA and BI according to self-assessment
5.2
First round setup & response
In the first round, experts were presented open questions on which opportunities and limitations they could identify for the use of SOA for BI applications. This round can be characterized as a brainstorming session: experts were encouraged to write down any ideas that came to mind. Some structure was in place though. The questions were guided by three BI models: the BI cycle as described in Section 2.3, the BI functions model as described in Section 2.4, and the traditional BI systems architecture model as described in Section 2.5. The traditional BI model was meant to be referred to when identifying an opportunity or limitation related to the traditional BI architecture, but the questions were not based on this model. At the end of the questionnaire a catch-all question served to identify further opportunities and limitations that could not be identified based on any of the models.
The questionnaire contained an introduction to the study and to the concepts of SOA and BI, and contained a self-assessment section for measuring the expertise of the participants. The
Chapter 5: Rounds setup & participation statistics
Some experts focused more on certain parts of the questionnaire than others. Also, the answers differed in length. While some participants answered with a few words, others wrote several sentences. We have collated all answers into one overview, which was designed as a list of short descriptions of an opportunity or limitation. Answers that were identical or that largely overlapped have been combined. Answers that were too ambiguous, or simply irrelevant to the study, have been omitted from the overview. The resulting overview contained a total of 51 answers, of which 40 opportunities, 10 limitations, and 1 general remark.
5.3
Second round setup & response
The list of opportunities and limitations that was generated in the first round, has been rated and commented on by the experts in the second round. In the questionnaire, all items of the list were rewritten as hypotheses, for which each expert could select their level of agreement on a seven-point Likert scale. Some hypotheses also included a rating for technical feasibility, for distinguishing the value of the idea from their current implementation feasibility; some opportunities can be valuable, but are difficult to implement using current technology.
The experts were encouraged to provide arguments for their rating, which were used in the subsequent round to inform the group of the different views on each item. New opportunities or limitations could also be added. In case a participant did not comprehend the hypothesis fully, e.g., because he did not have the necessary knowledge on the subject, a no opinion option could be selected. This prevented them from choosing “neutral”, which would have corrupted the results.
The questionnaire was sent out to the same 26 participants as in the first round. As displayed in Table 1, 13 experts sent back a completed questionnaire. The other experts responded that they were too busy to participate, or again did not respond at all.
For each hypothesis, the mean, standard deviation, and percentage of “no opinion” has been calculated. Table 3 presents the distribution of the ratings in six levels, each level stating the number of hypotheses that falls within this range. A high mean represents a strong agreement to the hypothesis. Table 4 presents the consensus over all items by means of the standard deviation, split in six levels, each level stating the number of hypotheses that falls within their range of consensus.
M <0 0<M 0.5 0.5<M 1.0 1.0<M 1.5 1.5<M 2.0 2.0<M 2.5
No. Hypothesis’s 2 7 6 11 15 8
Percentage 4% 14% 12% 22% 31% 16%
Table 3: Means (M) of ratings (high M = strongly agree)
SD 0.75 0.75<SD 1 0.75<SD 1.25 1.25<SD 1.5 1.5<M 2 2<M 2.25
No. Hypothesis’s 3 11 8 14 10 3
Percentage 6% 22% 16% 29% 20% 6%
Table 4: Consensus in Standard Deviation (SD) (Low SD means high consensus)
Chapter 5: Rounds setup & participation statistics
5.4
Third round setup & response
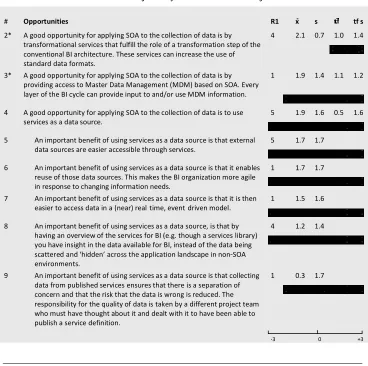
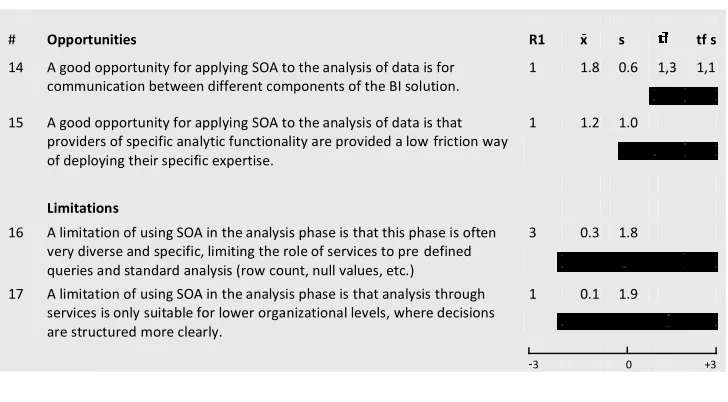
For the third round, we have selected the opportunities and limitations with a high average level of agreement, or with a very low consensus. The opportunities for which the experts already provided us with enough information in the second round were left out of the selection process. Both the items with a high average general rating and with a low consensus were interesting for further research, to determine why some opportunities and limitations received high ratings, and why some the ratings were very different rated.
Thirteen items of the previous round were presented: nine identified opportunities with a high general rating in round 2, three opportunities with a low consensus in round 2, and one limitation with a low consensus in round 2. We also added one opportunity that was not yet rated. A questionnaire with the following information was provided to each participant of the third round:
The selected hypotheses from round 2;
For each hypothesis, the average general rating and the standard deviation of the general rating from round 2;
For each hypothesis, the rating on technical feasibility and the standard deviation of the technical feasibility rating of round 2, if measured in the previous round;
The rating of this particular participant the questionnaire was sent to, that were provided in round 2, if this expert participated in that round.
The comments from round 2;
For each item, the experts were asked to provide arguments for their rating, and they were also allowed to adjust their rating, e.g. on basis of new insights provided by comments of others. They were asked why they assigned this specific rating, and which characteristics of SOA were important for this opportunity or limitation.
Again, we sent out the questionnaire to the 26 experts, from which eleven experts sent back the questionnaire, of which most of them provided the arguments for their rating for each item of the questionnaire. The information that they delivered provided us the needed insight for explaining the ratings. This information has been used for analyzing the results, which are presented in the following two chapters.
5.5
Conclusion
In this chapter we have discussed the setup of the Delphi study in terms of the process and the constitution of the expert panel and the statistics on their participation. In the first round, each of the experts that agreed to participate was sent a questionnaire with open questions, based on the BI models that we presented in Chapter 2. From the questionnaires that were sent back, we have created an collated overview of opportunities and limitations. We distributed this overview in the second round to be rated and commented on by the expert panel. A selection of these opportunities and limitations were again presented in an overview, including the ave