CSEIT1833654 | Received : 10 April 2018 | Accepted : 24 April 2018 | March-April-2018 [ (3 ) 3 : 1645-1649 ]
© 2018 IJSRCSEIT | Volume 3 | Issue 3 | ISSN : 2456-3307
Counselling Guidance Using Big Data Analytics
Jinka Thirunarayana
M.Tech (CS), Department of CSE, JNTUCEA, Anantapur, Andhra Pradesh, India
ABSTRACT
Owing to the increasing career paths with the diversified opportunities, choosing a suitable career has become the most important and crucial decision among students and obviously it has turned out as quite difficult decision in students. The Council of Scientific and Industrial Research (CSIR) stated that 40% of immediate graduates are in perplexing state towards their career option. This scenario is an unfortunate and leading the students to choose an inappropriate career path, sometimes the field of work may be irrelevant to their field of study or interest. Therefore, this unfavorable scenario may cause damage to the quality of human resource and productivity of organization as well. Hence, there is a need for counselling guidance to all graduating student community in order to guide them regarding career option at right direction. This proposed analytics would definitely help the students to select an institution and program or course in accordance to their field of interest, personality, trait, mental ability. This proposed analytics would definitely help the students to select an institution and program or course in accordance to their field of interest, personality, trait, mental ability. This module is also much helpful to colleges, managements, and universities to review the historical data pertaining to counselling records and college details.
Keywords :CSIR, Big Data, Analysis Of Historical Counseling Data, NAAC
I.
INTRODUCTION
The massive expansion and exploration of research in various domains created a huge number of career opportunities along with many diversified fields. This could be the underlying factor behind the confusion among the students belonging to intermediate or tenth or higher secondary education. Despite the wide options available for their career, the confusion among students is due to various reasons such as unawareness on available career option, lack of self-confident, lack of self assessment of their ability, perplex state on multiple field, lack interaction and exposure on current trend and ignorance on market boom. Apart from these factors, it has been stated psychologists that most of the students are possessing assumed social life, experiencing peer-pressure and inferiority complex even on their ability. The above discussions conclude that the student is
self-misdirected to choose their inappropriate field, subsequently it leads to dissatisfaction on his duty, poor performance, anxiety, stress, social disregard and why not including health issues in later stage. In relevance to existing technological advancement, in addition to the manual guidance, I feel technology based career guidance will play major role on student psychology. Hence, this piece of research has been attempted not only in the interest of student community but also in favour of organizations and nations.
1.1 Motivation
be one of the major aspects of quality education. So the present project is focused to analysis of counseling guidance by using big data. This project is motivated to perform the analysis of historical counseling data sets for producing optimum predictive results by using hadoop-hive software which was used to analyze, to store, and for processing the counseling data sets. This project can also be used to perform various big data operations such as extraction, transformation, and loading, especially to generate the results. Here will take
Seat Filling by Category
Performance
Branches are Choosing Mostly
Colleges are Choosing Mostly
Placements
NBA
NAAC
Autonomous
2. This analysis allows university to analyze their affiliated college details.
3. It differentiate two or more colleges with respect to performance, placements, student-staff ratio, affiliations and student rating.
4. This analysis includes historical data sets so that accuracy will be relatively more.
1.3 Objective:
The main objective of this application is to analyze historical datasets of various colleges affiliated to one university and comparing the college performance
with respect to placements, student- staff ratio, affiliations, students’ performance and student rating. 1.4 Organization
Counseling guidance on the basis of the concept “big data analytics” was developed by using On-line Analytical Processing (OLAP) rules.
Modules
List of all modules
1. Student Population 2. Seat Filling by Category 3. Staff student ratio 4. Performance
5. Branches are Choosing Mostly 6. Colleges are Choosing Mostly 7. Placements
In this module, the student details were displayed in year wise manner using both table and graph format. The results were displayed by using visualization software. The canvasjs visualization software was used to visualizing the results. Gender wise students were displayed separately and finally the year wise value as total was calculated at the end. In graph, bar was designed to represent each gender, in such a way that the cursor move on bar, the application shall display the relevant gender with a total number of students.
2. Seat Filling by Category
3. Staff Student Ratio
In this module, student staff ratio shall be displayed in year wise manner using table format and also in graph formats. In Graph, bars represents student and staff count (year wise).
4. Performance
In this module performance of each college was calculated by using total students average marks in year wise manner. This performance was calculated in terms of percentages. Performance was displayed by using table format and graph formats. Each bar represents one year performance of overall colleges. Individual performance of colleges are displayed in table in year wise manner
5. Branches are choosing Mostly
In this module branches are choosing mostly by the students were displayed by using table format and graph format.
6. Colleges are choosing Mostly
In this module colleges are choosing mostly by the students were displayed by using table format and graph format.
7. Placements
In this module placement details were displayed with count. Placement details were displayed by using table format as well graph format in year wise manner.
8. Staff Info
In this module, staff details are displayed in numerical count. The categories of staff included were, professor, associate professor and assistant professor. Staff details are displayed by using table format and graph format. In graph, In graph, each bar represents respective staff category counts in year wise manner.
9. NBA Accredited Colleges
In this module, a list of NBA accredited colleges were included and displayed in table format. This information was used in the evaluation process of a particular college. Based on the accreditation status, the allocated points shall be added to the college, that would serve as advantage to college.
10. NAAC Accredited Colleges
In this module, lists of NAAC accredited colleges were displayed in table format. Then information was evaluated. Based on the accreditations, the points shall be added as advantage to the college
11. Autonomous Colleges
In this module autonomous colleges were displayed in table format. This information will be used in evaluation process of a college. Based on the Accreditations, the points will be added as advantage to the college
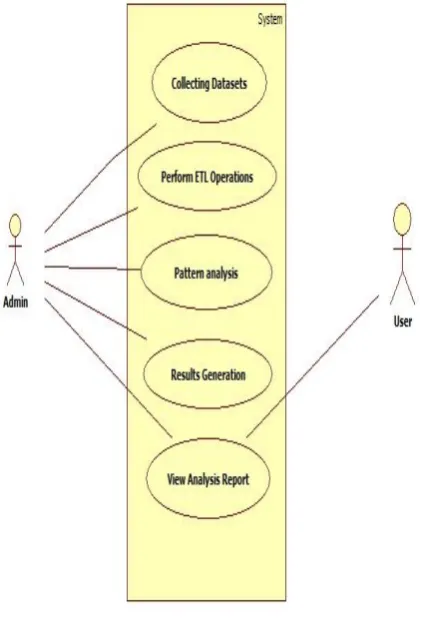
Figure 1. Use case Diagram
II.
LITERATURE SURVEY
can be beneficial if a huge number of techniques or applications are connected in an education structure [1]. In literature various performances were compared on a data set which has been composed of different responses from student community to evaluation questionnaire by using accuracy, precision, recall, and specificity performance metrics [2]. With the advent of Internet of Things (IoT) and Web 2.0 technologies, there has been a incredible growth in the quantum of data generated [3]. Still college managements are using traditional web applications or manual techniques for analyzing the traditional historical data sets. The ambiguity will arise when we are dealing with historical data sets. It takes longer time to analyze and producing optimum results. The reported traditional technologies such as Relational Database Management System (RDBMS) has own its disadvantages to process big data and new technologies [3].
III.
SYSTEM DESIGN
The performances are compared on the data set which has been comprised of various responses obtained from students through a real course evaluation questionnaire. It was appraised for their accuracy, precision, recall, and specificity performance metrics.
Attribute is defined as a information that determines the property of a field. The counselling guidance by the use of big data analytics attributes and shall play major role for performing analysis, it means the entire analysis is done based on attributes characteristics. Attribute is defined as a information that determines the property of a field. The counselling guidance by the use of big data analytics attributes and shall play major role for performing analysis, it means the entire analysis is done based on attributes characteristics. A data set or dataset is nothing but it is a collection of data. Most commonly a data set corresponds to the contents of an attribute.
Generating datasets in this project plays major role till end of the project. Here, we took nearly 6,50,000+ datesets were collected for Counselling guidance using bigdata analytics.
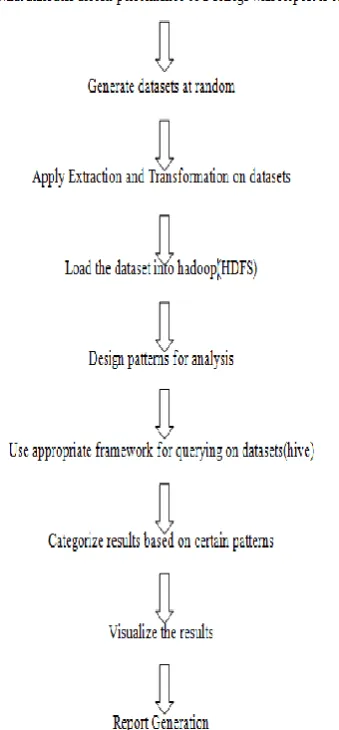
Algorithm
Figure 2. Algorithm
counselling guidance using big data analytics, CSV file format was employed. HDFS is abbreviated as “Hadoop Distributed File System”. HDFS hold huge data sets and access us to handle easily. The storage and processing of the immense data is usually done by multiple machines. Unlike routine storage system, in our project, files are designed in such a way to store in a superfluous fashion and also it can preserve the system from possible damage, data loss or failure. HDFS is also provides all applications for the purpose of parallel processing. Pattern is an input task for processing particular data sets in big data analytics. In this application module, a number of patterns included which were designed based on the user requirements. Apache Hive is well known warehouse software data base which had been built on the apex of Apache Hadoop especially for data summarization, query and analysis. Hive software aids various manual processes such reading, writing, and management of large scale data which is residing in the distributed storage using SQL like querying. In this application, the selected structure can also be projected on a available data which is already in storage. A command line tool and JDBC driver are being provided to connect users to Hive and after completion on hive tasks, results can be generated. These results can be stored into separate files on the basis of different patterns mentioned in fifth step of algorithm. Visualization of the results and the obtained from the hive processing are stored as csv file. By using Canvasjs technology we can also visualize those results into a table format and also as graph format. This final report shall show us entire counselling guidance analysis in a web page format with User Interface effects. Report generation is process of displaying analysis results by using java, html, css. Here results will be displayed according to the requirements.
IV.
CONCLUSION
The Project Counselling Guidance Using Big data Analytics was developed in order to minimize
maintaining large set of counselling records of entire University. For quick analysis regarding counselling and college information under particular university, this project was very helpful. This shows that for selecting a career of a student is important factor, but also the interest of the student and the capacity of the student to take that courses are also important. Using this system, the student just needs to choose their career option based on the analysis. Thus, the effort required to search the colleges will also reduce. This project was developed as web application based big data analysis. So it is user friendly environments to understand the analysis reports in tabular and graphical formats.
V.
REFERENCES
[1].A Roshani, PR Deshmukh, An incremental ensemble of classifiers as a technique for prediction of student's career choice. IEEE Networks & Soft Computing (ICNSC) on 25 September 2015.
[2].A Mustafer, Predicting Instructor performance using data mining technique in higher education. IEEE 2016; 4:2379-2387.
[3].C Ling, R Dymitr, et al. Big Data: Opportunities for Big Data Analytics. IEEE Digital Signal Processing (DSP) on 10 September 2015.
[4].UD Beth, HE Janet, Using Learning Analytics to Predict (and Improve) Student Success: A Faculty Perspective. Journal of Interactive Online Learning 2013; 12:17-26.
[5].KS Lokesh, RS Bhakti, et al. Novel Professional career prediction and recommendation method for individual through analytics on personal traits using C4.5 algorithm. IEEE Communication Technology (GCCT) on 3 December 2015. [6].M Yannick, X Jie, et al. Predicting Grades. IEEE
transactions on signal processing on 15 February 2016