All, and only, the errors: more complete and consistent
spelling and OCR-error correction evaluation
Martin Reynaert
Induction of Linguistic Knowledge Tilburg University,
Postbox 90153, 5000 LE Tilburg, The Netherlands [email protected]
Abstract
Some time in the future, some spelling error correction system will correct all the errors, and only the errors. We need evaluation metrics that will tell us when this has been achieved and that can help guide us there. We survey the current practice in the form of the evaluation scheme of the latest major publication on spelling correction in a leading journal. We are forced to conclude that while the metric used there can tell us exactly when the ultimate goal of spelling correction research has been achieved, it offers little in the way of directions to be followed to eventually get there. We propose to consistently use the well-known metrics Recall and Precision, as combined in the F score, on 5 possible levels of measurement that should guide us more informedly along that path. We describe briefly what is then measured or measurable at these levels and propose a framework that should allow for concisely stating what it is one performs in one’s evaluations. We finally contrast our preferred metrics to Accuracy, which is widely used in this field to this day and to the Area-Under-the-Curve, which is increasingly finding acceptance in other fields.
1.
Introduction
Some day one will be able to run a text through a computer program and be confident that all lexical inadequacies, in-accuracies or downright errors, regardless of their origin, have been removed. Which evaluation metric is capable of eventually telling us this day has arrived? This is what we explore in this paper. Obviously, this perfect spelling cor-rector will need to have these features: not only will it have to be able to unerringly classify errors as errors, given their particular context, and to correct these, but it will also have to be able to decide that given its context a particular word string is correct (even if erroneous, when viewed out of its particular context) and is to be left untouched. So we will need to use metrics that tell us how well a system corrects the errors, and only the errors.
This paper focuses on consistent metrics for evaluating spelling checking and correction systems (further: SCCs), by which we mean not solely systems for the correction of human-made spelling errors and typographical mistakes: the framework we propose is also straightforwardly appli-cable to the evaluation of OCR post-correction systems. Whatever their origin, we simply refer to all distinguish-able error types as ‘errors’.
This paper focuses solely on the metrics for evaluating
SCCs. More aspects of evaluation are indeed important, in our opinion, not least the test sets used, how these were ac-quired, whether they represent real-world data or fabricated data, how large the sets are and what they are composed of. We leave these topics for a future paper, but the interested reader is referred to (Reynaert, 2005) where these aspects are treated to greater or lesser extent.
In Section 2 we take an introductory look at current prac-tice in the field. In Section 3 we introduce the task, the measures and the metrics we propose to be used. In Section 4 we describe and motivate how we would evaluateSCCs. For fear of kicking in open doors, we present what we take
to be a straightforward approach to measuring various lev-els of performance of anSCC and stress that reporting on fully automatic spelling error correction should include re-porting on how the system performs with respect to non-erroneous word forms. In Section 5 we revisit the topic of current practice and outline how and why we think evalua-tions based on our framework are more informative. In Sec-tion 6 we study related work on the evaluaSec-tion ofSCCs in (Starlander and Popescu-Belis, 2002) and (van Huyssteen et al., 2004) and contrast their main proposals with our own. Section 7 briefly contrasts the metrics we propose to be used to Accuracy, the metric employed most often in the evaluation ofSCCs, and to the Area-Under-the-Curve, an-other metric which in an-other fields is gaining more and more acceptance. Section 8 concludes this paper.
2.
Current Practice
So what is done here is to take the text to be corrected and to measure the percentage to which this original text is ac-curate on the basis of comparison with the gold standard. Then to have the text corrected automatically by the system and finally to measure the percentage of the accuracy of the resulting test. This does indeed tell us how far we are from the actual goal that is pursued, the measure of inaccuracy of the corrected text states precisely how many percentages we are from a perfectly correct text. However, this is not at all informative in terms of the number of actual errors that were corrected, nor about the numbers of already correct words in the text that were replaced by other words from the dictionary. In fact, this does not tell one where the sys-tem’s weaknesses and strengths lie and how one might pro-ceed towards the ultimate goal of obtaining perfect accu-racy. In the next Section we propose how both these aspects of an SCC’s performance can be measured more precisely and more informatively. The point we want to make here is that this particular corrected text is still 1.26% inaccurate. Granted, the input text was less accurate at 97,64%, but was actually chosen for its degree of inaccuracy. Nevertheless, most well-edited texts have far greater accuracy, e.g. the ac-curacy of a novel containing 200,000 words, one of which being a single typesetting error, would in fact be 99,9995%. Still, one would like to see that single error corrected auto-matically some day. And none of the other words changed. This is a hard task, of which none of the systems available today is in fact capable. The metrics we propose next allow for precise measuring of the actual performance ofSCCs on the task and help one to see more clearly the strengths and weaknesses of the particular system evaluated, pointing out more clearly the way to possible future improvement.
3.
Evaluation metrics
TN
FP TP FN
NON−TARGET TARGET
SELECTED
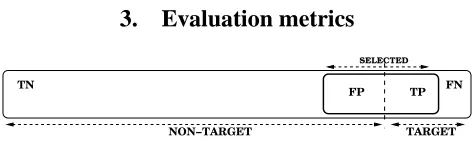
Figure 1: Schematic representation of the task faced by a spelling error detection and correction system.
We start by presenting what we see as the task faced by anSCC. This view is biased. We will motivate our partic-ular bias at the beginning of Section 6. Figure 1 gives a graphic representation of the task. The large box represents the set of word strings in a text or language. The typically much larger, left portion depicts the correct or acceptable word forms, the smaller portion to the right the incorrect or unacceptable word forms. The dashed line between both represents the fact that the boundary between these two categories is not always razor-sharp: what is and what is not correct depends on the definition of ‘correctness’ used. Words to the left of the boundary are non-target items for spelling error correction, the words to the right form the target. The diagram therefore describes the problem of dis-tinguishing between correct words (the non-target) and in-correct words (the target). The system selects or retrieves a set of words of which it assumes that they are incorrect (the selected set). The intersection between the selected
Target Non-target
Selected TP FP
Not selected FN TN
Totals P N TOTAL
Table 1: Confusion matrix. P= positive,N= negativeT= true,F= false.
set and the target set defines the set of incorrect words cor-rectly identified as such and corrected (True Positives or
TPs). Non-selected non-target items form the set of True Negatives orTNs, which typically forms the majority class and often displays great skew. The False Positives orFPs are those items retrieved that are in fact correct word forms. The part of the target which was not retrieved by the sys-tem forms the set of False Negatives orFNs. The aim of any
SCCwill be to maximize the overlap between the target and selected sets, achieving perfection when this is 100%. Achievement on this task can be measured on two levels: on the level of the word types present and on the level of the word tokens present. The skew in the distribution of correct versus incorrect word types will be all the larger when the measurement is taken on the level of the word tokens.
The interrelations between True and False Positives and Negatives are conventionally represented in a confusion matrix (often referred to as a contingency table). This is shown in Table 1. From the confusion matrix many metrics can be derived. We propose our framework on the basis of Recall and Precision because the process of spelling error detection and correction has a lot in parallel with the pro-cesses involved in information retrieval, in the framework of which these metrics were developed by (van Rijsbergen, 1975). Other candidate metrics, notably Accuracy and the Area-under-the-Curve (AUC), will briefly be discussed in Section 7.
From theTP,FNandFPwe can derive Recall and Precision as follows (Manning and Sch¨utze, 1999) (p. 268-269):
Recall = R = T PT P+F N Precision = P = T P T P+F P
Since we deem Recall and Precision to be equally impor-tant, the harmonic mean ofRandP, the simplified F mea-sure,F, is given by:
F score = F =2×R×P R+P
faced with the full task, i.e. when given not only a list of in-correct word forms to in-correct, but also in-correct word forms, so that for every item in the list the decision must be made whether or not it needs correcting. When the system then reports that a correct item is incorrect and ‘corrects’ it, it changes a non-target item into a target item and creates a False Positive. This will cost Precision points. One of the reasons why the definition of Precision handled by these authors is not valid is because the sum of the numbers ob-served forTPs,FNs andFPs should always be equal to the number of items selected or retrieved and the sum of TPs and FNs should correspond exactly to the target, i.e. the known number of errors in the particular test set. We will call this the ‘sum’ test.
They are not alone in erring here, we have done so in (Rey-naert, 2005). On page 107 we stated: ‘ The score for False Positives, i.e. Precision errors, is incremented in the same manner by the type’s token frequency for those types for which the system returns correction candidates, but where the correct one is missing . . . ’. In so far that these are in fact errors that are not corrected and therefore already counted as False Negatives, this was plain wrong. For the record, the actual number of cases affected by this was very small (i.e.: 3) in our test set and any effect in the scores reported rounded to the nearest thousandth should be obliterated by rounding to the nearest hundredth. In any case, the simple ‘sum’ test described above should help evaluators to avoid this kind of painful mistake.
4.
Evaluation Framework Proposal
We propose a framework for evaluation firmly based on the contingency matrix at all levels of evaluation. The task an
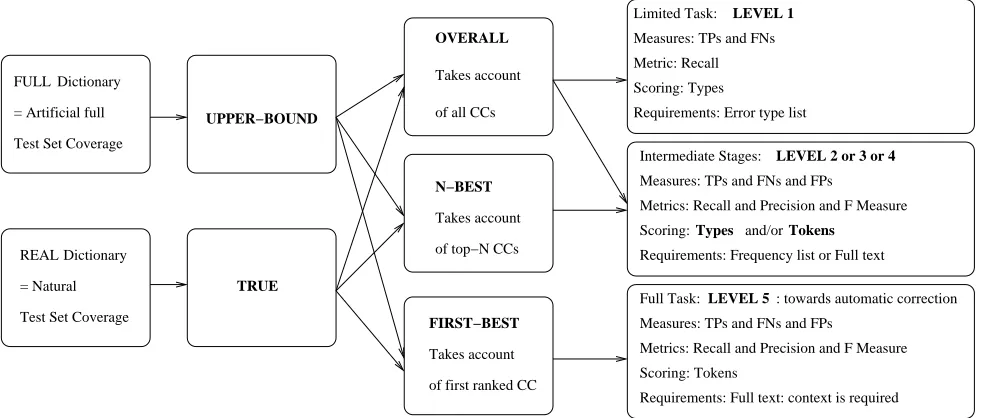
SCCis set to perform can be thought of as existing on differ-ent levels, represdiffer-enting the subtasks. In the scheme we pro-pose, performance can be measured at each level by means of the same metrics. We discern the following 5 levels:
1. Core-correction mechanism: how well is the algo-rithm capable of handling all the types of errors the system is said to be able to tackle? This amounts to measuring the numbers ofTPs andFNs.
2. Error detection: how well is the algorithm capable of distinguishing between what is erroneous and what is not? How many true and how many false alarms are raised? This amounts to measuring the numbers of
TPs,FNs andFPs.
3. Suggesting correction candidates: how often is the correct CC among the set of CCs? This amounts to measuring the number ofTPs in the set ofCCs, those not present beingFNs. The number ofFPs is as deter-mined on Level 2.
4. N-best ranking: how often is the correctCCamong the
n-best rankedCCs? This gives the (in comparison to
the previous level: likely smaller) number ofTPs, the rest are theFNs. The number ofFPs is as determined on Level 2.
5. First-best ranking: how often is the correctCCamong the first-best rankedCCs? or: how often is the onlyCC
returned the correct one? This gives the (in compari-son to the previous levels: likely even smaller) number ofTPs, the rest are theFNs. The number ofFPs is as determined on Level 2.
We denote the core-correction mechanism as the first level because we regard it as the only level on which it is suffi-cient to evaluate on lists containing errors only. All other levels, in our opinion, demand evaluation on both correct and incorrect word forms. On whatever level tested, in this framework, the actual formulae employed to measure do not differ. All that differs is the subtasks involved in the various levels, each subtask of a lower level being im-plied in the next and performance failures at the lower lev-els naturally percolating through to the higher. If the core-correction mechanism cannot handle errors at e.g. Leven-shtein distance 4 (further: LD, (Levenshtein, 1966)), errors
of that type will never be corrected by the system that is based on it.
One may well think that an error needs to be detected be-fore it can be corrected and argue that detection should be denoted Level 1. This is in fact contradicted by common practice in spelling correction research where in fact the system is often evaluated only on its correction capabilities, by presenting it with a list of errors only. Highly influen-tial and interesting examples of this practice are (Brill and Moore, 2000), (Toutanova and Moore, 2002). We regard detection as Level 2 in the evaluation ofSCCs, because this is where two components, i.e. the correction mechanism and the detection mechanism work in concert and should be evaluated in concert. In fact, the detection ofCCs is of-ten a concomitant of the correction mechanism. The point is that when anSCCis equipped with a more powerful cor-rection mechanism, i.e. with a higher reach in terms ofLDit can cover, it will retrieve moreCCs, retrieving actual typos which lie at greaterLDfrom their correct version, but also more False Positives, e.g. existing words not present in the dictionary which resemble in-dictionary words within the particularLD.
Depending on the level at which an evaluation is to be per-formed, the test set required may differ. We will further refer to evaluations on lists of errors only as the limited
task and evaluations by means of word frequency lists or
running text containing both correct and incorrect words as the full task. The ratio between correct and incorrect words present should then be stated. We see both limited and full as legitimate evaluation operations, but think that the limited task is more suited to developers of say new ‘core-correction‘ mechanisms, while the full task should be performed when a full system covering all aspects of the process is presented and claims are made towards auto-matic spelling correction or comparisons between systems are made.
Limited Task: Measures: TPs and FNs Metric: Recall
LEVEL 1
Scoring: Types
Requirements: Error type list
of first ranked CC Takes account FIRST−BEST
of top−N CCs Takes account N−BEST Takes account
of all CCs OVERALL
TRUE
Full Task: LEVEL 5 : towards automatic correction Measures: TPs and FNs and FPs
Metrics: Recall and Precision and F Measure Scoring: Tokens
Requirements: Full text: context is required Intermediate Stages: LEVEL 2 or 3 or 4 Measures: TPs and FNs and FPs
Metrics: Recall and Precision and F Measure
Requirements: Frequency list or Full text Scoring: Types and/or Tokens UPPER−BOUND
REAL Dictionary FULL Dictionary
= Artificial full
Test Set Coverage
= Natural
Test Set Coverage
Figure 2: Evaluation Framework
longer words, i.e. by measuring these scores by (ranges) of word length(s). In diagnostic tests on the level of the core-correction mechanism, it may be revealing to separately test on the various types of errors. We distinguish between the following evaluation subtypes:
• To effectively remove the effect of dictionary
short-comings on a system’s scores, one may add all the correct word forms for the errors to be corrected to the system’s spelling dictionary. This allows for mea-suring the upper bound on correction attainable by a particular system to be measured and we therefore re-fer to this as the upper bound score, which is to be reported for types.
• The scores achieved without ensuring that all the
cor-rect forms are in the dictionary, i.e. with the sys-tem’s ‘natural’ dictionary, we then refer to as the true
scores, which are to be reported for types.
• When we measure the scores without taking into
ac-count the ranking of theCCs we call these the overall
scores. These may be reported for the upper bounds
or for the true scores, for types and/or for tokens.
• One may wish to measure and report scores on a
par-ticular rank, e.g. measure how often the correctCC
is returned within the first n ranked candidates. This can be called the n-best ranking score and can be re-ported for types and/or for tokens.
• When we focus on best-first ranking of the candidates
and measure those that effectively are ranked with the desired candidate (given the context) presented as the first or only CC, we measure the first-best ranking
scores. When context is fully taken into account this
requires reporting on tokens, but this can be reported on types for correction experiments on very large cor-pora as e.g. in (Reynaert, 2008).
In scoring on types, each type gives one TPorFN orFP. In scoring on tokens, the type’s token frequency in the text
determines the total number ofTPs and/orFNs and/orFPs as dictated by each token’s context and the particular (n-best)
CC(s) proposed by the system.
5.
Current practice revisited
We posit that no lexicon can ever be complete. A fuller dis-cussion of this can be found in (Reynaert, 2005). A system encountering a word absent from its dictionary will try to correct it and will suggest correction candidates. This needs measuring. It is not really sufficient to only state how many items the system’s dictionary contains and what percentage of a given evaluation text is thereby covered. It is necessary to state how the system deals with words it does not have in its dictionary and to measure this. Precision is strongly determinative of a system’s ‘fitness’ for automatic correc-tion. We have known at least since (Pollock and Zamora, 1984) (p. 104) that ‘Automatic correction requires a much more precise detection phase than manual correction and, surprisingly, it seems easier to achieve high accuracy in correction than in detection.’ Furthermore, if one measures Precision, one thereby also measures the lexical coverage of a system, although indirectly.
In the concisely statable terms of the framework we have just proposed, (Ringlstetter et al., 2006) perform a True, First-Best, Level 5 evaluation on Tokens. Given the infor-mation in the article, we cannot know exactly what their scores in terms of the metrics we propose are. We are given information about the True Positives, however. In view of the accuracy of the corrected text, 1.26% or 223 (rounded to the nearest whole number) of the 17,697 tokens in the test set remain uncorrected by the best system. At this point we do not know whether these are true errors which the sys-tem failed to correct, i.e. False Negatives, or correct words, which the system replaced by other words from its dictio-nary, i.e. False Positives. Nevertheless, given that there were originally 418 errors in the test set, 195 errors, the True Positives, were in fact corrected.
parameter to decide whether or not to to accept the most likely correction candidate or to let the original word form stand. We are not given actual performance scores for this variable threshold. If the system in fact replaces the un-known correct words by other correct words, it creates real-word errors in the text. In terms of our proposal, these should be seen as False Positives. The rest are then un-corrected true typos, the False Negatives. We would in fact very much like to learn how the variable threshold in prac-tice performs, as it is very similar to the ‘Zipf Filters’ we have proposed in (Reynaert, 2005). In terms of our pro-posal, a full evaluation of this kind of work would entail first a Level 1 evaluation in order to assess how many of the real-life errors in the test text are in fact covered by the error dictionaries used by the system. Second, a Level 2 evaluation to assess the performance of the threshold set at a particular level in order to see how many of the CCs retrieved are in fact retained and the actual correction ef-fected in the text and to simultaneously assess how often this is performed when the word replaced was actually cor-rect to begin with. Finally, a Level 5 evaluation to assess the first-best ranking achieved.
6.
Related Approaches to SCC Evaluation
As stated at the beginning of Section 3, there is an obvious bias in our description of the task anSCCis set to perform in that we unhesitatingly denote as the target the non-words in the list or text to be corrected. Indeed, there appears no reason why one cannot denote the correct words in the text as the target. In fact, (van Huyssteen et al., 2004) propose to measure Recall and Precision on both the correct and in-correct word forms. We see no good point in this, because the incorrect forms are typically outnumbered by the cor-rect ones, thereby constituting the minority class. Given very large skew, scores on the majority class are likely in the upper reaches of the scale and far less distinctive be-tween systems than scores on the minority class. Another good reason is that while incorrect or unacceptable word forms can be pretty well defined, whatever the definition of correctness actually applied, it is a lot harder to rigorously define the correct class of word forms as it is in fact an open class.
Further, the authors refer to an EAGLES specification that a metric should ‘constantly provide the same results when ap-plied to the same phenomena’ (EAGLES-I, 1996). They ar-gue that huge differences in results in two of their scores ob-tained by a single spelling checker on three different texts, differing both in length and percentages of errors present, ‘motivate the need to re-evaluate current best-practices in the evaluation of spelling checkers’. The way we see things, texts differing in length and error percentages are simply not ‘the same phenomena’ and metrics should reflect the fact. The metrics we propose, do.
The approach advocated here allows for analysing at the various levels where a system’s strengths and weaknesses lie. This is not in the words of (Starlander and Popescu-Belis, 2002) ‘unfairly penalizing a system twice for the same mistake’ which leads them and (van Huyssteen et al., 2004) to not measure Precision at the correction level. This forces them to look for new, less concise metrics to measure
the higher levels of a system’s performance. Our approach simply takes into account level by level what went right and what wrong providing intermediate scores with real di-agnostic value and leading to a final score with real inter-pretive value about a system’s true overall performance.
7.
Accuracy, F measure and AUC
As we have seen, very often in spelling correction research it is stated that what is measured is Accuracy. Accuracy is another of the metrics derivable from the confusion matrix presented in Section 3 and is defined as follows:
Accuracy = A = T PP+T N+N
To determine Accuracy the system is then tested on lists containing erroneous word forms only. In that case there are no negative cases and the formula for accuracy reduces toT PP . This is also known as the True Positive Rate. In that
PequalsTP+FN, what is then in fact measured is Recall,
R, as in a Level 1 test in our framework.
In discussing Accuracy versus the F measure, (Manning and Sch¨utze, 1999) (page 270, Table 8.1.b) show that iden-tical Accuracy scores may nevertheless translate into in-creasing Fmeasure values, because Accuracy is sensitive only to the number of classification errors and the F mea-sure is biased towards maximizing theTPs. In the same vein we have in (Reynaert, 2005) looked in depth at the area
under the ROCcurve orAUCfirst advocated by (Bradley, 1997).
TheAUCis a single scalar value between 0.0 and 1.0 repre-senting a system’s performance. TheAUCis a reduction of a Receiver Operating Characteristic or ROC curve depict-ing performance. A ROCcurve is obtained by plotting the systems’ False Positive Rates on the X-axis and the True Positive Rates on the Y-axis (Fawcett, 2003). ROC curves
are insensitive to changes in class distribution. In that the
AUCis derived from these, it too should be insensitive. To calculate theAUCwe need to know the True and False Pos-itive Rates of a system.
True Positive Rate =tpr= T P P
False Positive Rate =f pr= F P N
The formula for theAUCof a single discrete classifier is (as derived from (Fawcett, 2003):
Area under the curve = AUC =((0.5∗(tpr∗f pr)) +
(tpr∗(1.0−f pr)) + (0.5∗((1.0−tpr)∗(1.0−f pr))))
System Ret. Cor. R P F AUC
1-best True Scores
A 10,000 100 1 0.01 0.02 0.750
B 100 50 0.50 0.50 0.50 0.747
Table 2: Results for two hypothetical correctors on the basis of a fictitious 10,000 word token text containing 100 typos. Shown are items returned (Ret.), items corrected (Cor.), Re-call (R), Precision (P), F score (F) and AUC. Reproduced from (Reynaert, 2005).
System B thus requires only one hundreth times the work to get half the job done right than system A requires to get the full job done. In the absence of fully automatic sys-tems with great Precision as well as great Recall, we think system B, requiring us to examine a 100 item list to reduce error with 50% is the better option than system A requiring us to examine the full list to get the job done to perfec-tion. In our opinion, this information is better captured by the combination of Recall and Precision scores than by the
AUC.
To conclude, we would like to point out that Recall and Precision allow for direct interpretation of the results. In plain words the scores obtained by system B can actually straightforwardly be read: ‘the system manages to correct half the errors present in the test set. For every error cor-rected it has erroneously changed one correct word in the test set into another correct word, producing 50 real-word errors in the text’.
8.
Conclusion
The framework given should allow for more complete eval-uations being conducted. Detailed evaleval-uations on commer-cial and open-sourceSCCs for English and Dutch along the lines further developed in this paper were undertaken in (Reynaert, 2005). The framework should further allow fu-ture authors to state concisely and explicitly what they are doing, e.g. ‘Table x lists the results of True, 5-Best, Level 4 evaluations on Types’.
We hope this work will contribute to greater transparency in future evaluations ofSCCs and will help to allow for more meaningful comparison between systems and approaches.
Acknowledgments This work was funded by the Nether-lands Organisation for Scientific Research (NWO). We ac-knowledge that the idea for the ‘sum’ test is due to Dr Theo Vosse, to whom we are grateful for pointing out the mistake in our earlier work.
9.
References
Andrew P. Bradley. 1997. The use of the area under the ROC curve in the evaluation of machine learning algo-rithms. Pattern Recognition, 30(7):1145–1159.
Eric Brill and Robert C. Moore. 2000. An improved er-ror model for noisy channel spelling correction. In
Pro-ceedings of the 38th Annual Meeting of the ACL, pages
286–293.
EAGLES-I. 1996. Final Report. In Evaluation of Natural
Language Processing Systems, volume EAGLES
DOC-UMENT EAG-EWG-PR.2.
Tom Fawcett. 2003. ROC graphs: Notes and practical con-siderations for data mining researchers. Technical report, HP Laboratories, Palo Alto, USA.
V. I. Levenshtein. 1966. Binary codes capable of cor-recting deletions, insertions, and reversals. Cybernetics
and Control Theory, 10(8):707–710. Original in Dok-lady Akademii Nauk SSSR 163(4): 845–848 (1965).
C.D. Manning and H. Sch¨utze. 1999. Foundations of
Sta-tistical Natural Language Processing. MIT Press,
Cam-bridge, Massachusetts; London, England.
Joseph J. Pollock and Antonio Zamora. 1984. Automatic spelling correction in scientific and scholarly text.
Com-mun. ACM, 27(4):358–368.
Martin Reynaert. 2005. Text-Induced Spelling Correction. Ph.D. thesis, Tilburg University.
Martin Reynaert. 2008. Non-interactive OCR post-correction for giga-scale digitization projects. In A. Gel-bukh, editor, Proceedings of the Computational
Linguis-tics and Intelligent Text Processing 9th International Conference, CICLing 2008. Lecture Notes in Computer Science Vol. 4919/2008, pages 617–630, Berlin /
Heidel-berg. Springer.
Christoph Ringlstetter, Klaus U. Schulz, and Stoyan Mi-hov. 2006. Orthographic errors in web pages: To-ward cleaner web corpora. Computational Linguistics, 32(3):295–340.
Johannes Schaback and Fang Li. 2007. Multi-level feature extraction for spelling correction. In IJCAI-2007
Work-shop on Analytics for Noisy Unstructured Text Data,
pages 79–86, Hyderabad, India.
Marianne Starlander and Andrei Popescu-Belis. 2002. Corpus-based evaluation of a French spelling and gram-mar checker. In LREC 2002 : Third International
Con-ference on language resources and evaluation, volume 1,
pages 268–274, Las Palmas de Gran Canaria, Spain. Paris : ELRA, European Language Resources.
Kristina Toutanova and Robert C. Moore. 2002. Pronunci-ation modeling for improved spelling correction. In
Pro-ceedings of the 40th Annual Meeting of the ACL, pages
144–151.
G.B. van Huyssteen, E.R. Eiselen, and M.J. Puttkam-mer. 2004. Re-evaluating evaluation metrics for spelling checker evaluations. In Proceedings of First Workshop
on International Proofing Tools and Language Technolo-gies, pages 91–99, Patras: University of Patras, Greece.