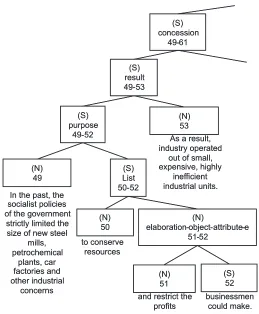
Figure 1: Fragment of anRSTtree from theRST-DTCorpus
3.
Method
For each non-terminal node in theRST-DTcorpus, we mea-sured the number ofEDUs that it subsumed. As explained, this serves as a measure of the rhetorical complexity of the relation, as well as an indication of the level at which it occurs in an RST tree. We used the Training part of the corpus, which contains 332 texts in trees of almost 35,000 nodes, noting the complexity of each span inEDUs; then for each relation we computed frequency of occurrence for each complexity value, the mean and median complexities, and the standard deviation. A zero or small standard de-viation from the mean indicates that a relation occurs al-most without exception at a particular level in anRSTtree, whereas a large standard deviation means that a relation oc-curs at a wide range of levels. Finally, we noted the role (nucleus, satellite, or root) that a node takes in anRSTtree,
and computed role frequencies for each relation.
4.
Results
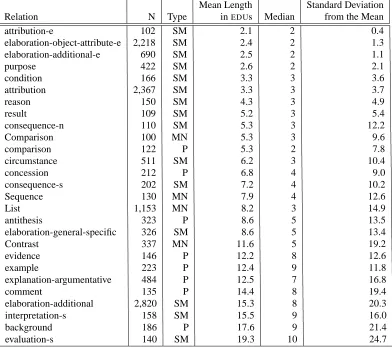
Table 1 gives aggregate data (mean, median, standard de-viation) for all relations in the RST-DT corpus for which we found at least 100 instances (i.e., N≥100). It addresses issues 1-3 on the above list. All relations in the RST
-DTCorpus are defined and explained in the RST-DT Cor-pus Tagging Manual (Carlson and Marcu, 2001). For ex-ample, names ending in “-e” denote embedded relations; those ending in “-s” mean that the relation is focussed se-mantically in the satellite rather than the nucleus (so in
EVALUATION-S, the evaluation is presented in the
satel-lite); whilst those ending in “-n” are focussed in the nucleus (thereforeCONSEQUENCE-Npresents a consequence in the nucleus).
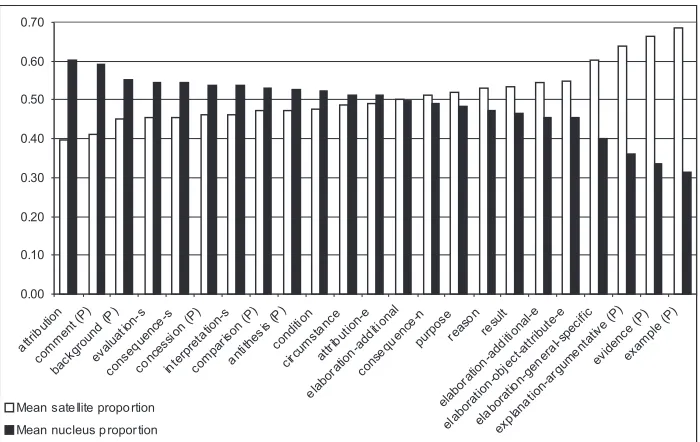
Figure 1 shows the distribution of complexity between nu-cleus and satellite for each Nunu-cleus-Satellite relation, or-dered by increasing complexity of satellite. Since the bars represent proportions, they add up to 1.0 in every case. These results address issue 4.
Figure 2 shows the distribution of roles for each relation1 – that is, whether the node in question was a satellite or nucleus of the parent node, or the root of the tree. Presenta-tional relations are shown by the label P, and multi-nuclear relations begin with a capital letter. The relations are or-dered by increasing frequency of the satellite role. These results are used for assessing issue 5.
In brief, our analysis for each issue is as follows.
1. Overall differences in complexity: Table 1 shows clear differences in mean complexity for different rhetorical relations. An Analysis of Variance (ANOVA) test per-formed on all 14,042 cases for the 27 relations in Table 1 indicates that these differences in complexity are sig-nificant (p < 0.0001). The median values are useful for indicating the typical complexity for each relation, as theLISTrelation in Figure 1 demonstrates, since al-though the mean complexity of LISTis 8.2 EDUs, in
1Embedded relations were omitted from this analysis, since
Figure 2: Mean proportions of satellite and nucleus for each Nucleus-Satellite relation (P=presentational)
Figure 3: Mean percentages of roles for each relation (P=presentational)
common across all three groups. This was confirmed by a chi-squared test (table 3, χ2 = 253.4, df = 4, p <0.0001).
5.
Discussion
It is worth bearing in mind that our results are specific to the newspaper genre of theRST-DTcorpus. However, they exhibit some clear trends. To give just one example, Fig-ure 2 shows an interesting partition of the presentational relations into ones with a relatively complex nucleus, and ones with a complex satellite; such differences may provide clues allowing a better classification of the relations. To take this a little further, let us consider a group of eight nucleus-satellite relations with high average com-plexities. In Table 1, the relations EVIDENCE, EX
-AMPLE,EXPLANATION-ARGUMENTandELABORATION
-GENERAL-SPECIFIC all have high complexities (respec-tively 12.2, 12.4, 12.5, 8.6); in Figure 2, all four come at the
satellite-heavy end (satellite proportions respectively 0.67, 0.68, 0.65, 0.60). By contrast, the relations COMMENT,
INTERPRETATION-S,BACKGROUNDand EVALUATION-S, while also having high complexities (14.4, 15.5, 17.6, 19.3), come instead at the nucleus-heavy end (satellite pro-portions 0.41, 0.46, 0.45, 0.45). With more analysis it might be possible to interpret this dichotomy: it could be, for instance, that heavy satellites tend to aim at increasing the reader’s level of understanding or confidence in the nu-cleus, while light satellites tend to add some kind of inter-pretive comment to material that is already understood and accepted. We cannot develop this point here, but such ex-amples do suggest that complexities are worth analysing as a source of theoretical insights.
On a more applied level, the complexity data reported here could be used directly in discourse planning algorithms for
Subcategory N Mean Std. Devn. Std. Error Mean Significance (2-tailed)
Rhetorical SM 10491 7.09 13.18 .129 p <0.0001
complexity P 1831 11.30 15.32 .358
Satellite SM 10491 3.56 7.90 .077 p <0.0001
complexity P 1831 6.49 10.71 .250
Satellite SM 10491 .49 .17 .002 p <0.0001
proportion P 1831 .55 .22 .005
Balance SM 10491 .69 .32 .003 p <0.0001
measure P 1831 .53 .31 .007
Table 2: Independent Samples t-tests (SM= subject-matter, P= presentational)
Subcategory Nucleus Role Root Role Satellite Role Total
MN 797 7 916 1720
P 1070 28 733 1831
SM 6772 169 3550 10491
Total 8639 204 5199 14042
Table 3: Cross Tabulation for role of relations (SM= subject-matter, P= presentational, MN= multi-nuclear)
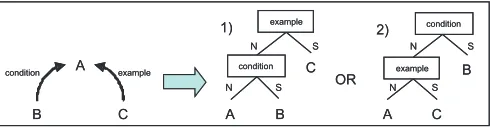
Figure 4: PlanningRSTtrees from a semantic graph
differentRST trees: (1) with theEXAMPLErelation at the root, and (2) withCONDITION at the root. If a rhetorical
planning algorithm were weighted according to our rhetor-ical complexity data, it would clearly favour tree (1) over tree (2), since CONDITIONrelations tend to be less
com-plex thanEXAMPLErelations.
6.
References
L. Carlson and D. Marcu. 2001. Discourse tagging manual. Technical Report ISI Tech Report ISI-TR-545, Informa-tion Sciences Institute (ISI) Reprint Series, University of Southern California, U.S.A.
L. Carlson, D. Marcu, and M. E. Okurowski. 2003. Build-ing a discourse-tagged corpus in the framework of rhetor-ical structure theory. In J. van Kuppevelt and R. Smith, editors, Current Directions in Discourse and Dialogue, pages 85–112.
D. Marcu and A. Echihabi. 2002. An unsupervised ap-proach to recognizing discourse relations. In Proceed-ings of the 40th Annual Meeting of the Association for Computational Linguistics, pages 368–375.
M. O’Donnell, C. Mellish, J. Oberlander, and A. Knott. 2001. Ilex: An architecture for a dynamic hypertext gen-eration system. Journal of Natural Language Engineer-ing, 7:225–250.
R. Power, D. Scott, and N. Bouayad-Agha. 2003. Docu-ment structure. Computational Linguistics, 29:211–260.
C. Sporleder and A. Lascarides. 2004. Combining hierar-chical clustering and machine learning to predict high-level discourse structure. In Proceedings of the 20th International Conference on Computational Linguistics, pages 43–49.