Proceedings of Recent Advances in Natural Language Processing, pages 1041–1051, 1041
Whom to Learn From?
Graph- vs. Text-based Word Embeddings
Małgorzata Salawa1,2, Ant´onio Branco1, Ruben Branco1, Jo˜ao Rodrigues1 and Chakaveh Saedi1,3 1University of Lisbon
NLX-Natural Language and Speech Group, Faculdade de Ciˆencias, 1749-016 Lisboa, Portugal 2AGH University of Science and Technology
Faculty of Computer Science, Electronics and Telecommunications, 30-001 Krak´ow, Poland 3Macquarie University
Department of Computing, Sydney, NSW, 2109, Australia
Abstract
Vectorial representations of meaning can be supported by empirical data from diverse sources and obtained with diverse embedding approaches. This paper aims at screening this experimental space and reports on an assess-ment of word embeddings supported (i) by data in raw texts vs. in lexical graphs, (ii) by lexical information encoded in association-vs. inference-based graphs, and obtained (iii) by edge reconstruction- vs. matrix factori-sation vs. random walk-based graph embed-ding methods. The results observed with these experiments indicate that the best solutions with graph-based word embeddings are very competitive, consistently outperforming main-stream text-based ones.
1 Introduction
As neural networks are becoming a central tech-nology in natural language processing, interest on distributional semantics, with its vector space models of meaning, has been a driving factor for research on natural language semantics. When fo-cusing on the meaning of words under this ap-proach, information on lexical semantics has been sought to be encoded into appropriate vectorial representations, also known as word embeddings. The source for this information has consisted mostly of large collections of raw text, and thus ultimately on the frequencies of co-occurrence of words with other neighbouring words in certain windows of context, (Mikolov et al.,2013a; Pen-nington et al.,2014;Mikolov et al.,2018) among others. A few research trends have been gaining momentum concerning the application of neural networks to natural language technology, and a fortioriin what concerns distributional semantics. On the one hand, there has been a growing inter-est in the linguistic information that may be ulti-mately encoded in vectorial representations (
Be-linkov et al., 2017; Conneau et al., 2018), also relating to their eventual ”universality”, in view of possibly transferring these representations from one language processing task or application to an-other (Shi et al.,2016;C´ıfka and Bojar,2018).
On the other hand, growing attention has been devoted to sources of information for word embed-dings other than what may be conveyed and ex-tracted from co-occurrences in text. This includes information that is encoded in sophisticated lex-ical collections of data that are carefully crafted and densely loaded with accurate information on lexical semantics (Goikoetxea et al., 2015;Saedi et al.,2018).
The results reported in the present paper lies at the intersection of those research goals. In par-ticular, we aim here to gain a better insight into these two sources of lexical information, and the quality of the resulting word embeddings, by as-sessing how graph-based word embeddings com-pare to mainstream text-based ones. To pursue this objective, we explore an experimental space that takes into account lexical semantic networks of essentially different types as well as different sorts of methods, with different strengths, to con-vert those graphs into embeddings. In the experi-mental space that will be explored here, text-based embeddings will be represented by top performing solutions from the literature.
In the next Sections2and3, the lexical graphs and the graph embeddings techniques used are in-troduced. Each one of the following Sections 4
and5 will indicate how each graph was handled and what was the outcome of applying graph em-bedding techniques to them.
2 Lexical graphs
How to represent the meaning of words has been at the core of research on lexical semantics. Besides distributional semantics (Harris, 1954; Osgood et al.,1957) that word embeddings adhere to, two other broad families of approaches have emerged, namely those advocating that lexical semantics is better represented as a semantic network (Quillan,
1966) or as a feature-based model (Minsky,1975;
Bobrow and Norman,1975).
In a nutshell, in an inference-based seman-tic network, a lexical unit, typically a word, is recorded as a node in a graph while the semantic relations among words, such as hyponymy or syn-onymy, etc., are recorded as labelled edges among the nodes of the graph — with the inference being ensured by the relation that happen to be transitive. Feature-based models representing lexical seman-tics, in turn, resort to a hash table that stores the lexical units as keys, and the semantically related units as the respective values.
The motivation for these two families of lexical representation is to be found in their different suit-ability and success in explaining a wide range of empirical phenomena, in terms of how these are manifest in ordinary language usage and how they are elicited in laboratory experimentation. These phenomena are related to the acquisition, storage and retrieval of lexical knowledge (e.g. the spread activation effect (Meyer and Schvaneveldt,1971), the fan effect (Anderson,1974), among many oth-ers) and to how this knowledge interacts with other cognitive faculties or tasks, including categoriza-tion (Estes, 1994), reasoning (Rips, 1975), prob-lem solving (Holyoak and Koh, 1987), learning (Ross, 1984), etc. Feature-based models seek to respond primarily to our outstanding ability as speakers of associating concepts with other con-cepts, while inference-based ones seek to respond to the also outstanding ability to reason on the ba-sis of semantic relations among concepts.
In the scope of the formal and computational modelling of lexical semantics, these approaches have inspired a number of initiatives to build repositories of lexical knowledge. Prominent ex-amples of such repositories are, for semantic net-works, WordNet (Fellbaum,1998) and for feature-based models, Small World of Words (SWOW) (De Deyne et al.,2013). Interestingly, to achieve the highest quality, repositories of different types typically resort to different empirical sources of
primary data. For instance, WordNet is con-structed on the basis of lexical intuitions system-atically handled by human experts, while the in-formation encoded in Small World of Words are the associations between concepts evoked and col-lected from laypersons.
Even when motivated in the first place by (psycho-)linguistic research goals, these reposi-tories of lexical knowledge have been extraordi-narily important for language technology. They have been instrumental for major advances in lan-guage processing tasks and applications such as word sense disambiguation, part-of-speech tag-ging, named entity recognition, sentiment analysis (e.g.Li and Jurafsky(2015)), parsing (e.g.Socher et al.(2013)), textual entailment (e.g.Baroni et al.
(2012)), discourse analysis (e.g. Ji and Eisenstein
(2014)), among many others.1
In our experiments, we resort to these two ma-jor representatives of inference- and feature-based lexical networks, namely WordNet2and SWOW3.
3 Graph embedding methods
As for methods to convert graphs into embedding, we are resorting also to one outstanding represen-tative per major family of techniques.
Following the recent comprehensive survey by (Cai et al.,2017), graph embeddings methods di-vide into those that represent a whole graph as a single vector and those that output a vector for each node in the graph. For our experiments, we are interested in the latter, for which there are three major families of approaches, viz. based on edge reconstruction, on matrix factorisation and on ran-dom walks. Each of these techniques has its ad-vantages and drawbacks, capturing the informa-tion encoded in the graph with different emphasis. Graph embeddings techniques based on edge reconstruction operate on graphs represented by edge lists. An edge is a triple hlhs, rel, rhsi, where lhs (left-hand side) and rhs (right-hand) are nodes connected by a relation of typerel. The system is trained to recognise triples that are feasi-ble (present in the graph) from the infeasifeasi-ble ones. The objective function optimised in the model
1
For the vast number of applications of WordNet, see http://lit.csci.unt.edu/˜wordnet
2 Princeton’s WordNet 3.0 is the version used here,
obtained fromhttp://wordnet.princeton.edu/in February 2019.
is either maximising the edge reconstruction prob-ability or minimising the edge reconstruction loss. The latter can be further divided into distance-based loss and margin-distance-based ranking loss. Since most of the existing knowledge graph embedding methods choose to optimise margin based ranking loss (Cai et al.,2017), we choose a method from this subgroup as a representative of the edge re-construction models, namely Semantic Matching Energy (SME) from (Bordes et al.,2014).
Edge reconstruction methods support a rela-tively efficient training, but ensures optimisation using only local information between nodes close to each other.
Another family of graph embedding methods is based, in turn, on graphs represented by matrices. This is perhaps the family of techniques with the largest number of instances, which in many cases result from slight variants from one another in the tricks used to weight and condense the nodes in the matrix.
As a representative of the matrix factorisation methods for graph embedding, we use the so-called Katz index (Newman, 2010, Eq. (7.63)) as this is the technique used in previous works on WordNet (Saedi et al., 2018) and on SWOW (De Deyne et al.,2018).
This method starts by creating a matrix with all of the possible semantic relations between all the words, resulting in an adjacency matrixM. Then it populates each cellMij of the matrix resorting to a lexical semantic graphG. Each cellMijis set to 1 if and only if there is a direct edge between nodes including the two wordswordi andwordj the cell represents. If there is no edge between the two words, that cell is set to 0. For all nodes not directly connected, that is connected through other nodes in between, the representation of their affinity strength is obtained by following the cu-mulative iteration:
MGn=I+αM +α2M2+· · ·+αnMn (1)
Mnis the matrix where every two words,wordi andwordj, are transitively related bynedges. I represents the identity matrix and α is used as a decay factor for longer paths.
The iteration converges into the matrixMG, ob-tained by an inverse matrix operation:
MG= ∞
X
e=0
(αM)e= (I−αM)−1 (2)
Matrix factorisation inverts the trade off found with edge reconstruction methods. Differently from the latter, it is able to take into account the affinity between nodes at the global level of the graph, but at the cost of a large time and space consumption though.
A third family of graph embedding methods is based on a ”text” generated from graphs, where the word embeddings are obtained from some deep learning technique used over that text. This is an ”artifical” text that results from concatenating the words in the nodes that are visited in a random walk through the edges in the graph.
Starting at a random node in the graph, at each iteration, this technique randomly chooses a neighbour node (with a probability α) to be the starting point of the next iteration or stopping the walk (with a probability 1 -α) .
Improving over the matrix factorisation and the edge reconstruction approaches, the random walk technique is effective and accommodates global information on the nodes. However, as it only con-siders the local context within a path at each itera-tion, that makes it hard to find an optimal sampling strategy.
In the next Sections, we report on the appli-cation of these three different graph embedding techniques, with their different advantages and drawbacks, over the two lexical networks, from two distinct lexical semantic families, thus encod-ing lexical knowledge from quite distinct primary sources of empirical data. This leads to differ-ent word embeddings that encode and emphasise different shades of lexical information, thus con-tributing to an encompassing and discriminating experimental space.
4 Inference-based graph embeddings
This section describes the conversion of WordNet to word embeddings under each of the three graph embedding techniques.
4.1 Edge reconstruction
In models based on edge reconstruction, the ob-jective is to rank a true triplethlhs, rel, rhsiover a false triplethlhs0, rel, rhs0i that does not exist in the graph. Under the SME technique (Bordes et al.,2014) we are following here, this is achieved by designing an energy functionfrel(lhs, rhs), in-terpreted as a distance between the nodeslhsand
en-ergy value should be lower for feasible triplets and higher for infeasible ones. SME seeks to minimise the margin-based ranking loss, defined as:
Orank = min
X
hlhs,rel,rhsi∈S hlhs0,rel,rhs0i∈/S
max 0, γ+frel(lhs, rhs)
−frel(lhs0, rhs0)
(3)
whereγ is the margin size (set by default to 1). The SME function is designed as a neural net-work that first combines the nodes separately with the relation type, putting the combinations of hlhs, reli and hrel, rhsi in a common space, where they can bematched. The matching is per-formed using a dot product of the resulting vec-tors. The combination function comes in two flavours: linear and bilinear. We opted for the former here given its lower complexity.
The triples were generated in the following manner: for each wordwlhsin the vocabulary and for each synsetslhsthis word belongs to, a triple is generated for each wordwrhs in each synsetsrhs (thatwrhs belongs to), such that there exists a re-lationrelbetween synsetsslhsandsrhs, and both
wlhsandwrhsare in the vocabulary.
rel is one of the semantic relations used in WordNet.4 Three of these relation types, namely antonym, derivationally related form, and per-tainymexist not between synsets, but directly be-tween the word forms (lemmas). These were also taken into account to generate triples.5
For training, we used a publicly available imple-mentation of SME.6The models were trained for 500 epochs, with evaluation at every 10 epochs, a learning rate of 0.01 and 200 batches. The re-maining parameters were left the same as the de-fault ones used inBordes et al.(2014). The model with the best performance on the validation set was picked.
Since the the edge reconstruction based meth-ods are retaining the local neighbourhood only, we experimented also with extending the data sets by generating relations resulting from the concatena-tion of two simple relaconcatena-tions. The data sets created in this way, however, suffer from an exponential growth in size. Due to resource limitations, we
4
For a list of relation types, seehttp://wordnet. princeton.edu/documentation/wninput5wn.
5
To extract the data from the WordNet 3.0 files, we used the NLTK library, available at www.nltk.org/ _modules/nltk/corpus/reader/wordnet.html.
6http://github.com/glorotxa/SME.
managed to conduct the experiments on a 15k vo-cabulary only, which gave significant boost in the performance of the model on the evaluation tasks. Further exploration of this path could be benefi-cial, but needs to be left for future work.
For a fair comparison with other methods, the data used for training the models is based though on the same 60k vocabulary as in the matrix fac-torisation based method (see details in Section
4.2), and thus eventually restricted to 1-hop rela-tions. The vocabulary was selected with the same procedure as inSaedi et al. (2018). Also for the sake of comparison with the other experiments with text-based embeddings available from the lit-erature (see details in Section6), we chose vectors of dimension 300. Since there is a random ele-ment in the system (the initialisation of the neural network), we trained three models using different seeds for the random number generator and aver-aged the results.
4.2 Matrix factorisation
For matrix factorisation, we started by building an adjacency matrix from WordNet 3.0, which pro-duced a square matrix of a size above 155k.
Tests with different weights for each type of relation — namely hyponymy and hyperonymy weighing the most, — showed that symmetrical weights performed the best. Also the parameters in equation2and other options to tackle computa-tional complexity were empirically determined in and taken fromSaedi et al.(2018).
The matrix inversion raises substantial chal-lenges in terms of the memory footprint. To cope with this issue, we resorted to sub-graphs of Word-Net of manageable size, and we will be using here a vocabulary with 60k words. To mitigate the im-pact of this downsizing, we sorted the words by the decreasing number of outgoing edges in the graph and picked the 60k top ones.
Another parameter to consider is the decay value (α) in equation 2, which discounts the strength of a connection if the nodes are far away from each other in the graph. Several values forα
were experimented with, with 0.75 performing the best, which is also the value forαwe used here.
Compo-nent Analysis (PCA) was applied to reduce the di-mension of the vectors.
This procedure was evaluated with different vector sizes by Saedi et al. (2018), namely 100, 300, 850, 1000 and 3000, with 850 performing the best. For the sake of comparability with the other models we resort to, namely the text-based ones, we set a vector size of 300 for the matrix factori-sation embedding technique.
4.3 Random walk
The random walk was based on UKB (Agirre and Soroa,2009;Agirre et al.,2014;Goikoetxea et al.,
2015), which performs a random walk through edges on graphs and in each step writes a word in the node into an artificial text. With the re-sulting corpus, a two-layer neural network model (Skip-Gram) (Mikolov et al., 2013b) was trained to predict for each vocabulary word its neighbour-ing words, thus generatneighbour-ing in one of the layers the resulting word embedding vectors.
We restricted the original technique to use only the information from the graph and to ignore the glosses. The random walk was applied to the same WordNet graph (60k vocabulary) described in the Sections4.1and4.2.
We discarded the three lemma-lemma relations not supported by UKB, namely antonym, deriva-tionally related form, pertainym.
To create the artificial corpus, we used the de-fault UKB random walk parameters7and to obtain the word embeddings, we used the default Gen-sim’s (Reh˚uˇrek and Sojkaˇ , 2010) Skip-Gram im-plementation, with a vector dimension of 300.
4.4 Results
The assessment of the word embeddings obtained from the conversion of lexical graphs use the same tasks used for this purpose when the embeddings are obtained from corpora. These tasks consist in predicting the semantic similarity and the seman-tic relatedness between words in pairs and in seek-ing to match the gold scores assigned by humans to those test pairs. The cosine between the vectors of the words in a pair is mapped into the scale used for the gold scores.
For semantic similarity, we resorted to the test sets SimLex-999 (with 999 pairs) (Hill et al.,2016), WordSim-353-Similarity (203 pairs) (Agirre et al., 2009) and RG1965 (65) (
Ruben-7http://github.com/asoroa/ukb/
stein and Goodenough,1965). For semantic relat-edness, WordSim-353-Relatedness (252) (Agirre et al., 2009), MEN (3000) (Bruni et al., 2012) and MTURK-771 (771) (Halawi et al.,2012) were used.
The results with WordNet embeddings are dis-played in Table1.8
Edge Factor. Walk
Similarity
Simlex-999 39.63±1.55 49.90 50.93±0.15 WordSim-353 54.93±2.31 50.80 67.40±0.30 RG1965 57.70±4.84 57.00 77.50±0.95
Relatedness
WordSim-353 26.20±4.10 30.90 28.43±0.76 MEN 39.67±2.55 45.00 52.17±0.70 MTurk-771 42.40±1.25 52.80 52.90±0.50
Table 1: Performance of WordNet embeddings (columns) over test sets (rows) in terms of Spearman’s Correlation Coefficient (higher is better), with devia-tion from averaging over three runs indicated where relevant. Bold denotes best results.
5 Feature-based graph embeddings
This section describes the conversion of SWOW to word embeddings under each of the three graph embedding techniques.
5.1 Edge reconstruction
The data for the application of the SME method was generated on the basis of the associative strength among words, described in detail in
De Deyne et al. (2018). The vocabulary was re-stricted to their 12 216 cue words.
The relations were generated with the support of the associative strength files that were generated by using the publicly available implementation.9 The strength file is generated for three association types separately (R1, R2, R3), which induced the three relation types taken into by the SME method with SWOW.
We used the same implementation and method-ology as in Section4.1. We empirically chose a smaller interval between the evaluations (every 5
8The coverage of the test sets is the following: 100% of
Simlex-999; 100% WordSim-353 S; 98.0% RG1965; 97.6% WordSim-353 R; 83.4% MEN; 99.9% MTurk-771.
9http://github.com/SimonDeDeyne/
epochs instead of 10) and a lower learning rate (0.001 instead of 0.01) for a better training qual-ity. The validation and test sets each made up for around 5% of the data set. For the sake of compar-ison, we again chose the vector size of 300.
Similarly, as in Section 4.1, we trained three models and average the results.
5.2 Matrix factorisation
We follow the same methodology, data and imple-mentation inDe Deyne et al.(2018). The data set contained 12 216 cue words, a shorter vocabulary and matrix than the one selected from WordNet.
The data is pre-processed before generating the adjacency matrix, where the cue words and re-sponses are spell-checked, and the adjustment of capitalisation and americanisms takes place. From the cue-response data, only 100 participants for each cue are considered. Since each participant responded with three associated tokens, this asso-ciates each cue with 300 word instances.
The adjacency matrix was then created similarly to the matrix factorisation of WordNet in section
4.2, yielding a square matrixAG, with every word displayed in the rows and in the columns. The cellAGijcontains the associative strength of word
iwith word j, obtained from the frequency with which wordjis responded when wordiis cued.
The adjacency matrix is factorised using the same parameters as described in Section 4.2, namely with the decay factor α set at 0.75, and with a vector dimension of 300. Due to the small, 12k vocabulary available here, no extraction of a subset was necessary as it formed a data set com-putationally manageable.
The processing of the output matrix is also the same as in section 4.2, with an application of PMI+ to reduce frequency bias and PCA for di-mension reduction.
5.3 Random walk
The random walk used the same technique as used for the inference-based graph, in Section4.3.
The SWOW data set described in the previous Sections 5.1 and 5.2 was converted into a graph input for UKB. Each word in the vocabulary was considered a node. Each relation from a SWOW cue word to the associated word was considered as a relation between nodes. With the resulting graph, we created the artificial corpus by using the default UKB random walk parameters. To obtain
the word embeddings, we used the default Gen-sim’s Skip-Gram implementation (Reh˚uˇrek andˇ Sojka,2010) with vectors of dimension 300.
5.4 Results
The results with SWOW embeddings are dis-played in Table2.10
Edge Factor. Walk
Similarity
Simlex-999 54.13±6.20 67.80 69.33±0.06 WordSim-353 77.07±4.76 85.00 84.53±0.06 RG1965 83.50±4.50 92.90 90.23±0.49
Relatedness
WordSim-353 70.70±3.68 79.30 77.73±0.23 MEN 78.50±3.90 87.20 84.27±0.06 MTurk-771 74.77±4.21 80.90 81.10±0.17
Table 2: Performance of SWOW embeddings (columns) over test sets (rows) in terms of Spearman’s Correlation Coefficient (higher is better).
6 Discussion
The results in the Sections above were obtained with word embeddings whose source of informa-tion are specifically designed and carefully cu-rated lexical collections whose primary empirical source of data are human lexical intuitions elicited and gathered under a tightly controlled experimtal protocol. This range of results should be en-larged with results obtained also with word em-beddings that have, as the source of lexical in-formation, collections of raw texts that were pro-duced with purposes other than to serve specifi-cally for word embeddings.
6.1 Text-based embeddings
For this purpose, we resort to mainstream text-based word embeddings. For a fair comparison, we focus on embeddings that rely solely on lexi-cal information, thus not possibly enhanced with supra-lexical information, like for instance De-pendency word embeddings (Levy and Goldberg,
2014), etc. The three word embeddings selected are Glove (Pennington et al., 2014),11 word2vec
10The coverage of the test sets is the following: 99.6% of
Simlex-999; 83.1% WordSim-353 S; 90.6% RG1965; 87.3% WordSim-353 R; 89.4% MEN; 93.2% MTurk-771.
11 These embeddings have Vectors of dimension 300
(Mikolov et al.,2013a),12 and fastText (Mikolov et al.,2018).13
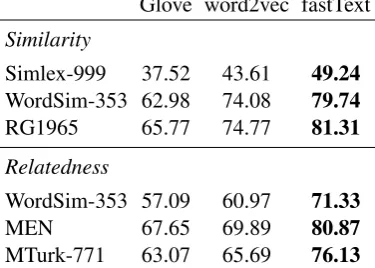
The evaluation results for these text-based word embeddings are displayed in Table3.
Glove word2vec fastText
Similarity
Simlex-999 37.52 43.61 49.24
WordSim-353 62.98 74.08 79.74
RG1965 65.77 74.77 81.31
Relatedness
WordSim-353 57.09 60.97 71.33
MEN 67.65 69.89 80.87
MTurk-771 63.07 65.69 76.13
Table 3: Performance of text-based embeddings (columns) over test sets (rows) in terms of Spearman’s Correlation Coefficient (higher is better).
The word embeddings trained with a 600B to-ken collection of texts, fastText, outperforms the other ones trained with 100B (word2vec) and 840B (Glove) token collections.
6.2 Analysis
The experimental space explored gave rise to the range of results displayed in Tables1to3. We dis-cuss in turn the observed impact of different graph embedding techniques, different lexical graphs, and different sources of lexical information.
The edge reconstruction technique consistently delivers the worst results across all lexical graphs and test sets. The top position, in turn, is shared by the random walk and matrix factorisation meth-ods. While the former originates the best results with WordNet for most test sets, the latter does so with SWOW.
A possible explanation for this contrast may lie in that the systematic and exhaustive structuring of WordNet with regards the semantic knowledge pertaining to a given node of the graph may mit-igate (more than SWOW does) the known
draw-http://nlp.stanford.edu/projects/glove/ in February 2019.
12 These embeddings have Vectors of dimension 300
trained over 100B Token text. They were obtained from http://code.google.com/archive/p/ word2vec/on 22/04/2019.
13 These embeddings have Vectors of dimension
300 trained over 600B Token text. They were ob-tained from http://fasttext.cc/docs/en/ english-vectors.htmlon 22/04/2019.
back of the random walk in terms of not ensuring an optimal sampling strategy.14
In the reverse direction, a factor that may be favouring matrix factorisation with SWOW may lie in that the systematic coverage of all the paths within the graph ensured by that technique may mitigate (more than random walk does) the less systematic nature of the lexical knowledge en-coded in an association-based graph, like SWOW. In what concerns comparison among lexical graphs, in turn, SWOW stands out as support-ing results consistently far better for every test set than the ones supported by WordNet, with a range of deltas that go from 20% (15 points) with RG1965, to 159% (48 points) with WordSim-353 Relatedness. It is also interesting to note that the largest deltas are observed with data sets that test semantic relatedness, with deltas from 53% (28 points) with MTurk-771 to 159% (48 points) with WordSim-353, than with data sets for seman-tic similarity, with deltas from 20% (15 points) with RG1965, to 36% (18 points) with Simlex-999. This seems to indicate that the lexical knowl-edge necessary to solve the semantic tasks embod-ied in these test sets is better encoded in SWOW than in (a subset of) WordNet.
We look now into the impact of different sources of empirical data that inform word embeddings. While the best scores of text-based consistently outperform the best scores of WordNet embed-dings, they are though consistently outperformed by the best scores of SWOW embeddings, with a range of deltas that go from 7% (5 points) with MTurk-771, to 41% (20 points) with Simlex-999. It is also interesting to note that the largest deltas are observed this time with data sets that test similarity, with deltas from 7% (5 points) with WordSim-353 Similarity to 41% (20 points) with Simlex-999, than with data sets for relatedness, with deltas from 8% (6 points) with MEN, to 11% (8 points) with WordSim-353 Relatedness.
As usual, this type of results needs to be taken with a prudent grain of salt. The kind of individual scores registered above depend on the size of the supporting data sets, be they graph- of text-based embeddings, and are expected to improve as the data sets get larger. Nevertheless, the patterns
ob-14
served with this experimental space seems to pro-vide a clear indication that graph-based embed-dings are very competitive, with the best scoring solutions consistently outperforming mainstream text-based ones by a substantial margin.
It is of note that this is obtained with data sets of a much smaller size (12k) than the ones used for text-based embeddings (600B) — whose col-lection can be obtained with quite affordable costs in the case of SWOW, the graph that is informing the top-performing embeddings.
7 Related Work
There have been some publications pioneering the issue of obtaining word embeddings from lexical semantic networks. Each has focused though on a particular graph embedding technique or in a par-ticular lexical graph, and thus a systematic study of graph embeddings under comparable settings was not undertaken, anda fortiori a comparative assessment of their strengths with regards text-based ones is also lacking.
The application of Katz index for matrix factori-sation was undertaken byDe Deyne et al.(2016) over SWOW and by Saedi et al. (2018) over a WordNet subset. These are the results from pre-vious works that we follow more closely here.
The graph embedding SME technique based on edge reconstruction was pioneered byBordes et al.
(2014), who applied it to a small WordNet subset restricted to 1-hop relations, which we expanded in the experiments reported here.
The random walk methods for graph embed-dings were experimented with byGoikoetxea et al.
(2015) over full WordNet. This however does not represent a ”purely” graph-based approach given the raw text in the glosses was also used. In our implementation here, the embeddings were based solely on the information in the graph.
In this connection, it is worthy of note the work byHughes and Ramage(2007), which resorts also to random graph walks over WordNet. Differ-ently, from the goal here, its goal was to obtain word-specific stationary probability distributions — such that the semantic affinity of two words is based on the similarity of their probability distri-butions —, rather than to obtain vectorial repre-sentations for words.
It is also worth mentioning that the task of deter-mining the semantic similarity between two words can be performed not only on the basis of the
distance of their respective vectors in a semantic space, but also on the basis of the distance of the respective concepts in the semantic network itself. There has been a research tradition on this issue whose major proposals include (Jiang and Con-rath, 1997; Lin, 1998; Leacock and Chodorow,
1998; Hirst and St-Onge, 1998; Resnik, 1999) a.o., which received nice comparative assessments in (Ferlez and Gams,2004) and (Budanitsky and Hirst, 2006). The focus of the present paper, though, is rather on vectorial representations and semantic distances based on them.
8 Conclusions
This paper reports on the insights gained on word embeddings with an experimental space that sys-temically explored empirical data from radically different sources (raw texts vs. lexical graphs), lexical information encoded in graphs from es-sentially different paradigms of lexical semantics (association- vs. inference-based), and methods to obtain vectorial representations of the nodes in graphs from each major family of graph embed-ding techniques (edge reconstruction- vs. matrix factorisation vs. random walk-based). Follow-ing mainstream practice, the resultFollow-ing embeddFollow-ings were evaluated for semantic similarity and related-ness prediction tasks.15
The results obtained permit to observe a clear pattern indicating that the best scoring solu-tions with graph embeddings are very competi-tive, consistently outperforming mainstream text-based ones by a substantial margin. They indicate also that the graphs that are informing the top-performing word embeddings are of a type that can be obtained with quite affordable costs, as they be-long to the family of feature-based lexical graphs, which can be collected from lexical associations evoked from laypersons.
In future work, it will be interesting to study how the distinct performance of word embeddings that are informed by different empirical data and embedding methods may have an equally distinc-tive impact into downstream tasks that take pre-trained word embeddings as input.
15The code and data sets used in this paper can be found
Acknowledgements
The research results presented here were sup-ported by PORTULAN CLARIN Infrastructure for the Science and Technology of Language, by the National Infrastructure for Distributed Computing (INCD) of Portugal, and by the ANI/3279/2016 grant.
References
Eneko Agirre, Enrique Alfonseca, Keith Hall, Jana Kravalova, Marius Pas¸ca, and Aitor Soroa. 2009. A study on similarity and relatedness using distri-butional and wordnet-based approaches. In Pro-ceedings of The Annual Conference of the North American Chapter of the Association for Computa-tional Linguistics and Human Language Technolo-gies Conference (NAACL-HLT2009), pages 19–27. Association for Computational Linguistics.
Eneko Agirre, Oier L´opez de Lacalle, and Aitor Soroa. 2014. Random walks for knowledge-based word sense disambiguation. Computational Linguistics, 40(1):57–84.
Eneko Agirre and Aitor Soroa. 2009. Personalizing pagerank for word sense disambiguation. In Pro-ceedings of the 12th Conference of the European Chapter of the Association for Computational Lin-guistics, pages 33–41. Association for Computa-tional Linguistics.
John Robert Anderson. 1974. Retrieval of proposi-tional information from long-term memory. Cogni-tive Psychology, 6(4):451–474.
Marco Baroni, Raffaella Bernardi, Ngoc-Quynh Do, and Chung-chieh Shan. 2012. Entailment above the word level in distributional semantics. In Proceed-ings of the 13th Conference of the European Chap-ter of the Association for Computational Linguistics (EACL2012), pages 23–32. Association for Compu-tational Linguistics.
Yonatan Belinkov, Nadir Durrani, Fahim Dalvi, Has-san Sajjad, and James Glass. 2017. What do neu-ral machine translation models learn about morphol-ogy? InProceedings of the 55th Annual Meeting of the Association for Computational Linguistics (Vol-ume 1: Long Papers), pages 861–872, Vancouver, Canada. Association for Computational Linguistics.
Daniel G. Bobrow and Donald Arthur Norman. 1975. Some principles of memory schemata. In Represen-tation and Understanding: Studies in Cognitive Sci-ence, page 131–149. Elsevier.
Antoine Bordes, Xavier Glorot, Jason Weston, and Yoshua Bengio. 2014. A semantic matching energy function for learning with multi-relational data. Ma-chine Learning, 94(2):233–259.
Elia Bruni, Gemma Boleda, Marco Baroni, and Nam-Khanh Tran. 2012. Distributional semantics in tech-nicolor. InProceedings of the 50th Annual Meet-ing of the Association for Computational LMeet-inguistics (ACL2012), pages 136–145. Association for Compu-tational Linguistics.
Alexander Budanitsky and Graeme Hirst. 2006. Eval-uating wordnet-based measures of lexical semantic relatedness. Computational Linguistics, 32(1):13– 47.
Hongyun Cai, Vincent W. Zheng, and Kevin Chen-Chuan Chang. 2017. A comprehensive survey of graph embedding: Problems, techniques and appli-cations.IEEE Transactions on Knowledge and Data Engineering.
Alexis Conneau, German Kruszewski, Guillaume Lample, Lo¨ıc Barrault, and Marco Baroni. 2018. What you can cram into a single vector: Probing sen-tence embeddings for linguistic properties.
Ondˇrej C´ıfka and Ondˇrej Bojar. 2018. Are BLEU and meaning representation in opposition?
Simon De Deyne, Daniel J Navarro, and Gert Storms. 2013. Better explanations of lexical and seman-tic cognition using networks derived from continued rather than single-word associations. Behavior Re-search Methods, 45(2):480–498.
Simon De Deyne, Danielle J Navarro, Amy Perfors, Marc Brysbaert, and Gert Storms. 2018. The “small world of words” english word association norms for over 12,000 cue words.Behavior research methods, pages 1–20.
Simon De Deyne, Amy Perfors, and Daniel J Navarro. 2016. Predicting human similarity judgments with distributional models: The value of word associ-ations. In Proceedings of the 26th International Conference on Computational Linguistics (COL-ING2016), pages 1861–1870.
William K Estes. 1994. Classification and Cognition. Oxford University Press.
Christiane Fellbaum, editor. 1998. WordNet: An Elec-tronic Lexical Database. MIT Press.
Jure Ferlez and Matjaz Gams. 2004. Shortest-path se-mantic distance measure in wordnet v2.0. Informat-ica, 28:381–386.
Guy Halawi, Gideon Dror, Evgeniy Gabrilovich, and Yehuda Koren. 2012. Large-scale learning of word relatedness with constraints. In Proceedings of the 18th ACM SIGKDD International Conference on Knowledge Discovery and Data Mining, pages 1406–1414. ACM.
Zellig S Harris. 1954. Distributional structure. Word, 10(2-3):146–162.
Felix Hill, Roi Reichart, and Anna Korhonen. 2016. Simlex-999: Evaluating semantic models with (gen-uine) similarity estimation. Computational Linguis-tics, 41:665–695.
G. Hirst and D. St-Onge. 1998. Lexical chains as rep-resentations of context for the detection and correc-tion of malapropisms. In C. Fellbaum, editor, Word-Net: An Electronic Lexical Database, pages 305– 332. MIT Press.
Keith J Holyoak and Kyunghee Koh. 1987. Surface and structural similarity in analogical transfer. Mem-ory & Cognition, 15(4):332–340.
Thad Hughes and Daniel Ramage. 2007. Lexical se-mantic relatedness with random graph walks. In
EMNLP-CONLL2007, Prague, Czech Republic.
Yangfeng Ji and Jacob Eisenstein. 2014. Represen-tation learning for text-level discourse parsing. In
Proceedings of the 52nd Annual Meeting of the As-sociation for Computational Linguistics (ACL2014), pages 13–24. Association for Computational Lin-guistics.
J. Jiang and D. Conrath. 1997. Semantic similar-ity based on corpus statistics and lexical taxonomy. InProceedings on International Conference on Re-search in Computational Linguistics.
C. Leacock and M. Chodorow. 1998. Combining local context and wordnet similarity for word sense iden-tification. In C. Fellbaum, editor,WordNet: An Elec-tronic Lexical Database, pages 265–285. MIT Press.
Omer Levy and Yoav Goldberg. 2014. Dependency-based word embeddings. InProceedings of the 52nd Annual Meeting of the Association for Computa-tional Linguistics (Volume 2: Short Papers), vol-ume 2, pages 302–308.
Jiwei Li and Dan Jurafsky. 2015. Do multi-sense em-beddings improve natural language understanding?
arXiv preprint arXiv:1506.01070.
D. Lin. 1998. An information-theoretic definition of similarity. In Proceedings of 15th International Conference on Machine Learning.
David E Meyer and Roger W Schvaneveldt. 1971. Fa-cilitation in recognizing pairs of words: Evidence of a dependence between retrieval operations. Journal of Experimental Psychology, 90(2):227.
Tomas Mikolov, Kai Chen, Greg Corrado, and Jef-frey Dean. 2013a. Efficient estimation of word representations in vector space. arXiv preprint arXiv:1301.3781. https://code.google.
com/archive/p/word2vec/.
Tomas Mikolov, Edouard Grave, Piotr Bojanowski, Christian Puhrsch, and Armand Joulin. 2018. Ad-vances in pre-training distributed word representa-tions. InProceedings of the International Confer-ence on Language Resources and Evaluation (LREC 2018).
Tomas Mikolov, Ilya Sutskever, Kai Chen, Greg S Cor-rado, and Jeff Dean. 2013b. Distributed representa-tions of words and phrases and their compositional-ity. InAdvances in Neural Information Processing Systems 26, pages 3111–3119.
Marvin Minsky. 1975. A framework for represent-ing knowledge. InPsychology of Computer Vision. McGraw-Hill.
Mark Newman. 2010.Networks: An Introduction. Ox-ford University Press.
Charles E Osgood, George J Suci, and Percy H Tan-nenbaum. 1957. The measurement of meaning. Ur-bana: University of Illinois Press.
Jeffrey Pennington, Richard Socher, and Christo-pher D. Manning. 2014. GloVe: Global vectors for word representation. InEmpirical Methods in Nat-ural Language Processing (EMNLP), pages 1532– 1543.
M Ross Quillan. 1966. Semantic memory. Technical report, Bolt Beranek and Newman Inc., Cambridge MA.
Radim ˇReh˚uˇrek and Petr Sojka. 2010. Software frame-work for topic modelling with large corpora. In Pro-ceedings of the LREC 2010 Workshop on New Chal-lenges for NLP Frameworks, pages 45–50. European Language Resources Association.
P. Resnik. 1999. Semantic similarity in a taxonomy: An information-based measure and its application to problems of ambiguity in natural language. Journal of Artificial Intelligence Research, 11.
Lance J Rips. 1975. Inductive judgments about natural categories. Journal of Verbal Learning and Verbal Behavior, 14(6):665–681.
Brian H Ross. 1984. Remindings and their effects in learning a cognitive skill. Cognitive Psychology, 16(3):371–416.
Herbert Rubenstein and John B Goodenough. 1965. Contextual correlates of synonymy. Communica-tions of the ACM, 8(10):627–633.
Xing Shi, Inkit Padhi, and Kevin Knight. 2016. Does string-based neural MT learn source syntax? In Pro-ceedings of the 2016 Conference on Empirical Meth-ods in Natural Language Processing, pages 1526– 1534, Austin, Texas. Association for Computational Linguistics.