• No results found

<p>Estimation of Cardiovascular Risk from Self-Reported Knowledge of Risk Factors: Insights from the Minnesota Heart Survey</p>

N/A
N/A
Protected

Academic year: 2020

Share "<p>Estimation of Cardiovascular Risk from Self-Reported Knowledge of Risk Factors: Insights from the Minnesota Heart Survey</p>"

Copied!
9
0
0

Loading.... (view fulltext now)

Full text

(1)

O R I G I N A L R E S E A R C H

Estimation of Cardiovascular Risk from Self-Reported

Knowledge of Risk Factors: Insights from the

Minnesota Heart Survey

This article was published in the following Dove Press journal: Clinical Epidemiology

Sue Duval1

Jeremy R Van’t Hof1 Lyn M Steffen2

Russell V Luepker2

1Cardiovascular Division, University of Minnesota Medical School, Minneapolis, MN, USA;2Division of Epidemiology and Community Health, School of Public Health, University of Minnesota, Minneapolis, MN, USA

Background:Cost-effective primary prevention of cardiovascular disease (CVD) relies on accuracy of risk assessment. Current risk scores require clinical and laboratory measures, are

expensive and are often difficult to apply in the population setting.

Objective:This study sought to estimate CVD risk from individuals’ knowledge of their own CVD risk factors and compare it to the risk calculated from measured risk factors.

Methods: Using the ACC/AHA Pooled Cohort Risk Equations (PCE), we calculated 10-year

CVD risk for 9856 primary prevention individuals aged 40–79 in the Minnesota Heart Survey

(MHS). Using log-linear regression models, we estimated PCE risk from the individual’s

self-reported knowledge of four dichotomous risk factors: hypertension, hypercholesterolemia, dia-betes, and smoking. Age was included in all models, and models were developed separately in women and men. Model performance was assessed internally using leave-one-out cross-validation.

Results:The median measured PCE CVD risk in women was 2.1% (IQR: 0.8–5.6%), and in

men was 6.3% (3.1–13.0%). Using the newly developed equations, the median estimated risk

was 2.2% (0.9–5.8%) in women, and 6.9% (3.2–13.1%) in men. Using a threshold of 7.5% to

categorize low and high risk, the novel risk calculation gave an accuracy of 95% for women and 87% for men compared to the measured PCE risk. The negative predictive value was 97% for women and 91% in men.

Conclusion:Self-reported knowledge of risk may be useful in the identification of indivi-duals at low risk for CV events, however, should always be followed up with measurement of risk factors if symptoms or history suggest CVD.

Keywords:cardiovascular diseases, epidemiology, risk assessment, risk factors, self-report, survey

Introduction

There are a growing number of self-assessment tools for prediction of risk for many different health conditions. They are designed to alert, educate, and change beha-vior, or direct people to health-care professionals. Historically these were paper and pencil tests given in clinics or community screenings, but they are now most often web-based, with some available on mobile phones.1These self-assessments range from symptom analysis to calculation of disease risk.

Risk self-assessment surveys are widely used, as evidenced by the British tool for web-based cardiovascular risk calculation which was accessed 1.4 million times and taken by 575,782 users over 5 months in 2015.2 However, many of these assessments, which often result in some type of “risk or health score”, can be in

Correspondence: Sue Duval Cardiovascular Division, University of Minnesota Medical School, 420 Delaware Street SE, MMC 508, Minneapolis, MN 55455, USA

Tel +1612 624 3392 Fax +1612 626 4411 Email [email protected]

Clinical Epidemiology

Dove

press

open access to scientific and medical research

Open Access Full Text Article

Clinical Epidemiology downloaded from https://www.dovepress.com/ by 118.70.13.36 on 24-Aug-2020

(2)

error and misinterpreted. Self-misclassification can lead to inappropriate reassurance, whereas self-referral to health care for additional evaluation can lead to unnecessary expenses or treatment. Individuals may give answers they believe to be best, misinterpret the questions or not have actual data to enter.

Self-assessment of cardiovascular disease (CVD) risk is among the most common of these tools.3,4Individuals with-out CVD can use these tools to predict their individual 10-year risk of a cardiovascular event. The Framingham Risk Score had been the tool of choice for many years.4 The American Heart Association/American College of Cardiology Pooled Cohort Equations (PCE) risk calculator is also now widely available and designed for use in those with no history of CVD, and an LDL-C <190 mg/dl.3The PCE predict 10-year risk of coronary death, nonfatal myo-cardial infarction, fatal or nonfatal stroke. The PCE have been incorporated in national guidelines for CVD risk man-agement for aspirin, hypertension and lipids.

The PCE risk calculator, however, will not calculate risk if any of the input values are missing. In a study by Van’t Hof et al,5 only 43% of a primary prevention clinic population had com-plete data to allow PCE risk calculation using electronic health record data. The electronic health record data did contain ICD-9 CM diagnostic codes for hypertension and hyperlipidemia, which, had they been incorporated, might have allowed many more individuals to be assessed. When risk assessment is not properly performed, high-risk individuals may be undertreated or low-risk individuals may inappropriately undergo a low-value screening test. As well, survey-based research assessing CVD risk becomes more expensive when laboratory and anthropo-metric data are required to complete the calculations.

Thus, this study was designed to evaluate a simpler for-mat of CVD risk assessment using self-reported data on cardiovascular risk factors and demographics. We analyzed a random population sample of adults ages 40–79 years who answered questions about knowledge of their own cardio-vascular risk factors, and who had blood pressure and cho-lesterol directly measured in a controlled research setting. In these analyses, we use regression methods to predict PCE risk using only participants’knowledge of risk.

Methods

Sample

The Minnesota Heart Survey (MHS) is a population-based, serial cross-sectional study that assesses trends in car-diovascular disease risk factors in non-institutionalized

resident adults aged 25 to 74 years in the Minneapolis/St. Paul (MSP) metropolitan area (2010 Census, 2.85 million).6 The MHS has completed six surveys (1980–1982, 1985–1987, 1990–1992, 1995–1997, 2000–2002, and 2007–2009). The MSP population is predominantly white and has slightly higher levels of education and employment than the United States population. MHS sampling was designed to obtain a random sample of the target population, using a two-stage cluster design created from census maps. The 7-county metro-politan area was divided into over 700 clusters of approxi-mately 1000 households each. Forty clusters were randomly selected and used for each survey with a sample of households randomly selected from within each cluster. The census maps were updated before each survey to account for new housing developments and sampling was adjusted accordingly. In 1995, four clusters were added to represent new population growth and in 2007, three more clusters were added for a total of 47. Once a house was selected, it was removed from sampling in future surveys. After an introductory letter, selected households were visited by a trained interviewer who performed a household enumeration with those eligible selected for the survey. For this analysis, we used the com-bined MHS data from 1985 to 2009.

Measurements in MHS

Participants first took part in a home interview where interviewers collected data on demographic characteristics, cardiovascular medical history and risk factors, knowledge of cardiovascular risk factors, dietary habits, physical activity levels, health insurance coverage, access to a regular physician, self-rated health, smoking practices, and use of cardiovascular medications and dietary supple-ments. Participants were then invited to take part in a clinic visit. Data collected during the clinic visit included physiological measures such as anthropometric measure-ments, blood pressure, medical and reproductive history, and detailed questionnaires regarding diet, physical activ-ity and smoking. Participants also underwent a non-fasting blood draw to assess serum total cholesterol and HDL cholesterol levels.

Each individual was asked four questions in their home to ascertain knowledge of risk:“Have you ever been told by a doctor or other health professional that you had high blood pressure?”;“Have you ever been told by a doctor or other health professional that you had high cholesterol?”;

“Have you ever been told by a doctor or other health professional that you had diabetes?”; and for smoking,

“Do you smoke at present?”. Responses to these questions

Clinical Epidemiology downloaded from https://www.dovepress.com/ by 118.70.13.36 on 24-Aug-2020

(3)

were either yes, no or do not know. We combined the negative responses, and any missing values, into a single category to represent no. Thus, possible numerical values for the individual risk factors were 0 and 1, and their sum took on values of 0–4, with 0 indicating that the partici-pant reported having none of the four risk factors, to four where the participant responded as having all four risk factors.

The PCE 10-year CVD risk was calculated for each individual with complete data for each of the risk score components (n=9856). Cholesterol was missing in 354 (3%) participants and systolic BP in 316 (3%). Individuals with total cholesterol <130 or >320; or HDL cholesterol <20 or >100; or SBP <90 or >200; or DBP <30 or >140 were excluded, because there are insufficient data to reliably predict risk in these cases.3

De

nition of Primary Prevention

Individuals without a prior CV event were identified as those who responded“no”to the question“Have you ever been hospitalized for a heart attack or stroke?” Data for these individuals were collated from the 1985 to 2009 surveys and were restricted to those aged 40–79 years since that is one of the criteria for PCE assessment.

Statistical Methods

Multivariable linear regression models were developed to predict the measured PCE risk (dependent variable, mPCE) from individual’s knowledge of risk (primary inde-pendent variable, knowledge of risk). To investigate the optimal parameterization for the four risk factor knowl-edge components, their sum was modeled as both a categorical variable (with five levels, 0–4) and as a continuous variable. The four risk factors were also modelled as separate dichotomous variables, taking the value of 0 (no) or 1 (yes). The mPCE risk was modeled on its native scale and was also log-transformed. Models were developed separately for men and women, and age was included as a linear and quadratic covariate. Adjusted R2and Akaike’s Information Criterion (AIC) were calcu-lated from each model as measures of model fit, with better fitting models having a higher R2and a lower AIC. Estimated risk (ePCE) for each individual was calcu-lated from the final log-linear models, using methods to avoid retransformation bias.7Deciles of mPCE and ePCE were compared visually as a measure of calibration.

To assess characteristics of the ePCE, mPCE and ePCE were each divided into two categories: low risk (<7.5%)

and high risk (≥7.5%), as was the risk threshold for statin therapy in the original work.3 Accuracy was calculated from each 2×2 table at a cutoff point of≥7.5%.

Internal validation was assessed by leave-one-out cross-validation, with measures of R2 and root-mean-squared error (RMSE) averaged over each of the valida-tion models.

Descriptive statistics for continuous variables are reported as mean ± SD and categorical variables by fre-quency and percentage. All reported p-values are based on two-sided tests; a p-value of <0.05 was considered to indicate statistical significance. Analyses were performed in Stata Version 15.1 (StataCorp 2013. Stata Statistical Software Release 15. College Station, TX).

The Institutional Review Board of the University of Minnesota approved this study. The authors had full access to all of the data, and take responsibility for their integrity and the accuracy of the data analyses.

Results

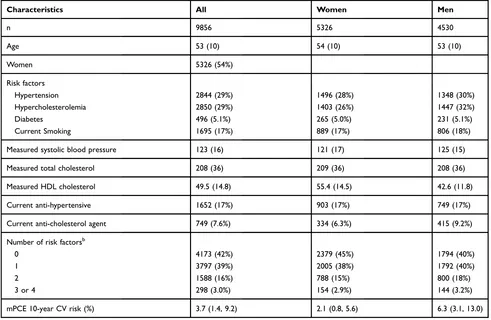
Characteristics of individuals without a prior CV event, stratified by sex, are displayed in Table 1. As there were limited numbers of individuals with a knowledge of risk sum of 4 (10 women, 8 men), those with 3 or 4 were combined. The MHS primary prevention population could be described as a low-risk CVD population, with close to 80% with 0 or 1 knowledge of risk sum, and the median mPCE <7.5%.

Ten-year median (IQR) cardiovascular risk (%) derived from the mPCE for each of the 16 possible combinations of the knowledge of risk factors is shown in Supplementary Table 1.

InTable 2, we show the strategy used to estimate PCE (ePCE) from only the individual’s knowledge of their risk. The original PCE model (mPCE) includes race, but it was not used in this analysis, since the MHS population is 95% non-Hispanic white. Both mPCE and ePCE contain the“same” risk factors, except that ePCE does not include whether the individual is taking an anti-hypertensive agent. The measured blood pressure and cholesterol in the mPCE, requiring a clinic visit and a blood draw, are effectively “replaced” by knowledge of hypertension and hypercholesterolemia.

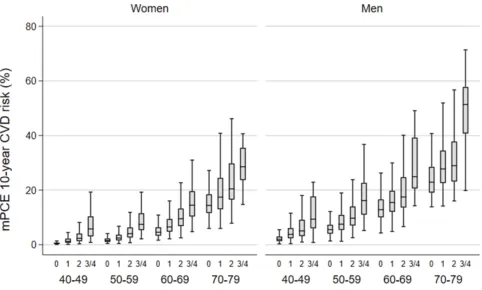
The risk profile as measured by the mPCE of MHS primary prevention individuals, stratified by age group and knowledge of risk sum is displayed inFigure 1separately for women and men. Measured PCE increased with both age and knowledge of risk and is higher in men.

Clinical Epidemiology downloaded from https://www.dovepress.com/ by 118.70.13.36 on 24-Aug-2020

(4)

Models using the log-transformed mPCE as the depen-dent variable performed uniformly better than the untrans-formed mPCE (results not shown).Supplementary Table 2

shows the adjusted R2 and Akaike’s Information Criterion (AIC) for each of the models assessed. Models where knowl-edge of risk was included as four separate dichotomous variables were uniformly slightly better than the categorical or continuous (not shown) versions of the knowledge of risk.

The best models were chosen as those with the highest R2 and lowest AIC combination. Thefinal models included, in women: high blood pressure, high cholesterol, diabetes mel-litus, smoking, age (linear and quadratic terms) and the interaction of age with each of the dichotomous risk factors; in men, the model differed in that it only included the age interactions with high cholesterol and smoking, and not those with high blood pressure and diabetes mellitus. The same

Table 1Characteristics of Minnesota Heart Survey Primary Prevention Population, 1985 to 2009. Age Range Restricted to 40–79 Years, and to Those Eligible for PCE Calculationa

Characteristics All Women Men

n 9856 5326 4530

Age 53 (10) 54 (10) 53 (10)

Women 5326 (54%)

Risk factors

Hypertension 2844 (29%) 1496 (28%) 1348 (30%)

Hypercholesterolemia 2850 (29%) 1403 (26%) 1447 (32%)

Diabetes 496 (5.1%) 265 (5.0%) 231 (5.1%)

Current Smoking 1695 (17%) 889 (17%) 806 (18%)

Measured systolic blood pressure 123 (16) 121 (17) 125 (15)

Measured total cholesterol 208 (36) 209 (36) 208 (36)

Measured HDL cholesterol 49.5 (14.8) 55.4 (14.5) 42.6 (11.8)

Current anti-hypertensive 1652 (17%) 903 (17%) 749 (17%)

Current anti-cholesterol agent 749 (7.6%) 334 (6.3%) 415 (9.2%)

Number of risk factorsb

0 4173 (42%) 2379 (45%) 1794 (40%)

1 3797 (39%) 2005 (38%) 1792 (40%)

2 1588 (16%) 788 (15%) 800 (18%)

3 or 4 298 (3.0%) 154 (2.9%) 144 (3.2%)

mPCE 10-year CV risk (%) 3.7 (1.4, 9.2) 2.1 (0.8, 5.6) 6.3 (3.1, 13.0)

Notes:a

Total cholesterol 130–320 mg/dl; HDL 20–100 mg/dl; SBP 90–200 mmHg; DBP 30–140 mmHg.b

Derived from knowledge of risk factors questions (see text). Values are mean (SD), n (%), or median (25th, 75th percentile).

Abbreviations:HDL, high-density lipoproteins; mPCE, measured Pooled Cohort Equations 10-year CV risk.

Table 2Description of mPCE and ePCE

Risk“Score” Model Input Predicted Outcome

Pooled cohort equations (mPCE) Age, smoking, DM, measured SBP, anti-hypertensive(s), measured total cholesterol, HDL, race

Coronary death or nonfatal myocardial infarction, or fatal or nonfatal stroke

Knowledge of risk (KoR) Age, smoking, knowledge of DM, hypertension, and hypercholesterolemia

ePCE

Note:The original mPCE model includes race, but it was not used in this analysis (Minnesota Heart Survey is 95% Caucasian).

Abbreviations:DM, Diabetes; ePCE, estimated Pooled Cohort Equations 10-year CV risk; HDL, High-Density Lipoproteins; KoR, Knowledge of Risk factors; mPCE, measured Pooled Cohort Equations 10-year CV risk; SBP, Systolic BP.

Clinical Epidemiology downloaded from https://www.dovepress.com/ by 118.70.13.36 on 24-Aug-2020

(5)

interaction models for women and men are shown for com-parison purposes. Even though there is very little difference in the two interaction models in both women and men, the chosen models (highlighted in grey) performed better at higher levels of risk.

The derivation model regression coefficients for the can-didate andfinal models are shown inSupplementary Table 3

and are given on the log-transformed scale for mPCE. The term for diabetes-age interaction was not statistically signifi -cant in women; however, its inclusion both decreased Akaike’s Information Criterion (AIC) and improved model

fit at higher levels of risk. Even though interpretation of the main effects is not straightforward in interaction models, it is clear that smoking in women, and smoking and age in men are powerful predictors of CVD risk.

Estimated risk (ePCE) for women can be calculated as exp(ΣßX - 4.02), and for men as exp(ΣßX - 5.8), where ß is the sex-specific regression coefficient and X is the level for each knowledge of risk factor (Supplementary Table 3). For example, for a 60-year-old woman who currently smokes and has been told that she has high blood pressure, the ePCE risk is calculated to be 9.7%.

The models showed good discrimination for the derivation model (R2=0.87, root-mean-squared error (RMSE) = 0.46 for

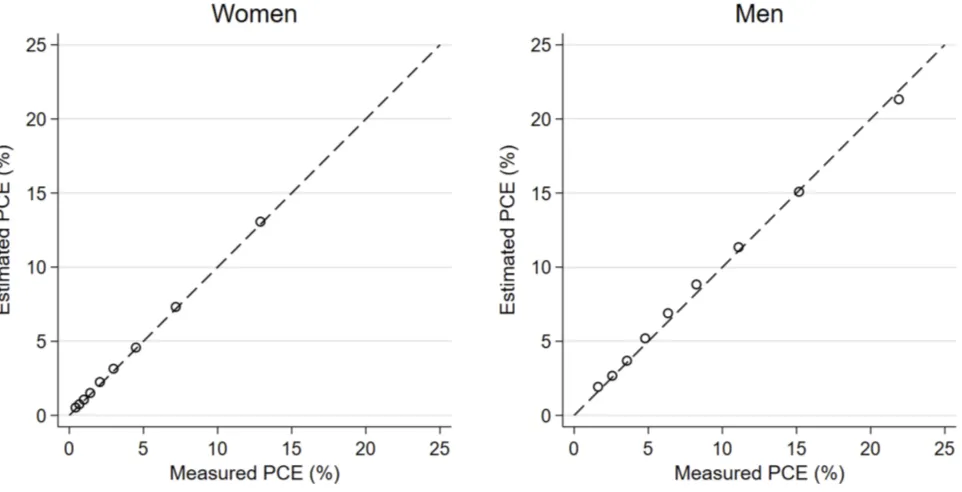
women; R2=0.82, RMSE=0.41 for men). Calibration of the models was assessed by scatterplots of mPCE and ePCE, superimposed with the four regions showing those who were concordant or discordant with regards to low (<7.5%) or high (≥7.5%) risk categories of each score (Figure 2). There are relatively few discordant individuals (5.5% in women and 12.6% in men). Thus, using the concordant cells to calculate accuracy gave values of 95% for women and 87% for men. Furthermore, the negative predictive value was 96.6% in women and 90.7% in men. When deciles of each of mPCE and ePCE were calculated and plotted against each other, they showed remarkable correlation (Figure 3). The internal vali-dation R2 and RMSE from leave-one-out cross validation were identical to the derivation statistics to two decimal places, again indicating good modelfit.

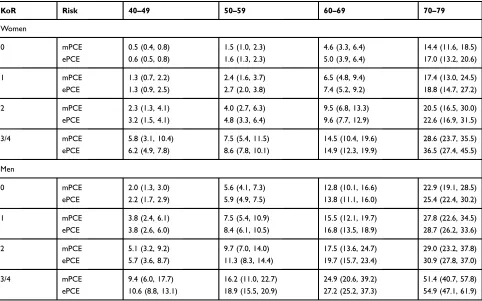
Table 3shows the measured and estimated PCE side by

side, separately for women and men, and grouped by knowledge of risk sum and age group. There are some differences in the median values; however, they are rela-tively small and are more pronounced in older, higher risk individuals. In every case, the knowledge of risk model overestimates the median to some extent. These also corre-spond to cells with the smallest number of individuals and wider interquartile ranges.

Figure 1Measured PCE 10-year CVD risk (mPCE) by knowledge of risk and age group within women and men.

Clinical Epidemiology downloaded from https://www.dovepress.com/ by 118.70.13.36 on 24-Aug-2020

(6)

Discussion

Using only simple individual knowledge of CVD risk, 95% of the women and 87% of the men were classified in concor-dance with their measured PCE risk. In the newly developed models, total and HDL-cholesterol measurements have been replaced by an individual’s knowledge that a health-care professional told them they had high cholesterol. Systolic

BP and anti-hypertensive use in the PCE risk were replaced by whether the individual had been told they had hyperten-sion. Smoking and diabetes variables are the same in mea-sured PCE and models for estimation of PCE. Binary responses used as input to the newly developed knowledge of risk model were not derived from the measured blood pressure or cholesterol values in the MHS.

Figure 3Calibration of the internal validation model, with line of identity denoting perfect calibration in women (left) and men (right). Risk is plotted at deciles of mPCE and ePCE. Figure 2Estimated vs measured PCE 10-year CVD risk in women (left) and men (right). Values are only shown for those with mPCE<40.

Clinical Epidemiology downloaded from https://www.dovepress.com/ by 118.70.13.36 on 24-Aug-2020

(7)

Unlike most risk prediction models, the models derived here were without knowledge of cardiovascular events. Cardiovascular outcomes were not available in the MHS; however, data were available to simultaneously allow the computation of mPCE, as well as yes or no responses to questions about knowledge of risk. When faced with self-report data where calculation of the mPCE is impossible, we have shown that these models have good statistical proper-ties, and thus could be used to quantify risk when laboratory data are unavailable. Used as a screening assessment in asymptomatic adults, a low ePCE may be useful in reducing unnecessary testing. With very high negative predictive values of over 96% in women and 90% in men, the newly developed score can potentially identify low-risk indivi-duals who may not require further evaluation (eg, labora-tory testing, coronary artery calcium (CAC) score). This will require additional evaluation. Currently, any clinical decision to modify an individual’s treatment plan due to CVD risk should be well informed by the appropriate blood pressure, laboratory and radiologic testing.

The four risk factors are not evenly weighted in their contribution to CVD risk, with some combinations uncom-mon in these data. This explains why the individual risk factors performed better than the sum of risk factors in estimation models.

In a nationwide survey of adults aged 45–75,“ objec-tive risk”of CVD was ascertained based on age, sex, and number of self-reported CVD risk factors.8Four of thefive risk factors used in this survey were the same as we used in this analysis, with the added self-report of family his-tory of stroke, angina, heart attack or heart surgery. We believe that our method goes one step further than this work in attempting to model these factors to estimate absolute risk.

We do not know from this study how well the knowl-edge of risk model will predict CVD outcomes. Further study in an appropriate data set is needed to answer this question; however, perhaps it may perform better than the measured PCE. Measurements of blood pressure and cho-lesterol for input to the mPCE risk calculator are typically

Table 3Measured (mPCE) and Estimated PCE (ePCE), Stratified by Age Group and Knowledge of Risk (Represented as the Sum of Risk Factors): Minnesota Heart Survey Primary Prevention Population, 1985 to 2009. Knowledge of Risk factors (KoR) are Hypertension, Hypercholesterolemia, Diabetes, and Smoking

KoR Risk 40–49 50–59 60–69 70–79

Women

0 mPCE 0.5 (0.4, 0.8) 1.5 (1.0, 2.3) 4.6 (3.3, 6.4) 14.4 (11.6, 18.5)

ePCE 0.6 (0.5, 0.8) 1.6 (1.3, 2.3) 5.0 (3.9, 6.4) 17.0 (13.2, 20.6)

1 mPCE 1.3 (0.7, 2.2) 2.4 (1.6, 3.7) 6.5 (4.8, 9.4) 17.4 (13.0, 24.5)

ePCE 1.3 (0.9, 2.5) 2.7 (2.0, 3.8) 7.4 (5.2, 9.2) 18.8 (14.7, 27.2)

2 mPCE 2.3 (1.3, 4.1) 4.0 (2.7, 6.3) 9.5 (6.8, 13.3) 20.5 (16.5, 30.0)

ePCE 3.2 (1.5, 4.1) 4.8 (3.3, 6.4) 9.6 (7.7, 12.9) 22.6 (16.9, 31.5)

3/4 mPCE 5.8 (3.1, 10.4) 7.5 (5.4, 11.5) 14.5 (10.4, 19.6) 28.6 (23.7, 35.5)

ePCE 6.2 (4.9, 7.8) 8.6 (7.8, 10.1) 14.9 (12.3, 19.9) 36.5 (27.4, 45.5)

Men

0 mPCE 2.0 (1.3, 3.0) 5.6 (4.1, 7.3) 12.8 (10.1, 16.6) 22.9 (19.1, 28.5)

ePCE 2.2 (1.7, 2.9) 5.9 (4.9, 7.5) 13.8 (11.1, 16.0) 25.4 (22.4, 30.2)

1 mPCE 3.8 (2.4, 6.1) 7.5 (5.4, 10.9) 15.5 (12.1, 19.7) 27.8 (22.6, 34.5)

ePCE 3.8 (2.6, 6.0) 8.4 (6.1, 10.5) 16.8 (13.5, 18.9) 28.7 (26.2, 33.6)

2 mPCE 5.1 (3.2, 9.2) 9.7 (7.0, 14.0) 17.5 (13.6, 24.7) 29.0 (23.2, 37.8)

ePCE 5.7 (3.6, 8.7) 11.3 (8.3, 14.4) 19.7 (15.7, 23.4) 30.9 (27.8, 37.0)

3/4 mPCE 9.4 (6.0, 17.7) 16.2 (11.0, 22.7) 24.9 (20.6, 39.2) 51.4 (40.7, 57.8)

ePCE 10.6 (8.8, 13.1) 18.9 (15.5, 20.9) 27.2 (25.2, 37.3) 54.9 (47.1, 61.9)

Note:Values are median (25th, 75th percentile) of 10-year CV risk (%).

Abbreviations:ePCE, estimated Pooled Cohort Equations 10-year CV risk; KoR, knowledge of risk factors; mPCE, measured Pooled Cohort Equations 10-year CV risk.

Clinical Epidemiology downloaded from https://www.dovepress.com/ by 118.70.13.36 on 24-Aug-2020

(8)

from a single measurement, whereas knowledge of these risk factors may be more reliable and stable.

Limitations

The MHS data used in these analyses were obtained from primary prevention individuals living in the Twin Cities metropolitan area from 1985 to 2009. During this period, risk factors for CVD have changed, with notable reductions in smoking from 23% to 11%. Statin use in the MHS study increased from 1% in 1985 to 19% in 2009, somewhat in alignment with the self-report of high cholesterol which increased from 15% to 41%. Despite these ecologic trends, the predicted PCE was remarkably stable across survey years. Measured PCE risk has been shown to overestimate CVD risk,9 and we have shown that knowledge of risk tends to overestimate the mPCE. However, when we clas-sified high CVD risk based on a cutoff of 7.5% risk, measured PCE predicted that 19% women and 44% men would be classified as high cardiovascular risk and the corresponding knowledge of risk estimates were very similar, 19% and 46%, respectively. Until further evalua-tion, we would recommend that the knowledge of risk be best used for dividing individuals into risk categories, where different cut-points could be used depending on the research question, and tolerance of false negatives and false positives.

The majority of our sample had low CVD risk. Internal validation showed excellent calibration even in the high-risk deciles, but more work should be done to validate the knowledge of risk score in an intermediate to high risk sample.

Statistical Limitations

Statistically, the models are by definition multicollinear. The knowledge of risk as parameterized in thefinal mod-els as four separate factors can only take the values of 0 and 1, and their interactions with age can only take the values of 0 and age. With such a large data set, these effects are less likely to be problematic, and the models performed well in terms of estimated standard errors.

Performance of a predictive model is typically over-estimated when simply determined on the sample of sub-jects that was used to construct the model. We showed that using leave-one-out cross-validation, this bias was very small. Still, recalibration of the knowledge of risk model

in a different dataset may be necessary, such as was done for the Framingham prediction scores.10

This work does not include external validation of the newly developed knowledge of risk models to estimate mPCE. Nor does it use cardiovascular events in its devel-opment, such as those outcomes predicted by the mPCE risk. The next step in the development of these models for practical use is to externally validate them in other primary prevention populations.

Conclusions

The knowledge of risk score provides a highly accurate method of estimating CVD risk without the need for blood pressure or laboratory data. This method of calculating risk may be useful in research settings or electronic health record analyses where such data are not readily available.

Disclosure

The authors report no conflicts of interest in this work.

References

1. ASCVD risk estimator [Internet]. Available from: tools.acc.org/ ASCVD-Risk-Estimator-Plus. Accessed December 03, 2019. 2. Patel RS, Lagord C, Waterall J, Moth M, Knapton M, Deanfield JE.

Online self-assessment of cardiovascular risk using the Joint British Societies (JBS3)-derived heart age tool: a descriptive study. BMJ Open.2016;6:e011511. doi:10.1136/bmjopen-2016-011511 3. Goff DC, Lloyd-Jones DM, Bennett G, et al. 2013 ACC/AHA

guide-line on the assessment of cardiovascular risk: a report of the American College of Cardiology/American Heart Association task force on practice guidelines. Circulation. 2014;129:S49–S73. doi:10.1161/01.cir.0000437741.48606.98

4. D’Agostino RB, Vasan RS, Pencina MJ, et al. General cardiovascular risk profile for use in primary care.Circulation.2008;117:743–753. doi:10.1161/CIRCULATIONAHA.107.699579

5. Van’t Hof JR, Duval S, Walts A, Kopecky SL, Luepker RV, Hirsch AT. Contemporary primary prevention aspirin use by cardio-vascular disease risk: impact of US preventive services task force recommendations, 2007-2015: a serial, cross-sectional study.J Am Heart Assoc.2017;6:1–12.

6. Luepker RV, Steffen LM, Jacobs DR, Zhou X, Blackburn H. Trends in blood pressure and hypertension detection, treatment, and control 1980 to 2009: the Minnesota Heart Survey.Circulation. 2012;126 (15):1852–1857.

7. Beauchamp JJ, Olson JS. Corrections for bias in regression estimates after logarithmic transformation. Ecology. 1973;54:1403–1407. doi:10.2307/1934208

8. Williams CD, Chan AT, Elman MR, et al. Aspirin use among adults in the U.S.: results of a national survey. Am J Prev Med.

2015;48:501–508. doi:10.1016/j.amepre.2014.11.005

9. Ridker PM, Cook NR. Statins: new American guidelines for preven-tion of cardiovascular disease.Lancet.2013;382:1762–1765. 10. D’Agostino RB Sr, Grundy S, Sullivan LM, Wilson P. Validation of

the Framingham Coronary Heart Disease prediction score.J Am Med Assoc.2001;286:180–187. doi:10.1001/jama.286.2.180

Clinical Epidemiology downloaded from https://www.dovepress.com/ by 118.70.13.36 on 24-Aug-2020

(9)

Clinical Epidemiology

Dove

press

Publish your work in this journal

Clinical Epidemiology is an international, peer-reviewed, open access, online journal focusing on disease and drug epidemiology, identifi ca-tion of risk factors and screening procedures to develop optimal pre-ventative initiatives and programs. Specific topics include: diagnosis, prognosis, treatment, screening, prevention, risk factor modification,

systematic reviews, risk & safety of medical interventions, epidemiol-ogy & biostatistical methods, and evaluation of guidelines, translational medicine, health policies & economic evaluations. The manuscript management system is completely online and includes a very quick and fair peer-review system, which is all easy to use.

Submit your manuscript here:https://www.dovepress.com/clinical-epidemiology-journal

Clinical Epidemiology downloaded from https://www.dovepress.com/ by 118.70.13.36 on 24-Aug-2020

Figure

Table 2 Description of mPCE and ePCE
Figure 1 Measured PCE 10-year CVD risk (mPCE) by knowledge of risk and age group within women and men.
Figure 2 Estimated vs measured PCE 10-year CVD risk in women (left) and men (right). Values are only shown for those with mPCE<40.
Table 3 Measured (mPCE) and Estimated PCE (ePCE), Stratified by Age Group and Knowledge of Risk (Represented as the Sum ofRisk Factors): Minnesota Heart Survey Primary Prevention Population, 1985 to 2009

References

Related documents

While multiple 24-hour dietary recalls or weighed food records are ideal for obtaining nutrient intake data [36] the main purposes of this study was to obtain baseline dietary

Why need to be reading Dark They Were, And Golden-Eyed (Dramatized): Bradbury Thirteen: Episode 2 By Ray Bradbury Once again, it will depend on how you really feel and think of it..

HEPA: Health-enhancing physical activity; HWEs: Healthy and welcoming sporting environments; FIFA: Fédération Internationale de Football Association; NAPSE: National Action Plan

In June 2017, the Research for Health in Humanitarian Crises (R2HC) programme of Elrha, convened a meeting of representatives from international response agencies, research

GenBank accession numbers of cytb and COI sequences used in the estimation of K2P shown in Figure 1, phylogenetic analyses and BLOG analysis shown in Table S2 in Additional file 2..

Given the shortage of human resources for health (HRH) and with intention of ensuring greater and meaningful involvement of PLHIV in HIV care, the Federal

Note: This figure demonstrates a positive linear relationship between relative advantage and years sustained when there is negative or no change in data resources. However,

We evaluated p53, MDM2 protein levels in six untreated gastric cancer cell lines by western blot (Fig. Only AGS and MKN45 cell lines were p53 wild type, and they harbored