University of South Carolina
Scholar Commons
Theses and Dissertations
2016
Investigating The Role Of Internal Hospital Factors
And The External Environment On Healthcare
Quality Outcomes And Patient Choice
Deepa Wani
University of South Carolina
Follow this and additional works at:https://scholarcommons.sc.edu/etd
Part of theBusiness Administration, Management, and Operations Commons
This Open Access Dissertation is brought to you by Scholar Commons. It has been accepted for inclusion in Theses and Dissertations by an authorized administrator of Scholar Commons. For more information, please [email protected].
Recommended Citation
INVESTIGATING THE ROLE OF INTERNAL HOSPITAL FACTORS AND THE EXTERNAL ENVIRONMENT ON HEALTHCARE QUALITY OUTCOMES AND
PATIENT CHOICE
by Deepa Wani Bachelor of Engineering University of Mumbai, 2000
Master of Science
University of South Carolina, 2008
Submitted in Partial Fulfillment of the Requirements For the Degree of Doctor of Philosophy in
Business Administration Darla Moore School of Business
University of South Carolina 2016
Accepted by:
Manoj Malhotra, Major Professor Sriram Venkataraman, Committee Member
Yan Dong, Committee Member Paul Bliese, Committee Member
ii
iii
DEDICATION
iv
ACKNOWLEDGEMENTS
My dissertation would not have been possible without the guidance, critical insight, and encouragement from my advisor Dr. Manoj Malhotra. I would also like to thank Dr. Yan Dong for his immense support and advice on a variety of research topics. My interactions with both of them have broadened my horizons and allowed me to see things from different perspectives. In addition, I greatly value their wisdom in various aspects of life and I will continue to seek their advice in the future.
I thank Dr. Sriram Venkataraman for his constant support with one of my dissertation essays and on various econometric topics. I also thank Dr. Paul Bliese for serving as a member on my committee and taking the time to clarify statistical concepts using simulations and graphs. I thank Dr. Mark Ferguson for his support and advice throughout my PhD program and all other faculty members of the Moore School of Business for having equipped me with the tools and techniques to finish my PhD program successfully. I am grateful to Dr. Aravind Chandrasekaran and Luv Sharma for providing useful feedback on my paper drafts. Julia Witherspoon and Scott Ranges have been excellent resources for all my administrative needs. I also acknowledge the support of fellow PhD students who helped make the tough task of finishing a PhD more bearable.
v
ABSTRACT
vi
TABLE OF CONTENTS
DEDICATION ... iii
ACKNOWLEDGEMENTS ... iv
ABSTRACT ...v
LIST OF TABLES ... viii
LIST OF FIGURES ... ix
CHAPTER 1INTRODUCTION ...1
CHAPTER 2 DOES THE MEANINGFUL USE OF ELECTRONIC HEALTH RECORDS IMPROVE PATIENT OUTCOMES? ...8
2.1MOTIVATION ...9
2.2MEANINGFUL USE OF ELECTRONIC HEALTH RECORDS ...12
2.3LITERATURE REVIEW ...14
2.4HYPOTHESIS DEVELOPMENT ...17
2.5DATA DESCRIPTION ...24
2.6ECONOMETRIC MODEL ...31
2.7RESULTS ...34
2.8CONCLUSIONS AND DISCUSSION ...38
CHAPTER 3LONGITUDINAL IMPACT OF PROCESS IMPROVEMENT ON PATIENT CARE UNDER COMPETITION AND ACA ...44
3.1INTRODUCTION ...45
vii
3.3DATA SOURCES,VARIABLES AND ECONOMETRIC MODEL ...58
3.4RESULTS ...65
3.5IMPACT OF ACA ON PROCESS OF CARE AND THE ROLE OF PROCESS IMPROVEMENT FACTORS ...73
3.6CONCLUSIONS AND LIMITATIONS ...75
CHAPTER 4IMPACT OF HOSPITAL CHARACTERISTICS ON PATIENT CHOICE BEHAVIOR FOR ELECTIVE SURGERIES ...83
4.1INTRODUCTION ...84
4.2LITERATURE REVIEW ...89
4.3HYPOTHESIS DEVELOPMENT ...95
4.4DATA DESCRIPTION AND ECONOMETRIC MODEL ...103
4.5EMPIRICAL SPECIFICATION OF THE DEMAND MODEL ...109
4.6RESULTS ...113
4.7ROBUSTNESS TEST ...119
4.8STUDY CONTRIBUTIONS AND CONCLUSION ...120
CHAPTER 5CONCLUSION ...125
REFERENCES ...129
APPENDIX A – SUMMARY OF KEY PAPERS ON THE IMPACT OF EHRS AND INFORMATION TECHNOLOGY ...145
viii
LIST OF TABLES
Table 1.1 List of Variables used in different studies within the Dissertation ...7
Table 2.1 Descriptive Statistics of Variables used in main analysis ...28
Table 2.2 Hospital Level Characteristics used in selection model ...29
Table 2.3 Comparative Statistics for MU_EHR and non MU_EHR certified hospitals ...30
Table 2.4 Main Results ...35
Table 2.5 Choice Model Results ...36
Table 2.6 Post-Hoc Results for Readmissions ...37
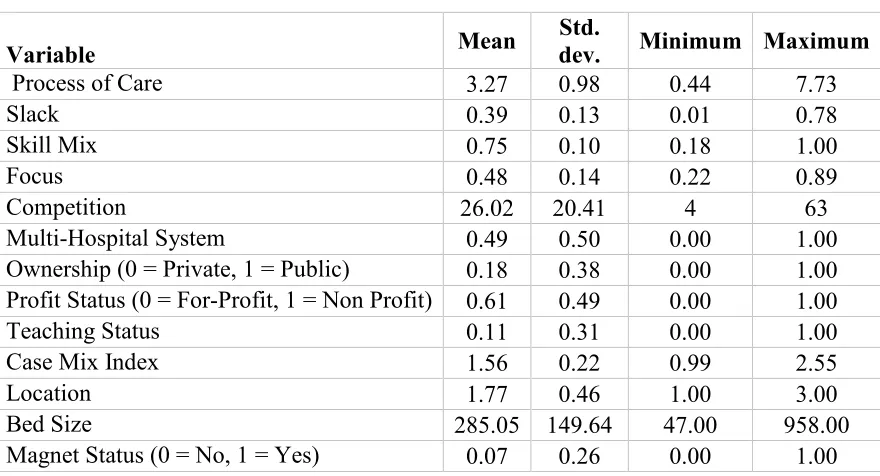
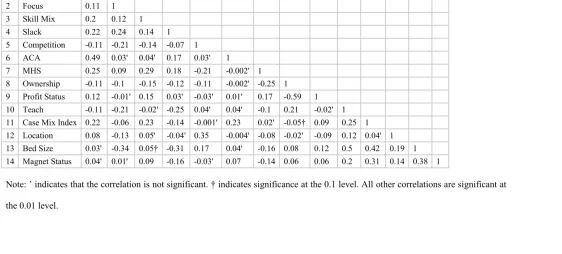
Table 3.1 Descriptive Statistics ...62
Table 3.2 Correlations ...63
Table 3.3 Regression Results for Process of Care Dependent Variable ...67
Table 3.4 Robustness Test for Process of Care Dependent Variable ...72
Table 3.5 Joint Simultaneous Impact of Competition and ACA on Process of Care ...74
Table 4.1 Summary of papers on Revealed Patient Choice ...90
Table 4.2 Descriptive Statistics for Elective Hip-Knee Surgeries ...114
Table 4.3 Conditional Logit Estimates of Hospital Choice ...118
ix
LIST OF FIGURES
Figure 1.1 Schematic of Factors impacting Quality of Care and Patient Choice in
Healthcare ...2
Figure 1.2 Schematic for Study 1 ...4
Figure 1.3 Schematic for Study 2 ...5
Figure 1.4 Schematic for Study 3 ...7
Figure 3.1 Theoretical Model ...57
1
CHAPTER 1
INTRODUCTION
2
factors play in improving patient quality of care. On the supply side, we contribute to healthcare operations management research and practice by attempting to understand the role of structural and infrastructural investments and competition in improving both patient as well as hospital level quality outcomes. On the demand side, we contribute through this dissertation to the understanding of how these investments help inform patient choice of hospitals. Figure 1.1 schematically shows the factors that impact quality of care and how and where patients choose to consume health care services.
Figure 1.1: Schematic of Factors impacting Quality of Care and Patient Choice in HealthCare
Study 1
In study 1, we look at the impact of electronic health records (EHRs) on patient level outcomes. EHRs have the potential to transform healthcare delivery through the use of built-in evidence based medical guidelines, and efficient coordination of patient treatment and care. The Health Information Technology for Economic and Clinical Health (HITECH) Act was passed in in 2009 and billions of dollars were set aside in incentives to encourage meaningful use of these systems (HHS, 2009). However, past studies on adoption of such EHRs have shown mixed results (McCullough et al. 2010; Miller and Tucker 2011; Furukawa 2011; Appari et al. 2012; Dranove et al. 2012; Appari et al.
Patient and Hospital Level Outcomes Internal
Factors
External Factors
3
4
Figure 1.2: Schematic for Study 1
Study 2
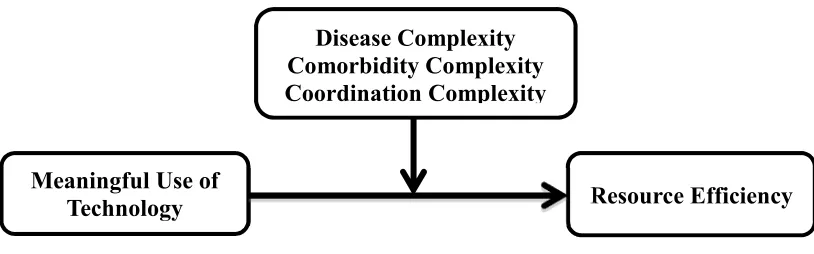
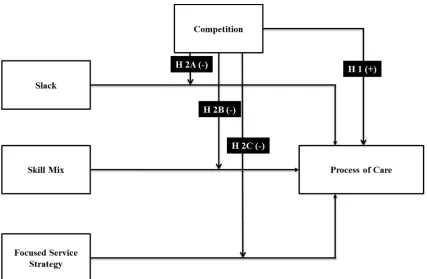
Even though EHRs represent an important structural investment for hospitals, there are other important investments that hospitals have to consider given the changing reimbursement system within which they must function. The economics literature suggests that increased competition improves quality (Tirole, 1988; Gaynor and Town, 2011; Gravelle et al., 2014). In the second study, we seek to understand how a shift toward more competitive conditions for capturing patient demand affects process of care (PoC) at the hospital level. Further, given hospitals’ financial constraints, we also seek to understand how hospital managers should make resource allocation decisions that improve hospital processes that ultimately improve patient outcomes. We posit that the impact of process improvement factors will be positive in both more and less competitive markets. However, considering that hospitals in more competitive markets make additional investments in technology and state of the art equipment, we posit that the marginal benefit will be stronger in less competitive markets. Accordingly, we use panel data collected over 7 years from 2007 to 2013 and various sources such as CMS’ Hospital Compare website, California Office of Statewide Planning and Development’s
Meaningful Use of
Technology Resource Efficiency
5
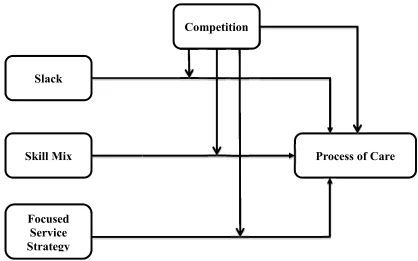
(OSHPD) Annual Financial database, Dartmouth Atlas, Inpatient Prospective Payment System (IPPS), OSHPD’s Healthcare Atlas and American Nurses Credentialing Center (ANCC). Using longitudinal data analysis, we study the role that three key process improvement factors - operational slack, nursing skill mix and a focused service strategy - play in affecting PoC within the altered competitive landscape created by the introduction of the ACA. Figure 1.3 captures the schematic for Study 2.
Figure 1.3: Schematic for Study 2
Study 3
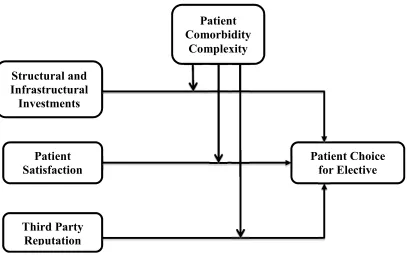
While the above two studies focus on the supply side of the equation i.e. how internal and external factors impact outcomes at the hospital and patient level, the final study looks at the demand side of the equation. In recent years, there has been a proliferation in the
Slack
Skill Mix
Focused Service Strategy
6
7
Figure 1.4: Schematic for Study 3
Table 1.1 provides details of the internal and external factors and outcome variables used in each of the three studies, and which together form this dissertation.
Table 1.1: List of variables used in different studies within the dissertation
Internal Factors External Factors Outcomes
Study 1 Electronic Health
Records (EHRs)
Health Information Technology for Economic and Clinical
Health (HITECH) Act
Resource Efficiency - Patient Length of
Stay
Study 2 Operational Slack,
Nursing Skill Mix, Focused Service
Strategy
Local Competition, ACA
Hospital level Process of Care
Measures
Study 3 Technology, Registered
Nurse Staffing, Hospital Focus, Patient
Satisfaction
Reputation Signals generated by Third
8
CHAPTER 2
DOES THE MEANINGFUL USE OF ELECTRONIC HEALTH RECORDS
IMPROVE PATIENT OUTCOMES?1
Abstract
Electronic Health Records (EHRs) have the potential to transform healthcare delivery through the use of built-in evidence based medical guidelines, and efficient coordination of patient treatment and care. Meaningful use of EHRs can play an especially important role in easing a health care provider’s cognitive load while working on complex tasks. In this study, we examine the impact of meaningful use of EHR after the mandated HITECH (Health Information Technology for Economic and Clinical Health) Act on patients’ length of stay (LOS) in the context of treating patients with varying dimensions of complexity: (i) complexity arising from the treatment of a patient’s disease, (ii) complexity arising from a patient’s comorbidities and (iii) complexity arising from coordination required from various healthcare providers to treat the patient’s disease. We conduct our analysis by using a large-scale dataset with detailed patient level data from acute care hospitals in California that is coupled with relevant data from several other sources. After accounting for self-selection bias, our analysis reveals that meaningful use of EHRs reduces the overall LOS by about 9%; and that the magnitude of this effect is greater for patients with higher disease and comorbidity complexity and for patients with
9
higher coordination needs. Further, these changes in LOS do not come at the expense of increased readmissions. In fact, we find an overall decrease in readmissions and a greater reduction in readmissions for patients with a higher disease and coordination complexity profile. Apart from theoretical contributions, practical implications of these results are also discussed.
Keywords: Electronic Health Records, Healthcare, Meaningful Use of Technology, Task
Complexity, Length of Stay
2.1 Motivation
10
that evaluate the impact of adoption of EHRs on various outcomes such as process quality, mortality and cost have yielded mixed results (See Appendix A). In order to overcome barriers and accelerate the adoption of EHRs, the Obama Administration introduced the HITECH Act in 2009 (HHS, 2009). Under this Act, the government committed $27 billion to incentivize hospitals and clinicians to adopt and meaningfully use EHRs. The government set a high bar in this Act on healthcare providers to improve quality through the use of scientifically supported decision support systems and sharing of data to reduce costs. While the government mandate may encourage hospitals to adopt and use EHRs, can these systems really improve patient outcomes given that past large scale studies have not found overwhelming support from the adoption of EHRs on outcomes?
11
examination of the arguments that associate meaningful use of EHRs with improved operating efficiency.
One of the key challenges in measuring the effect of MU_EHR on patient outcomes is the presence of self-selection bias that requires us to model a hospital’s decision to go for meaningful use sooner rather than later. It is possible that hospital factors associated with earlier adoption of such EHRs may play a role in earlier attestation of meaningful use of EHRs. Financial incentives also get progressively lower if hospitals delay attestation for MU_EHR. Without controlling for this endogenous selection process, the impact of MU_EHR on outcomes may be biased. In our analysis, we propose a two-stage framework that explicitly deals with the endogeneity inherent in self-selecting to attest for meaningful use sooner. Our econometric model of patient length of stay and readmission is based on detailed patient data from acute care hospitals in California in 2012, a new dataset made available from the Medicare EHR Incentive Program, and data from various other sources. Our model and related analysis offers a new perspective on this issue, which has captured the attention of healthcare providers, policy makers, and academicians over the last few years.
12
results to the fact that meaningfully using EHRs helps in providing the right treatment at the right time and in the right amount as healthcare providers can gain relevant information about disease conditions by accessing the embedded knowledge base, which results in improved medical decision making (Bulkley and Van Alstyne 2004).
The remainder of our paper is organized as follows: In section 2.2, we discuss the problem background on the meaningful use of EHRs followed by a review of the relevant literature in section 2.3. Our hypotheses are described in section 2.4. Data description and econometric model used in this paper are in sections 2.5 and 2.6 respectively. We present our results and post-hoc tests in section 2.7. We finally conclude with a discussion of implications for research and practice in section 2.8.
2.2 Meaningful Use of Electronic Health Records
The implementation of EHRs has been very slow, with less than 10% of hospitals reporting a comprehensive EHR system by the end of 2009 (Jha et al. 2009). The HITECH Act was passed in October 2010 to encourage hospitals to not just adopt EHRs but also meaningfully use them. Full details of the MU_EHR program can be found here (https://www.healthit.gov/providers-professionals/how-attain-meaningful-use), but we provide a brief summary next.
13
14
2.3 Literature Review
In this section, we preview existing work in the area of information technology and EHRs in particular. Although several studies in the operations management literature have looked at the effect of either IT investments or technologies on various patient outcomes, to the best of our knowledge, none have looked at the impact of meaningful use of EHRs on patient outcomes arising from a mandate. Examining the literature more holistically enables us to identify the gaps and also highlight the importance and need for this study.
2.3.1 Impact of Information Technology on Patient Outcomes
At the hospital level, studies in the OM and IT literature have looked at the impact of IT on outcomes. Angst et al. (2011) and Angst et al. (2012) find a positive outcome between IT adoption and dependent metrics of costs and quality. Devaraj et al. (2013) look at the impact of investments in strategic, clinical and administrative IT on revenue and mortality rate. Sharma et al. (2016) look at the effect of clinical and augmented clinical health information technology on patient satisfaction and cost measures. Queenan et al. (2011, 2016) examine the impact of computerized physician order entry systems and IT investments on patient satisfaction and other patient safety dimensions, while Aron et al. (2011) focus on the impact of systems automation on medical errors. These studies are summarized in Table A of the Appendix.
15
outcomes. Finally, all these studies examine outcomes under a scenario where adoption is self-reported and voluntary. We overcome the drawbacks of previous studies by narrowing our focus to a specific bundle of technologies as defined by MU_EHR (which we explain in more detail in section 4.1), and discussing the specific mechanisms through which information technology impacts patient outcomes and examining its impact on heterogeneous patient types. This is important because hospitals would like the benefits of expensive IT systems to accrue to all patients rather than to specific segments of the patient population. Finally, we focus on patient outcomes when hospitals are mandated to use technology through an Act rather than voluntarily using it. Although Devaraj and Kohli (2003) study the effect of actual use of a basic technology on hospital level mortality and revenue, we believe that our study is different in several ways. First, we consider the meaningful use of technology under a major policy change that affects all hospitals in the US. This is significant because the motivation, challenges and barriers to usage are very different now than when only a small group of hospitals participated voluntarily in their study. Second, our paper is more nuanced and in-depth as it not only evaluates how technology impacts a patient’s length of stay, but also studies the contingent impact of task complexity on the relationship between MU_EHR and length of stay.
2.3.2 Impact of Electronic Health Records on Patient Outcomes
16
case studies because they are too numerous to summarize in a single paper (See Table A). There has been little consensus on the measurement of health information technologies in the past literature. EHR adoption has been measured in several ways such as a generic electronic medical record (EMR) adoption (Miller and Tucker 2011; Furukawa 2011), EMR (Electronic medical record), and CDS (clinical decision support) adoption (Agha 2014), eMAR (electronic medical administration record) and CPOE (computerized physician order entry) adoption (Appari et al. 2012), EHR and CPOE adoption (McCullough et al. 2010; McCullough et al. 2013), or all functionalities including CDR, CDS, eMAR and CPOE adoption (Dranove et al. 2012; Appari et al. 2013; Jones et al. 2014). There are also differences in the way patient outcomes are measured; however process quality, mortality and cost have received the most attention. Results have been mixed - EHRs improve some process quality measures (McCullough et al. 2010; Appari et al. 2013) and patient safety indicators (Hydari et al. 2014), but do not improve mortality, readmissions (McCullough et al. 2013; Agha 2014), costs (Agha 2014; Dranove et al. 2012), or efficiency (Lee et al. 2013). These studies are again summarized in Table A of the Appendix.
17
occurred only in one clinical unit, or whether an adoption has occurred hospital wide, and (iii) they use self-reported measures of use that are highly susceptible to self-reporting bias.
What sets our study apart is its focus on meaningful use of EHRs, not just adoption, in a hospital-wide implementation under a government mandate. We consider a setting where some hospitals have been using EHRs meaningfully, as measured by their successful attestation of MU_EHR, while others have not. Our study also overcomes the issue of self-reporting bias as the criteria to demonstrate MU_EHR is the same for all hospitals. We also consider MU_EHRs impact on a much broader set of patients and conditions rather than confine our findings to specific patient segments e.g. Medicare patients or patients suffering from pneumonia, heart attack, stroke, etc. Finally, we also conceptualize the task of treating patients along three different complexity dimensions: disease complexity, comorbidity complexity and coordination complexity, and study the value of MU_EHRs in treating patients with lesser or greater complexity profiles. This brings forth a better understanding of how EHR technology, when used meaningfully, can assist healthcare providers in dealing with more complex tasks where it is critical to quickly review relevant information gathered at various points in time, navigate through the built-in knowledge base, synthesize various information pieces at once, and arrive at the correct medical diagnosis and path of action in a time effective fashion.
2.4 Hypothesis Development
18
how different dimensions of task complexity impact the relationship between MU_EHR and patient care.
While LOS has received less attention in terms of the outcome variable than mortality, process quality, etc. we choose it as our outcome variable for several reasons. First, LOS has been used in the operations management literature as a measure of resource efficiency (Andritsos and Tang, 2014; Kc and Terwiesch, 2012). While mortality and readmissions are extreme outcomes that do not affect a large segment of the population and take time for improvement, the impact of EHRs on resource efficiency measures such as LOS can be quickly measured. Studying the impact on LOS is also important because hospitals are under pressure to reduce this measure under the current fixed pay reimbursement. But reduced LOS may lead to a reduction in necessary care, and possibly also increase readmissions (Bartel et al. 2014). This consequently increases penalties to hospitals under the Hospital Readmission Reduction Program. Thus both LOS and readmission metrics are important, and must be considered in conjunction with one another.
19
guidelines (Koppel et al., 2005; Vartak et al., 2009). Either an increase in the number of tests or an increase in errors resulting in rework on the patient will increase a patient’s LOS. In either case, MU_EHR is likely to have an impact on patient’s LOS. As LOS is a direct reflection of the quality and cost of care, we use this as our focal metric to study the impact of MU_EHR. Even though it is not a part of the main hypotheses, our study also looks at whether reducing LOS compromises readmissions for patients because any efforts made by hospitals to improve LOS should also ensure that they do not lead to increased readmissions. This link has not been previously studied in the context of meaningful use of EHRs.
2.4.1 Meaningful use of IT and mechanisms through which it improves process of care
20
CPOE enables providers to electronically access and change medication and lab tests. By allowing providers to access notes from other providers, CPOE helps improve the coordination of care, and reduces the chances for miscommunication and delays in care (Classen et al., 2007; Poon et al., 2004).
Research has shown that when agents are expected to make efforts that they are not compensated for or where the outcomes are unclear, it results in suboptimal effort on the part of agents (Holmstrom and Milgrom 1991). Unclear returns on investment and physician resistance have been cited as factors associated with the slow adoption and use of EHRs in the past (Jha et al. 2009; Ford et al. 2009). Literature has theorized that “in a computer usage context, the direct compliance-based effect of subjective norm on intention over and above perceived usefulness and perceived ease of use will occur in mandatory, but not voluntary, system usage settings” (Venkatesh and Davis, 2000, pg. 188). Thus the meaningful use of EHRs, under the mandate, will result in healthcare providers accessing various features such as drug-drug and drug-allergy checks, alerts and reminders, generation of right treatment choices through the knowledge of evidence based guidelines. Thus MU_EHR strives to improve the overall quality of the treatment process by reducing the occurrence of infections and other complications such as reoperations (Bozic et al., 2010; McCabe et al., 2009) and adverse events (Chaudhry et al., 2006). We expect MU_EHR to lead to a decrease in LOS, and formally state our hypotheses as follows.
21
2.4.2 Impact of MU_EHR when Task of Treating Patients is More Complex
Task complexity has been identified as an important factor affecting performance in various settings such as organizational studies, information seeking studies, psychological studies, etc. (Payne 1976, Van de Ven and Ferry 1980, Locke et al. 1981, Culnan 1983, Campbell and Gingrich 1986, Wood 1986, Campbell 1991, Argote et al. 1995). Task complexity determines the information processing behavior, cognitive load and decision making process of a person or a team (Campbell, 1988), and is often divided into objective and subjective task complexities. Liu and Li (2012) provide a review on task complexity.
In our paper, we focus on objective task complexities that are related to task characteristics, and independent of the characteristics of the person who performs the task. Task complexity can arise due to several factors: the number of distinct acts and information cues that have to be processed, the amount of coordination required, and the relationship between task inputs that have to be taken into account in order to complete the task (Wood, 1986; Campbell, 1988). As the complexity of the task increases via the amount of information that needs to be processed, it puts a larger information load on a person’s memory and attention. It forces humans to put greater cognitive resources to use in such situations, which in turn may force people to either make tradeoffs between the time required to make a decision and the decision accuracy, or to make suboptimal decisions (Johnson and Payne, 1985; Milkman et al., 2009).
22
23
notes and instructions written by various clinical specialists have to be made available to all care providers, especially during handoffs (Solet et al., 2005). Thus greater coordination implies that greater amount of information has to be formally exchanged among the involved agencies.
Typically, doctors and nurses are trained to diagnose problems and identify patterns of symptoms, and this ability gets better with experience (Elstein and Schwarz, 2002). However, when a clinician encounters complex cases, it is possible that his or her ability to make good decisions becomes compromised under high cognitive load. This can lead to poorer decision-making, improper medications, failure to treat all accompanying conditions, etc. (Burgess, 2009; Parchman et al., 2007; Redelmeier et al., 1998). This issue is further complicated in hospitals where providers encounter patient heterogeneity, and may have to accommodate interruptions and unscheduled requests that may increase the time required to complete the job as providers have to revisit task details (Froehle and White 2013).
24
2002; Gebauer et al., 2005; Ren et al. 2008). A pioneering study conducted by Autor et al. (2003) on the effect of computerization across multiple industries suggests that information technology can “complement workers in executing non-routine tasks demanding flexibility, creativity, generalized problem-solving capability and complex communications”. Mapping these results to the healthcare settings, it is plausible that key features of EHRs such as checking for drug-drug or drug-allergy interactions, referring to treatment guidelines, ordering additional tests, communicating with other physicians, etc., that are mandated to be used in a meaningful way, may possibly add more value when tasks are non-routine and more complex as argued by Autor et al. (2003). We can view MU_EHR as a group decision support system comprising of a set of technologies such as CDR, CDSS and CPOE. As information on disease conditions, treatment protocols, and checks for drug-drug and drug-allergy interactions are embedded into these group support systems, providers can quickly and easily navigate this knowledge database for more complex tasks and accrue larger benefits for higher complexity patients. Thus we hypothesize:
H2: While meaningful use of EHRs will reduce length of stay for all patients, the
magnitude of effect will be larger for high complexity patients than for low
complexity patients
2.5 Data Description
25
26
we are capturing not just adoption but also meaningful use of EHRs. Out of the 300+ nonfederal short-term acute care hospitals in California, 60 had attained meaningful use in 2011. We join these two datasets using the unique CMS ID number. We would like to highlight two points here. First, we ensure that hospitals that had undergone meaningful use attestation in 2011 also did so in 2012. Second, we choose to study the performance of 2011 meaningful use attested hospitals using 2012 data as it would ensure that we are measuring the longer-term stable efficiency effects after the phase of learning and recovery has taken place (Bhargava and Mishra 2014).
Our dependent variable is patient length of stay (LOS) from admission until discharge. This measure is provided in the OHSPD dataset. The LOS in our dataset is an integer value, and ranges from 1 day to 35 days for 99% of the observations, but the distribution is right skewed. To adjust for this skew and ensure normality, we take the natural log transformation.
27
/FY-2012-IPPS-Final-Rule-Home-Page-Items/ CMS1250507.html). We join the dataset containing patient level data and MU_EHR certification data with the DRG weights dataset using a unique CMS Medicare identifier number.
Comorbidity complexity refers to the number of pieces of information about the
patient that need to be processed in order to complete the task of treating the patient (Wood, 1986). We calculate this as an Elixhauser severity score based on literature (Berry Jaeker and Tucker 2016). This score is calculated using two pieces of information about a patient: (i) information on the Elixhauser Index which is a vector of 29 different variables where each variable is binary in nature and represents the presence of a specific comorbidity with a value of 1 and 0 otherwise and (ii) information on the severity score on each comorbidity, ranging from -7 to 12 with larger weights representing more severe comorbidities (Elixhauser et al. 1998). Thus the Elixhauser severity score is the dot product of the Elixhauser Index and the severity score. Information on comorbidities is provided in the OSHPD database. We convert the comorbidity description as a 0/1 binary variable, and use the severity score published in literature (Elixhauser et al. 1998) to arrive at the severity score for each patient. The scores in our sample range from -18 to 60.
28
medication types, treating the right part of the body, etc. (Seiden and Barach, 2006). The OSHPD database provides information on up to 21 procedures performed on a patient besides the main procedure that was performed for definitive treatment. We sum up the procedures done on each patient to arrive at our measure of coordination complexity.
We also control for various characteristics such as patient age (years), gender (female = 1, male = 0), race (three categories), insurance type (Medicare, Medicaid, Private, Self-pay), admission type (unscheduled = 1, scheduled = 0), day of admission (weekend = 1, weekday = 0), month of admission, major diagnostic codes, and hospital fixed effects. We drop observations with missing data on any of the control variables. We delete observations with incorrect dates e.g. discharge date before the admission date, procedure dates before the admission date as these were listed with negative LOS in the OSHPD dataset. We also consider only 99% of the observations, as the remaining 1% of the observations have very high LOS (several values ranged from 100 to 1000 days, possibly due to data entry errors) and which can potentially result in a highly skewed distribution. Joining the various datasets described above results in 2.20 million patient records. A summary of the variables described above is given in Tables 2.1 and 2.2
Table 2.1: Descriptive Statistics of Variables used in main analysis
Variables Mean Std. Deviation Minimum Maximum
LOS 4.314 4.566 1 35
29
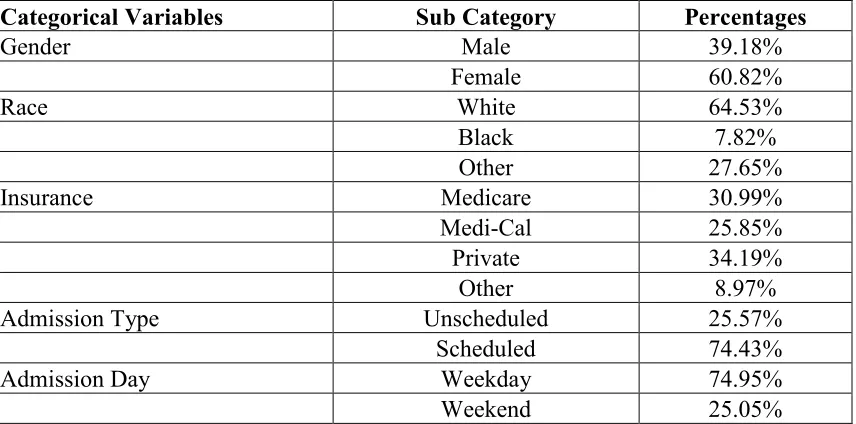
Categorical Variables Sub Category Percentages
Gender Male 39.18%
Female 60.82%
Race White 64.53%
Black 7.82% Other 27.65% Insurance Medicare 30.99% Medi-Cal 25.85% Private 34.19% Other 8.97% Admission Type Unscheduled 25.57%
Scheduled 74.43% Admission Day Weekday 74.95% Weekend 25.05%
Table 2.2: Hospital Level Characteristics used in selection model
Variables Mean Std. Deviation Min Max
Teaching Status (0 = Non-Teaching, 1 = Teaching) 0.091 0.288 0 1 Profit Goals (0 = For Profit, 1 = Not For Profit) 0.582 0.494 0 1 Location (1 = Rural, 2 = Semi-Urban, 3 = Urban) 1.752 0.500 1 3 Hospital Size 248.193 170.874 10 1500 Case Mix Index 1.519 0.260 0.782 2.604 IT Technologies 38.484 12.193 7 62 System Membership (0 = Yes; 1 = No) 0.445 0.497 0 1 Competition 34.859 28.842 8 81
30
CMS Inpatient Prospective Payment System (IPPS) file and HIMSS database. All data sources are joined together with the CMS unique Medicare Identifier number. Since we have missing hospital identifier data in various datasets, after joining, we end up with 282 hospitals in the combined dataset. As information from the self-selection model is incorporated into our main analysis, our final patient level data has 2.18 million patient records. In this dataset, we have 47 hospitals that underwent MU_EHR in 2011 and treated 0.48 million patients using these systems. The remaining 235 hospitals did not undergo MU_EHR at the end of 2011 and treated 1.70 million patients. We provide a comparison of MU_EHR certified and Non MU_EHR certified hospitals in Table 2.3 below.
Table 2.3: Comparative Statistics for MU_EHR certified and Non MU_EHR certified hospitals
Variables MU_EHR Certified
(Means)
Non MU_EHR Certified
(Means)
LOS 4.098 4.375
Readmission 0.097 0..108
Disease Complexity 1.519 1.451 Comorbidity Complexity 3.377 3.202 Coordination Complexity 2.478 2.549
Patient Age 46.173 45.780
Teaching Status (0 = Non-Teaching, 1 = Teaching) 0.155 0.079 Profit Goals (0 = For Profit, 1 = Not For Profit) 0.80 0.541 Location (1 = Rural, 2 = Semi-Urban, 3 = Urban) 1.777 1.747 Hospital Size 274.556 243.250 Case Mix Index 1.556 1.513 IT Technologies 47.844 36.729 System Membership (0 = Yes; 1 = No) 0.667 0.404
Competition 30.311 35.713
Categorical Sub Category MU_EHR Certified Non MU_EHR Certified
31
Female 59.81 61.10 Race White 53.74 67.56
Black 8.93 7.51
Other 37.33 24.92 Insurance Medicare 31.96 30.72 Medicaid 11.35 29.93 Private 51.19 29.41
Other 5.50 9.94
Admission Type Unscheduled 27.27 25.09 Scheduled 72.73 74.91 Admission Day Weekday 74.71 75.02 Weekend 25.29 24.98
2.6 Econometric Model
A major concern in evaluating the impact of MU_EHR on patient LOS is a hospital’s potential endogenous decision-making process on whether to go sooner or later for the attestation. While certain observable hospital characteristics such as hospital size, profit goals of the hospital, system membership, etc. have been identified in previous literature as factors that likely affect early attestation decision (Jha et al. 2010; Diana et al. 2014), other unobservable factors such as a cost benefit analysis could also play a key role in impacting this decision. Ignoring the impact of these characteristics may render a biased estimate of the effect of meaningful use of EHRs on patient length of stay (LOS). We use a two-stage treatment effects model to account for endogeneity in the binary variable measuring MU_EHR certification (Maddala 1983; Guajardo et al. 2012). This approach allows us to estimate the effect of a binary treatment, MU_EHR in this case, on patient LOS. The two-stage treatment effects model is represented by the following set of equations:
32
= + + · +
= 1 ( + > 0)
(2) (3)
The main coefficient of interest is α in equation 1 and γ in equation 2. Yih, which
denotes the log transformed patient i’s LOS at hospital h, is explained by exogenous covariates Xih, described in the previous section, and the endogenous binary variable Zh,
which is coded as 1 for hospitals that achieved meaningful use in 2011 and 0 for hospitals that did not. It should be noted that although a hospital received MU_EHR certification at the organizational level, this certification is achieved only if at least 80% of its patients are treated via these systems. Thus MU_EHR affects individual patients and is not just a change that happens at the hospital level, which in turn justifies our approach of studying the impact of MU_EHR using patient level data.
The standard procedure is to model the binary variable for MU_EHR attestation decision as an indicator function that depends on a set of exogenous covariates Wh ,
which drive the decision to attest for meaningful use sooner than later. The unobservables are captured through their mean effect in the treatment decision on the treatment outcome (Tucker 2011); εih denotes the error term in the performance model, and vh denotes the
33
! " # $ = %(&( )) = 1; −%( )
)1 − &( )* = 0
(4)
34
2.7 Results
35
use of EHRs actually see a slight reduction in their LOS for such patients. While the effects may not seem very high, it is still preferable to the alternative where such patients would have stayed longer in the hospital and potentially increased the risk of hospital-acquired readmissions.
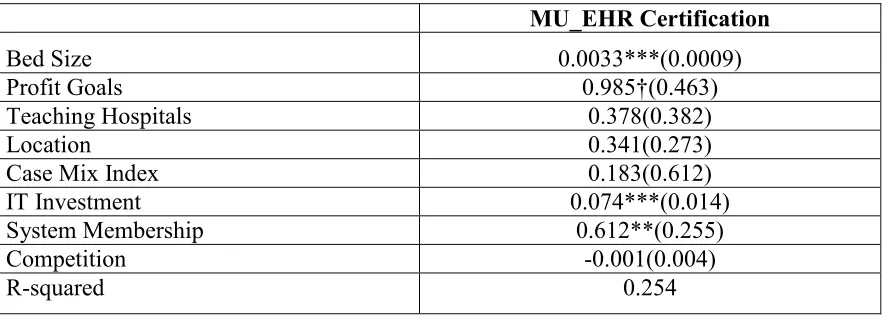
With respect to the choice equation, the results indicate that larger hospitals, non-profit hospitals, hospitals that do not belong to a system and hospitals with greater investments in other clinical, administrative and strategic technologies are more likely to go for meaningful use sooner.
Table 2.4: Main Results
(1) (2) (3) (4)
LOS Base
Model Disease Complexity Comorbidity Complexity Coordination Complexity
MU_EHR -0.088*** (0.004) -0.069*** (0.002) -0.081*** (0.003) -0.109*** (0.003) Disease Complexity 0.090*** (0.002) 0.142*** (0.003) 0.090*** (0.002) 0.092*** (0.002) Comorbidity Complexity 0.053*** (0.0008) 0.053*** (0.001) 0.55*** (0.0009) 0.053*** (0.0008) Coordination Complexity 0.051*** (0.002) 0.049*** (0.002) 0.050*** (0.002) 0.071*** (0.004) MU_EHR X Complexity -0.004*** (0.0002) -0.006*** (0.001) -0.002*** (0.0003) Selectivity Term -0.026*** (0.004) -0.038*** (0.004) -0.090*** (0.006) -0.017*** (0.004) Patient
Demographics Yes Yes Yes Yes Time Controls Yes Yes Yes Yes Hospital Fixed
36
Table 2.5: Choice Model Results
MU_EHR Certification
Bed Size 0.0033***(0.0009) Profit Goals 0.985†(0.463) Teaching Hospitals 0.378(0.382)
Location 0.341(0.273)
Case Mix Index 0.183(0.612) IT Investment 0.074***(0.014) System Membership 0.612**(0.255) Competition -0.001(0.004)
R-squared 0.254
†, *, **, *** Indicate significance at the 10%, 5%, 1%, and 0.1% confidence levels, respectively
2.7.1 Post Hoc Analysis of EHRs’ Impact on Readmissions
37
As per CMS guidelines, we consider patient readmissions within 30 days. The OSHPD data provides a unique patient identifier, which we use to code our readmission as a binary variable, where 1 indicates that a person was readmitted within 30 days; and 0 indicates otherwise. Our dataset has missing information on several patients’ unique identifier number. We deleted these records, as they are unusable in calculating the readmission measure. Our resulting sample size is 1.74 million records, with 0.47 million hospitals that have meaningfully used EHRs and 1.33 million for hospitals that have not. We run a Probit regression here, and results from this analysis are shown in Table 2.6. As shown in column 1, MU_EHR is associated with lower readmission rates for all patients. This is a very encouraging sign that while hospitals reduce LOS via MU_EHR, they also reduce readmissions for their patient population. In addition, as shown in columns 2 and 4 of Table 2.6, MU_EHR also reduces readmissions for patients with greater disease and coordination complexity. The impact of MU_EHR on readmissions is not significantly different between patients with higher and lower comorbidity complexity.. Managing comorbidities is challenging as it may require adherence to a self-management program, prioritizing care and initiating lifestyle changes (Kerr et al., 2007). Easy access to self-management tools is not required in the first stage of MU_EHR, but is built into stage 3 requirements (which have not yet been finalized). We conjecture that this might be the reason why we do not see an effect on readmissions for patients with higher comorbidity complexity as this study looks at only the first stage of MU_EHRs.
Table 2.6: Post-Hoc Results for Readmissions
(1) (2) (3) (4)
Readmission Base
Model
Disease Complexity
Comorbidity Complexity
Coordination Complexity
38
(0.015) (0.016) (0.033) (0.017) Length of Stay 0.033*** (0.001) 0.033*** (0.001) 0.034*** (0.002) 0.038*** (0.001) Disease Complexity 0.031*** (0.003) 0.121*** (0.011) 0.030*** (0.003) 0.051*** (0.004) Comorbidity Complexity 0.049*** (0.001) 0.047*** (0.001) 0.049*** (0.002) 0.051*** (0.002) Coordination Complexity 0.924*** (0.028) 0.992*** (0.026) 0.925*** (0.027) 0.894*** (0.028) MU_EHR X Complexity -0.006*** (0.001) -0.002 (0.002) -0.003*** (0.0004) Selectivity Term 0.738*** (0.021) 0.721*** (0.021) 0.742*** (0.023) 0.702*** (0.021) Patient
Demographics Yes Yes Yes Yes Time Controls Yes Yes Yes Yes Hospital Fixed
Effects Yes Yes Yes Yes Pseudo
R-squared 0.153 0.155 0.154 0.154 Observations 1.74 million 1.74 million 1.74 million 1.74 million Note: Robust standard errors are in parentheses and are clustered at the hospital level *, **, *** Indicate significance at the 5%, 1%, and 0.1% confidence levels, respectively
2.8 Conclusions and Discussion
39
this analysis helps us to understand the impact of MU_EHR, it does not tell us whether the benefits were sustainable over subsequent years. Future research can use our study as a building block and look into this issue. We also do not compare the performance of hospitals that underwent MU_EHR certification in 2011 versus 2012 and so on.. Future research can address this issue as well. Nevertheless, our study makes several important theoretical and practical contributions to literature that can serve as a building block for future work in this area. We highlight these contributions next.
2.8.1 Contributions to Theory
40
make it difficult to evaluate which clinical units in a hospital are actually using these EHRs. The hospital-wide standardized criteria developed for MU_EHR attestation highlights a need to use well-defined measures to clearly evaluate the impact of EHRs on patient outcomes.
In this study, we have been able to delve into the specific mechanisms through which EHR technologies impact hospital resource efficiency for a diverse group of the patient population. To our knowledge, this is one of the first studies to consider the effects of the meaningful use mandate HITECH Act on a hospital’s resource efficiency using detailed patient level data. We look at MU_EHR as a group systems support technology that helps in alleviating the cognitive load on healthcare providers, thus extending the discussion on the benefits of such systems in the healthcare operations area. We also conceptualize the task of treating a patient into three types of complexity profiles based on the degree of difficulty in accomplishing the task of treating a patient i.e. a patient’s disease complexity, the degree of patient severity i.e. comorbidity complexity, and degree of coordination required among healthcare providers to accomplish the task of treating the patient i.e. coordination complexity. While these dimensions of task complexity have been conceptualized previously (Campbell, 1988; Wood, 1986), they have been focused mostly in the behavioral sciences and typically studied in controlled laboratory experiments or through case studies (Liu and Li 2012). We are one of the first to do this in the context of healthcare operations management using objective large-scale
secondary data. Past healthcare literature has only controlled for patient demographics,
41
task complexities as they significantly increase the LOS in patients. We are thus able to uncover the additional value that EHR technologies, when used meaningfully, add while treating patients with greater complexities. Specifically, our analysis shows that while MU_EHRs reduce LOS for all patients, these systems improve to a greater degree the efficiency with which patients with a higher degree of disease complexity, comorbidity complexity, and greater coordination needs, are treated. By integrating the literature on task complexity and task-technology fit into the healthcare context, our study underscores the importance of implementing and meaningfully using a hospital wide EHR system, especially when hospitals treat patients with complex disease and comorbidity profiles who require treatment from multiple healthcare providers. In doing so, our paper also answers the call of various researchers on the use of more granular data for understanding and advancing research on the performance impacts of information technology (Agarwal et al. 2010, Athey and Stern 2002, and Himmelstein et al. 2010).
42
patients spend less time in the hospital, which may reduce hospital acquired infections, and therefore readmissions. Providing the right treatment at the right time also ensures that patients are less likely to be readmitted to hospitals.
2.8.2 Implications for Practice
This study is motivated by the government’s push to hospitals to adopt and use EHR technologies in a meaningful way, and so is highly relevant to hospital management and executives in the current healthcare environment characterized by cost containment pressures and reduced reimbursement for services. Collectively, our results show that MU_EHR, based on the first stage requirements that mandate hospitals to capture patient information systematically in an electronic format and use built-in treatment protocols for treating these patients, really helps in reducing overall length of stay and also readmission rates. These gains are even more beneficial for certain patient populations. A study by (Hillestad et al. 2005) noted that greater efficiency from EHRs could lead to potential savings of more than $77 billion per year. Their study also noted that one of the most important sources of these savings come from reduced hospital length of stay, a result that our research confirms as well, though with a greater degree of granularity and contingencies in empirically confirming that the MU_EHR mandate can help achieve these projected savings by reducing the length of stay.
43
avoiding adverse drug events, and another 18% or $9.4 million of savings came from increased unit efficiency (http://health.usnews.com/health-news/hospital-of-tomorrow/articles/2013/11/05/taking-a-close-look-at-electronic-health-records). In view of increased workloads that hospitals are now facing due to a greater number of insured patients seeking hospital services under the Affordable Care Act, MU_EHR can facilitate more effective bed management and efficient operations by freeing up capacity through faster patient turnaround times. This approach will be preferable to making additional investments in beds or human resources.
44
CHAPTER 3
LONGITUDINAL IMPACT OF PROCESS IMPROVEMENT ON
PATIENT CARE UNDER COMPETITION AND ACA2
Abstract
Our study examines the impact of competition on process of care (PoC), and the role process improvement factors play on affecting PoC within the altered competitive landscape that has been created in the healthcare industry by the introduction of the Affordable Care Act (ACA) of 2010. ACA acts as a catalyst in increasing competition among all hospitals to attract more patients and improve PoC. A longitudinal analysis of data combined from several different sources shows the contingent value of process improvement factors. Their impact on PoC is positive in both more as well as less competitive markets; however the marginal benefit is stronger in less competitive markets. These results are robust to alternate specifications of competition. We find similar results when considering the catalytic role played by ACA in enhancing competition. We discuss the prescriptive implications of our findings for designing better operational systems in the context of ACA and the increased financial burden that hospitals are facing due to reimbursements shifting from a fee-for-service based system to one based on the value of care provided.
Keywords: Slack, Skill Mix, Focused service strategy, Competition, ACA
45
3.1. Introduction
The US healthcare system over time has evolved from a fee-for-service system which traditionally focused on paying providers based on the volume and complexity of services, to a prospective payment system which encouraged a reduction in excessive and unnecessary care by providing a fixed payment for services rendered (James, 2012). However, researchers conjecture that this led to a reduction in treatment intensity and resulted in greater medical errors, readmissions and mortality (Cutler, 1995; Encinosa and Bernard, 2005). The Affordable Care Act (ACA) was introduced in 2010 to rein in such inefficiencies and to promote greater coordination across providers of services by creating financial incentives that encourage organizations to deliver efficient and high quality medical care (http://obamacarefacts.com/affordablecareact-summary/).
46
challenging and winning a number of recent attempts at consolidation in the healthcare industry by arguing that such consolidations operate without the checks and balances of a competitive marketplace (Brill, 2015; New York Times, 2014). So apart from consolidations, hospitals are also forced to seek ways to attract insurers, referring physicians, and patients to improve their revenues, and to improve profitability by emphasizing efficiency in various areas of their operations (Devers et al. 2003; Cutler et al., 2004; Tay, 2003). This competitive landscape is further enhanced by the ACA. It has increased insurance coverage for millions of people causing hospitals to compete for these patients, especially since demand for services is often localized (Tay 2003). In addition, the ACA has also created the hospital value based purchasing (VBP) program that provides financial bonuses to hospitals that improve the value delivered to patients and penalizes others that do not.
How does such a shift toward more competitive conditions for capturing patient demand affect process of care (PoC)? Further how should hospital managers make resource allocation decisions based on their constrained finances to improve hospital processes that ultimately improve patient outcomes? In particular, what is the value of investing in process improvement factors when localized competition for attracting patients is high? This is still an open issue. So in this study, we examine the effect of competition on quality of patient care. Then we unbundle the benefits arising from process improvement factors by validating a finer-grained contingency model that is longitudinally tested with over seven years of panel data.
47
along with the definition and operationalization of key variables, and our econometric model. Results of our analysis and robustness tests are presented in section 3.4. We discuss the impact of ACA on the quality of care in section 3.5. We finally conclude in section 3.6 with a discussion on major theoretical and practical contributions of this study, along with future research directions.
3.2. Literature Review and Hypothesis Development
In this section, we first discuss our choice of dependent variable, followed by a review of the impact of localized competition in the hospital industry on our dependent variable. Then we present theoretical arguments and hypotheses for how competition influences the relationship between our choice of process improvement factors and process of care (PoC).
3.2.1. Choice of Dependent Variable
48
may require longer time horizons to measure (Palmer 1997; Werner et al. 2008). Finally, good PoC has been linked to better patient outcomes such as lower resource usage (Andritsos and Tang 2014), lower readmissions and mortality (Newby et al. 2006; Ashton et al. 1995), and lower rates of infections and complications (McCabe et al. 2009; Bozic et al. 2010). Additionally, PoC leads to higher quality of care for patients because it is also a marker for other unmeasured quality processes that improve patient safety, coordination of care, emergency responsiveness, etc. (Werner et al. 2008). Thus we believe that PoC is an appropriate and comprehensive dependent variable to model in our study.
3.2.2. Choice of Independent Variables
49
in an environment that faces demand fluctuations and patient heterogeneity. Further, registered nurses are at the frontline of patient care and have the necessary technical expertise and knowledge to understand the root causes of various problems, identify and prioritize areas of PoC that need most attention, and conceptualize effective solutions through appropriate training (Fields and Sinha 2005; Mukherjee et al. 1998). Finally, a focused service strategy results in stable and standardized work processes through repeated encounters with a homogeneous set of patients (Skinner 1974), which in turn improve organizational learning capabilities as well as PoC (KC and Terweisch 2011). The three process improvement factors of slack, skill mix, and focused service strategy together represent the thrust of process improvement efforts that hospitals can leverage to positively affect PoC.
3.2.3. Impact of Competition
50
hospitals and prices are regulated, outcomes such as mortality and readmissions are better (Kessler and Geppert, 2005; Kessler and McClellan, 1999; Shen, 2003). Both Gaynor (2006) and Gaynor and Town (2011) provide a comprehensive review of studies that look at the relationship between competition and quality.
51
outcomes. Such actions have been shown to improve process of care in cardiac patients (McConnell et al. 2013). Thus constant innovation spurred by competition results in continuous quality improvement (Teisberg et al., 1993) and better PoC. As a result, we would expect PoC to be higher in more competitive markets.
H1: Greater competition in hospital markets is associated, on average, with better
PoC
3.2.4. Moderating Role of Competition on the Relationship between Process
Improvement Factors and Process of Care
52
3.2.5. Slack
Operational slack, a key process improvement factor, refers to the flexibility available to a firm to effectively manage variations in a dynamic environment (Anand and Ward, 2004). When utilization is high or slack is reduced, a greater number of patients have to be treated at any given time. Such high utilization has been associated with reduced time spent on each patient, a greater propensity for errors, reduced worker productivity, lower medical treatment quality, lower length of stay, and increased mortality ( Berry Jaeker and Tucker, 2013; Kc and Terwiesch, 2009 and 2012). Patients may be placed in less appropriate units for recovery, because the primary unit that they need is unavailable (Green and Nguyen, 2001). Due to greater mental strain on healthcare workers when there is less slack, probability of adverse events unrelated to a patient’s underlying medical condition is higher (Rudolph and Repenning, 2002; Weissman et al., 2007). Lower slack may also inhibit the efforts of healthcare workers to find the root causes of process failures (Tucker and Edmondson, 2003). Thus higher slack will improve PoC due to better adherence to necessary protocols of care driven by evidence-based medicine.
53
Slack in less competitive markets can serve two purposes. First, it can serve as a deterrent for other hospitals to increase capacity or to prevent new hospitals from opening up i.e. slack creates entry barriers (Salop, 1979). Second, as hospitals in less competitive markets may not face pressures to continually invest heavily in the latest equipment and technologies, they may be able to tolerate more slack in their operations and use this slack to engage in relatively less expensive quality improvement efforts such as imparting training to existing workers on understanding correct protocols for reducing errors and preventing infections, creating cross-functional teams, and using appropriate problem identification and solving tools (Silow-Carroll et al., 2007). While the benefits of slack in improving quality are unequivocal, slack is more readily available in less competitive markets and so will provide relatively greater benefits.
H2A: Competition moderates the relationship between slack and PoC, such that the
positive relationship between slack and PoC, on average, is stronger in less
competitive markets
3.2.6. Nursing Skill Mix
54
care are followed correctly, which in turn help in detecting and treating complications, preventing adverse events such as surgical infections, pneumonia, wounds, etc. (Needleman et al., 2006; Lang et al., 2004; Cho et al. 2003). Finally, registered nurses are more productive than other nurses as they can perform the entire range of nurse related tasks without supervision (Barkell et al., 2002).
55
cognitive tasks (Autor et al., 2003). Thus technology investments in competitive markets will likely complement a higher skill mix in improving PoC.
In less competitive markets, we have the opposite scenario where there are few employers of RNs. Thus hospital employers have more market power and registered nurse wages are lower (Bruggink et al. 1985; Robinson 1998). Hospitals in less competitive markets are also likely to put more emphasis on training, development and empowerment of their nurses than on providing high technology related services (Li and Benton 2006). Given the importance of skilled registered nurses in improving PoC and a less acute need to continually invest in new technology and equipment, we would expect such hospitals to improve their PoC to a greater extent through investments in higher skill mix. Thus greater benefits from high skill mix will be possible in less competitive markets.
H2B: Competition moderates the relationship between skill mix and PoC, such that
the positive relationship between skill mix and PoC, on average, is stronger in
less competitive markets
3.2.7. Focused Service Strategy
56
processes, as well as better integration of processes which subsequently help in reducing variations in the delivery of care as well as improving efficiency of care. Thus a focused service strategy is likely to improve PoC.
Hospitals in more competitive markets may follow a focused service strategy to achieve economies of scale. On the other hand, they may choose to add an extensive range of complementary services and become a ‘one stop shop’ to achieve economies of scope. This approach also enables hospitals to attract insurers by providing an array of services thereby reducing contracting costs (Devers et al, 2003). While both scenarios are plausible, findings from studies suggest that hospitals in competitive markets adopt the latter approach (Baker and Phibbs, 2000; Friedman et al., 2002). We have argued earlier that hospitals in more competitive markets are forced to constantly innovate in order to improve their quality. While it is possible to use a focused strategy i.e. perform a narrow set of procedures on a larger volume of patients and achieve higher quality through organizational learning and exploitation of internal capabilities (Kc and Terweisch, 2009), focus on development of core capabilities in just a single area may lead to a decayed competitive stance (Miller et al, 2007). Therefore hospitals in a more competitive environment are likely to be less focused, and thus not be able to improve PoC to the same extent as hospitals in less competitive environments.
57
throughput to ensure high quality of care. Also, hospitals in less competitive markets may not be forced to constantly innovate, but they still need to improve their PoC. Focusing on a narrow set of procedures may also result in simplified routines through which knowledge can be acquired and exploited to treat patients. We would thus expect the marginal benefit from a focused service strategy to be greater is less competitive markets.
H2C: Competition moderates the relationship between a focused service strategy and
PoC, such that the positive relationship between a focused service strategy and
PoC, on average, is stronger in less competitive markets
Our models for analysis based on these hypotheses are provided in Figure 3.1.
58
3.3. Data Sources, Variables and Econometric Model
Our data sample for this analysis is a comprehensive dataset that comes from three different databases. Although measuring all important processes of care is virtually impossible, we use the process of care measures reported on Center for Medicare and Medicaid Services’ (CMS) Hospital Compare website as a proxy for our PoC. It should be noted that although CMS reports only a subset of PoC, they are an important marker for other measures of care that are equally important, but are not measured (Werner et al 2008). Data for the internal and external hospital factors are collected from California Office of Statewide Planning and Development’s (OSHPD) Annual Financial database (AFD). Various hospital characteristics are compiled from CMS’ Inpatient Prospective Payment System (IPPS). Our unit of analysis is acute care hospitals in the state of California. Our data is longitudinal in nature, covering years 2007 – 2013. We describe below the key measures for the variables used in the study.
3.3.1. Dependent Variable
59
measures of AMI, HF, PN and SCIP used in the prior literature, and which are common across all years (Senot et al., 2015). Each measure represents the percentage of each hospital’s patients as a ratio of the number of people who actually received the treatment to the number of patients that are eligible for the treatment. Following CMS guidelines, only measures based on a sample of at least 25 patients are included in the study. The PoC components used in this study are listed in Appendix B.
We compute a weighted composite measure across all selected measures. In order to satisfy normality and homoskedasticity assumptions of regression analysis, we transform this weighted measure into their Logit form similar to prior literature (Chandrasekaran et al., 2012). Thus our PoC measure for hospital i at time t with the weighted average percentage across process of care measures Pit is given by:
+ , = - .1 − ++, ,/
3.3.2. Key Variables
Our data for operational slack, skill mix and focused service strategy come from California Office of Statewide Planning and Development’s (OSHPD) Annual Financial database (AFD).
Slack
The AFD provides the annual licensed bed occupancy rate as the ratio of patient days to the total available bed days for each hospital for each year. We calculate our slack measure with the following equation, where higher values represent greater operational slack.