University of South Carolina
Scholar Commons
Theses and Dissertations
1-1-2013
Doc Dynamics In Eddies of the Sargasso Sea
Eric Matthew Lachenmyer University of South Carolina - Columbia
Follow this and additional works at:https://scholarcommons.sc.edu/etd Part of theMarine Biology Commons
This Open Access Thesis is brought to you by Scholar Commons. It has been accepted for inclusion in Theses and Dissertations by an authorized administrator of Scholar Commons. For more information, please contactdillarda@mailbox.sc.edu.
Recommended Citation
Lachenmyer, E. M.(2013).Doc Dynamics In Eddies of the Sargasso Sea.(Master's thesis). Retrieved from
DOC DYNAMICS IN EDDIES OF THE SARGASSO SEA
by
Eric M. Lachenmyer
Bachelor of Science
University of South Carolina, 2011
Submitted in Partial Fulfillment of the Requirements
For the Degree of Master of Science in
Marine Science
College of Arts and Sciences
University of South Carolina
2013
Accepted by:
Tammi L. Richardson, Director of Thesis
Erik M. Smith, Reader
Seth G. John, Reader
ii
iii ABSTRACT
Bacterial productivity and size-fractioned rates of dissolved organic carbon (DOC)
excretion from primary and secondary producers were measured in two eddy types, one
anti-cyclonic (February 2012) and one cyclonic eddy (July 2012), in the Sargasso Sea.
Bacterial productivity (BP) rates in the cyclonic eddy were highest in the center (9.2 mgC
m-2 d-1) and edge (10.4 mgCm-2d-1) of the eddy compared to the anti-cyclone center (2.2
mgC m-2 d-1) and edge (5.1 mgC m-2 d-1). Rates of DOC excretion from 14C-tracer
experiments were not significantly higher than background; lack of accumulation of
labeled material indicated very fast uptake of DOC by the bacterial community. Since
rates were not measureable in the field, an inverse modeling approach was used to
estimate flows to and from the DOC pool for three stations (center, edge, and outside)
in the cyclonic eddy sampled in 2012. DOC excretion rates by phytoplankton were
between 10.1 and 14.5 mg C m-2 d-1. These values on average were 11.7 % of the total
primary production. Generally, DOC excretion was higher inside the eddy compared to
the edge and outside the eddy. Modeling results indicated that one of the largest
potential fates of DOC in this ecosystem was advection out of the euphotic zone.The
highest rates of DOC advection were seen inside the eddy center, decreasing moving to
iv
TABLE OF CONTENTS
ABSTRACT ... ii
LIST OF TABLES ... v
LIST OF FIGURES ... vi
CHAPTER 1:INTRODUCTION….………..…..………..1
CHAPTER 2: DOC EXCRETION AND BACTERIAL PRODUCTIVITY IN MESOSCALE EDDIES OF THE SARGASSO SEA . 7 2.1OBJECTIVE ... 7
2.2METHODS ... 9
2.3RESULTS ... 16
2.4METHODS ... 17
CHAPTER 3: INVERSE MODELING OF DOC FLOWS IN MESOSCALE EDDY FOOD WEBS OF THE SARGASSO SEA ... 31
3.1INTRODUCTION ... 31
3.2METHODS ... 33
3.3RESULTS ... 35
3.4DISCUSSION ... 36
3.5CONCLUSION ... 41
v LIST OF TABLES
Table 2.1 Experiments conducted in the Sargasso Sea in 2011 and 2012 ... 25
Table 3.1 Symbols used in the Sargasso Sea food web ... 43
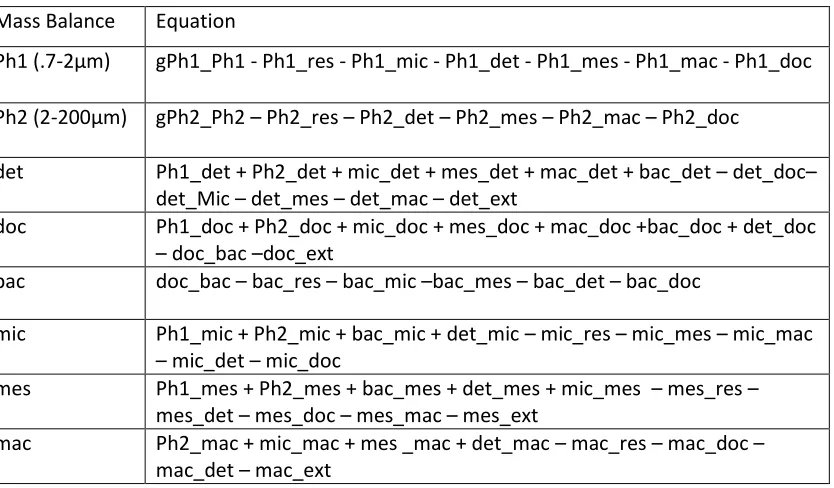
Table 3.2 Mass balance relationships used in inverse model analysis ... 44
Table 3.3 Biomass and carbon production values ... 45
Table 3.4 Inverse analysis flow constraints for food web construction ... 46
vi LIST OF FIGURES
Figure 2.1 Cruise tracks and sampling locations ... 24
Figure 2.2 Representative data from phytoplankton DOC excretion experiments ... 26
Figure 2.3 Time series DOC incorporation and excretion rate measurements ... 27
Figure 2.4 Representative data for antibiotic addition experiments ... 28
Figure 2.5 Simulated in-situ grazer-addition experiments ... 29
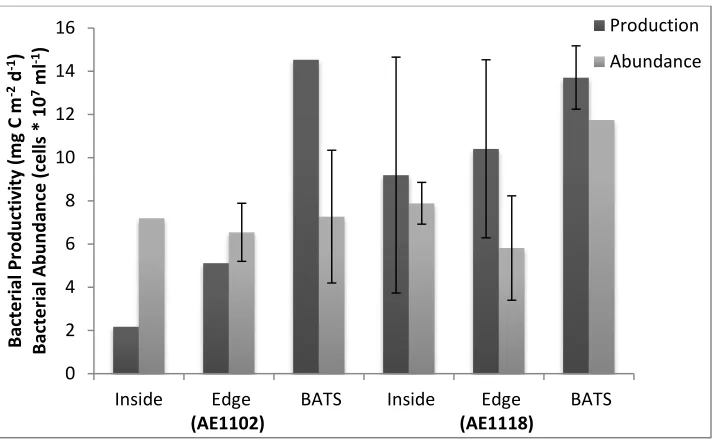
Figure 2.6 Rates of bacterial productivity and bacterial abundance ... 30
Figure 3.1 Food web constructed for cruise AE1118 ... 49
Figure 3.2 Modeled DOC excretion from size fractionated phytoplankton ... 50
Figure 3.3 Modeled DOC excretion from size fractionated zooplankton ... 51
Figure 3.4 Modeled DOC excretion by bacteria and from detrital degradation ... 52
1
CHAPTER 1
Introduction
Dissolved organic carbon (DOC) fuels bacterial growth (Carlson et al., 1996) and
represents the largest pool of reduced organic carbon in the ocean (Carlson, 2004) with
a reservoir of about 662 ± 32 Pg C (Hansell & Carlson, 2013). The DOC pool is comprised
of amino acids, lipids and carbohydrates (Kawasaki & Benner, 2006). There are three
main categories of DOC: labile, which has a lifetime of less than a day, semi-labile with a
lifetime of days to weeks, and refractory DOC which may exist for months to years
(Carlson, 2002). Labile DOC is the only form that can be rapidly overturned by bacterial
populations, while semi-labile DOC is resistant to rapid microbial degradation in the
surface waters but is available for microbial remineralization once it reaches the
mesopelagic zone (Carlson, 2004). The fate of DOC, especially the labile form, is recycled
by heterotrophic bacteria within the microbial loop (Nelson and Carlson, 2012). This
remineralization of DOC may result in the production of refractory carbon or DIC in the
form of CO2 (Reithaler, 2008). In the Sargasso Sea, rates of bacterial remineralization of
DOC can be as high as 0.1 µM C/h (Carlson, 1996).
The production of DOC in ocean ecosystems is ultimately constrained by rates of
2
high percentage of DOC in the ocean through excretion, phytoplankton cell lysis and via
sloppy feeding by grazers (Goldman et al., 1992; Lancelot, 1979; Strom et al., 1997).
Other sources of labile DOC include zooplankton excretion and egestion (Kirchman,
1992; Moller, 2007; Lampert, 1978) and cell lysis from viral infection (Proctor &
Fuhrman, 1991; Fuhrman, 1992).
Rates of DOC excretion are also constrained by the abundance and taxonomic
composition of the primary producers in the ecosystem. Smaller phytoplankton have
been shown to excrete a higher percentage of their assimilated carbon as DOC than
their larger counterparts (Malinsky-Rushansky and Legrand, 1996). This larger excretion
of DOC can have potentially large impacts on food webs and may change the dynamics
of the microbial loop. The release of DOC through sloppy feeding can also be affected by
the size of the phytoplankton being consumed relative to the size of the grazer: as
phytoplankton size increases zooplankton ingestion efficiency decreases, causing more
POM and DOM to be created from grazing of larger organisms (Steinberg, 2004; Nelson,
2012).
Removal of DOC via bacterial uptake is the primary biological consumption
process in the ocean (Pomeroy, 1974; Azam & Hodson, 1977; Azam et al., 1983) and
bacterial production and primary production are closely linked (Brock et al., 1984). In
many aquatic ecosystems, bacterial production varies between 10-20% of primary
production, but in oligotrophic systems 40-60% of primary production may be cycled
3
Kawasaki & Benner, 2006). Although a significant portion of primary production can be
released as DOC, only a small fraction, about 2% of the dissolved organic matter
produced, is labile and thus can be quickly taken up and rapidly turned over (Polimene,
2006). Studies of DOC accumulation and fluctuation performed at the Bermuda Atlantic
Time-series station (BATS, 31 50’N, 6410’W) show that during the winter/spring bloom
period, DOC may comprise up to 86% of the total DOC pool while particulate organic
carbon as suspended particles made up 14% (Carlson, et al., 2002; Lomas, et al., 2004).
This illustrates that DOC is an important part of the Sargasso Sea ecosystem and that the
quantification of the rates of DOC production and consumption is vital to characterizing
carbon flows in this region.
Productivity in the Sargasso Sea is driven by its eddy system, which consists of three
types: anti-cyclonic, cyclonic and mode-water eddies (McGillicuddy, 2007). Anti-cyclonic
eddies are warm-core eddies identified by satellite sea surface altimetry as exhibiting a
positive sea surface height (SSH) anomaly (McGillicuddy et al., 1999). Warm-core eddies
spin clockwise and depress density layers, thus exhibiting downwelling at their centers,
and elevate the sea surface due to the higher density of the water circulating within the
eddy (Siegel et al., 1999; Sweeney et al., 2003). Conditions in this eddy type resemble
the mean conditions at the BATS site which favor picoplanktonic organisms that have
high surface to volume ratios and therefore have a greater capacity for nutrient uptake
(Chisholm, 1992). Cyclonic eddies, in contrast, spin counter-clockwise, and elevate
isopycnal surfaces, resulting in the upwelling of subsurface nutrient-rich water
4
including highly productive diatom species with high half-saturation coefficients that put
them at a disadvantage in the low nutrient conditions of a cyclonic eddy or open ocean
waters (Chisholm, 1992). Mode water eddies have the same rotational direction as
anti-cyclonic eddies but upwell in their interior because of the displacement of the seasonal
pycnocline (Sweeney et al., 2003). The upwelling of nutrient-rich water can lead to long
duration phytoplankton blooms, often of diatoms (Bibby and Moore, 2011).
Physical and biological conditions may vary during the formation (“spin-up”),
intensification and decay phases of the eddy life cycle (McGillicuddy et al., 1997). During
eddy formation, there are only minor effects on the surrounding waters including small
amounts of isopycnal displacement. During eddy intensification, isopycnal displacement
increases, followed by a significant increase in nutrient fluxes to the surface ocean;
stimulating primary production. After a lag time, secondary production and export from
the euphotic zone will increase. The weakening or decay of the eddy causes nutrient
fluxes to diminish even though export production can still remain elevated compared to
background conditions until nutrients are exhausted in the surface ocean (Sweeney et
al, 2003)
Differences in phytoplankton community composition between eddy types imply
that pathways of carbon flow through food webs may also differ between anti-cyclonic,
cyclonic and mode-water eddies. Respiration rates, for example, differ between
anti-cyclonic eddies, which have enhanced respiration rates as compared to anti-cyclonic eddies
5
types, sub-mesoscale variability in planktonic community composition has been
observed. Nelson et al. (2013), for example, have shown that bacterial community
composition near the center of a mode-water eddy differed from other uplifted
isopycnals.
Our current knowledge of the influence of mesoscale eddy dynamics on bacterial
communities is limited, and to date, effects of eddies on bacterial productivity have not
been examined. In this study, DOC excretion and bacterial productivity were
characterized along transects across two mesoscale eddy types (cyclonic and
anti-cyclonic) in the Sargasso Sea. I specifically examined how plankton size, community
composition and trophic interactions modify DOC dynamics and bacterial productivity in
the euphotic zone. My specific research questions were:
1) How do rates of DOC excretion vary among different plankton size classes
and differing eddy types in the Sargasso Sea?
2) How do rates of bacterial productivity differ among different eddy types in
the Sargasso Sea?
This thesis is comprised of four sections including a general introduction (Section 1) and
overall conclusions (Section 4). Section 2 describes field experiments on
size-fractionated phytoplankton and zooplankton DOC excretion rates and measurements of
bacterial productivity. Because some field measurements were difficult to make and for
the large part unsuccessful, I have used a numerical technique known as “inverse
modeling” to reconstruct flows of carbon that were difficult to measure (Vézina and
6
the corresponding results and discussion. Section 4 summarizes the major findings of my
research, including the potential influence of eddy circulation on bacterial productivity
7
CHAPTER 2
DOC Excretion and Bacterial Productivity in Mesoscale Eddies of the Sargasso Sea
Physical, chemical and biological processes in the Sargasso Sea have been
studied from bi-monthly sampling at the Bermuda Atlantic Time Series, BATS station
since 1988 (Steinberg, 2001). The Sargasso Sea is an oligotrophic region that has strong
seasonal pattern of primary production, regularly exhibiting spring blooms resulting
from nutrient inputs from winter mixing. (Michaels et al., 1994). It has a shallow and
well stratified mixed layer in the summer and fall, while in the winter increased mixing
occurs (Sweeney et al, 2003). The Sargasso Sea is an important area in which to study
carbon fluxes because of its capacity to drawdown atmospheric CO2 (Bates, 1996;
Takahashi et al, 2002). The system has been thoroughly studied by several long-term
time series programs which have provided information on its chemistry and food webs
and their effects and controls on the global carbon cycle (Lomas, 2013). Mesoscale
eddies are common and play an important role in regions such as the Sargasso Sea by
altering the seasonal fluctuations in the biogeochemistry of the system. These eddies
can modify nutrient inputs to the system altering biological productivity during their
lifetime. (McGillicuddy, 2007; Nelson et al., 2013).
8
1) Quantify DOC excretion by varying size fractions of phytoplankton
2) Quantify DOC uptake by bacteria using 14C-labeled DOC
3) Quantify DOC excretion rates of zooplankton
4) Determine rates of DOC production in different eddy types
I hypothesized that:
H1: Euphotic zone integrated DOC excretion by picoplankton (.7-2 µm) will exceed that
of the larger phytoplankton (>2 µm).
Rationale: Picophytoplankton are numerically dominant and are the main contributors
to primary productivity in this region.
H2: Rates of DOC production (phytoplankton excretion + zooplankton-mediated) will
vary over a 24hr period, being highest during daytime.
Rationale: DOC production is closely linked to rates of primary productivity which should
increase as light availability increases and thus excretion of excess carbon will occur at
higher rates.
H3: Total DOC production will be higher in cyclonic eddies as compared to anti-cyclonic
eddies.
Rationale: Higher (upwelling-stimulated) rates of primary productivity in cyclonic eddies
9
H4: Total DOC production will increase with increasing abundance of zooplankton and
phytoplankton.
2.2 Methods
This research was conducted as part of a larger National Science Foundation
(NSF)-funded project aimed at determining how plankton size, community composition,
and trophic interactions modify carbon export from the euphotic zone in eddies of the
Sargasso Sea. Water for measurements of DOC excretion rates and bacterial
productivity were collected on three cruises on the R/V Atlantic Explorer in the Sargasso
Sea in August 2011, March 2012 and August 2012 (Figure 2.1). Water was collected from
multiple depths (usually near the surface, at the fluorescence max and two other
intermediate depths) in the euphotic zone from Niskin bottles deployed on pre-dawn
CTD casts (Sea-Bird, 24 position SBE-09 plus). Triplicate (independent) samples were
collected from each depth. Samples were taken from the Niskin bottles using opaque
tubing and were pre-screened with a 200 m Nitex mesh to exclude large zooplankton.
Table 2.1 shows the locations and depths sampled for experiments described below.
2.2.1 DOC excretion by phytoplankton
Rates of DOC excretion by phytoplankton were measured using 14C-bicarbonate labeling
according to Teira (2001). Water samples from multiple depths were distributed into
1-liter polycarbonate bottles. Samples were spiked with 14C-bicarbonate (PerkinElmer
Health Sciences Inc.) to a final activity of 0.08 µCi ml-1 and were incubated on an in situ
10
samples were size-fractionated as follows: DOC excretion by organisms 0.7-200 µm in
size was measured directly by filtering replicate (n=3) 1-liter aliquots of incubated
sample through GF/F filters (= “total”). Duplicate 1-liter aliquots were filtered through a
20µm Nitex mesh, then through a 2 µm Nuclepore filter to yield excretion rates for the
2-20 µm size class. Finally, 1 liter aliquots were filtered through a 20 µm Nitex mesh
then through a GF/F filter to yield rates for the 0.7 – 20 µm size class. Excretion by the
20-200 µm organisms was calculated as the difference between the “total” and the 0.7
to 20 µm size class. All particulate material was analyzed for 14C incorporation (yielding
rates of primary productivity) by a separate investigator (B. Bachman, PhD in prep). This
same procedure was done for dark bottles which served as a control.
After size fractionation, 1 ml of filtrate from each bottle was acidified to a pH of 2 using
0.5 ml of 50% HCl and was de-gassed for 24 hours to release remaining inorganic 14C.
Scintillation cocktail (Ecolume) was then added to the samples; bottles were capped and
counted using a Packard Tri-Carb 2000CA liquid scintillation counter on board the R/V
Atlantic Explorer. Counts per minute were converted to disintegrations per minute using
equation 1: (1)
where DPM is the activity of the samples in units of disintegrations per minute;
is the counts per minute produced by the sample; and is the
11
Rates of DOC excretion were calculated in units of mg C m-3 d-1 using equation 2:
( ( (
(2)
where DPM24 = activity in the filtrate after 24 hour incubation; DPM0 = activity of
(depth-specific) T0 particulate blank; DPMD = average of (depth-specific) dark bottles;
DPMTOT = total activity DPM of isotope added multiplied by volume of water filtered
(DPM/ml); 1.05 = constant that accounts for preferential uptake of the lighter isotope
12
C over 14C; 25,200 = inorganic carbon concentration in seawater (mg m-3).
2.2.2 DOC excretion by phytoplankton over a diel cycle
Water was collected from the fluorescence maximum before sunrise and was
prescreened through a 200 µm mesh to remove large grazers. The water was then
distributed into 24- 250 ml polycarbonate bottles and spiked with 14C bicarbonate to a
final activity of 0.08 µCi ml-1. On deck simulated in-situ Incubations were conducted over
a 24-hour period. Triplicate bottles were removed from the incubator at 0.08, 0.25, 0.5,
1, 3, 6, 12, and 24 hr time intervals. DOC excretion and rates of primary productivity at
each time point were determined by filtering each bottle through a 0.2 µm SUPOR filter.
Particulate material and filtrate (1 ml) was acidified to remove unincorporated 14C,
Ecolume was added and radioactivity of samples was quantified as described above.
12
Additional experiments using erythromycin additions were conducted to inhibit uptake
of excreted DOC by bacteria (and to improve signal to noise) during on-board
incubations. Water was collected from two depths (surface & fluorescence max) from a
CTD cast before sunrise and was pre-screened through a 200 µm Nitex mesh to remove
large grazers. Water was distributed into 8-250 ml bottles per depth, which included
triplicates of control (no erythromycin) and treatment (addition of 10 µg/ml
erythromycin) bottles plus two dark bottles for each depth. All bottles were spiked with
14
C bicarbonate to a final activity of 0.08 µCi ml-1 (as described in section 2.2.1) and
incubated for 24 hours on-deck in flow-through incubators. Incubators were screened to
simulate the light intensity at the depth of collection. After incubation, DOC excretion
and rates of primary productivity were determined by filtering each bottle through a 0.2
µm SUPOR filter. Particulate material and filtrate (1 ml) were acidified to remove
unincorporated 14C; Ecolume was added and radioactivity of samples was quantified as
described above.
2.2.4 Zooplankton Excretion Rates
To determine DOC excretion rates by zooplankton feeding on phytoplankton, water was
collected from two depths in the euphotic zone (surface and fluorescence maximum).
Two phytoplankton size classes were incubated separately (0.7-200 µm and 0.7-100
µm). To distinguish between the two size classes, half of the water from each depth was
filtered through a 100 µm and or 200 µm Nitex mesh. Large zooplankton were collected
13
23:15 the night before the experiment. Copepods (Pleuromamma species) were
collected and put into a 2-liter jar with filtered sea water (0.7 µm) for at least 4 hours to
allow the copepods to clear their guts. Two different densities of copepods (2 or 5
individuals/liter) were added to 1 liter of water collected at each depth, with three
replicates per copepod density. All bottles were spiked with 14C bicarbonate to a final
activity of 0.08 µCi ml-1 per bottle. Incubations were done on-deck for 24 hours, then
collected and filtered through a 0.2μm SUPOR filter in red light conditions to limit
production after experiment termination. Methods for sample processing are the same
as described above in section (2.2.1).
2.2.5 Uptake of labile DOC by bacteria
Phytoplankton-derived 14C-labeled DOC was prepared by collecting natural
phytoplankton communities from the fluorescence maximum, adding 14C bicarbonate to
each bottle (to a final activity of 0.16 µCi/ml) and incubating on-deck (as in 2.2.3) for 4
hours. After incubation, samples were filtered through 0.2 µm cellulose membrane
SUPOR filters under low light. Filters in sets of two were transferred to a snap cap vial
and 2ml of boiling Milli-Q water was added to quickly lyse the cells. After vigorous
vortexing, the solution was transferred to a 25ml Falcon tube. The combined filtrate was
vortexed to create a homogenous sample. The extract was then acidified to a pH of 2
and left on a shaker table for 12 hours to eliminate unincorporated 14C-bicarbonate. A
small portion of this extract was taken and read on a liquid scintillation counter to
14
dark conditions until the next pre-dawn CTD cast. Water was then collected before
dawn from the fluorescence max and apportioned into 0.25 L polycarbonate bottles.
Triplicate samples (7 sets) were then spiked with 1ml of the previously created 14DOC
and incubated in the on-deck incubator (as in 2.2.3). Three vials were collected at each
of the seven time points (T= 0, 0.25, 0.5, 1, 2, 3, and 6 hours) and were processed as
described above.
2.2.6 Bacterial Productivity using 3H-thymidine
On each cruise, bacterial productivity was estimated using the incorporation of 3
H-thymidine following standard BATS methods (Knap et al., 1997) according to:
( ⁄ ⁄ ([ ] ⁄ ⁄ (3)
where
F = Production of bacterial cells per mole 3H-thymidine
The bacterial production (cells/l/hr) is then converted to carbon units using a conversion factor B,
([ ] ⁄
where
⁄ (Kawasaki et al., 2006)
Bacterial abundance was calculated by DAPI stained cell counts on an inverted
epifluorescence microscope by Dr. Michael Lomas’ lab.
Samples were collected from Niskin bottles triggered at the same depths as
15
directly from each Niskin after being rinsed three times with sample water. Triplicate
tubes plus one blank were taken for each depth. Blanks were prepared by adding 100 l
of 100% tricarboxylic acid (TCA) to water samples designated as blanks, vortexed then
set aside until samples were ready to be run. Samples were incubated in the dark at in
situ temperatures. After 2-3 hours the incubation was ended by adding 100 l of 100%
TCA, and vortexing. All samples were stored in the dark in a refrigerator until extracted.
To extract, all samples were vortexed then centrifuged for 7 minutes at 2oC and
14,000 rpm in an Eppendorf 5417R centrifuge. After centrifuging, samples were
aspirated then an addition of 1.5 ml of 5% TCA consecutive centrifuging. The same
procedure was followed as prior but instead with an addition of 1.5 ml of 80% ethanol.
Samples were aspirated one last time then 1.5ml of scintillation cocktail (Ultima Gold)
was added to all samples. All samples were then vortexed and left for 12hrs, vortexed
again, and then counted in a liquid scintillation counter using 3H setting for 2 minutes.
The rate of incorporation was reported as ρmole 3H-thymidine taken up per unit time
after subtracting T0 values
2.2.7 Statistical Analyses
A one sample T-test was run to determine if collected DOC samples were significantly
lower than background values. A K-S test for normality was run and from this we
concluded the data were not normally distributed (p<0.01; K-S= 0.077). The results from
the T-test indicate that the mean DPM value of all of the samples was significantly lower
16 2.3 Results
Rates of DOC excretion as measured by 14C-additions and subsequent
size-fractionation were extremely low and were not significantly different from controls for
any station on any cruise (Figure 2.2a, b). Time series simulated in-situ experiments
showed results similar to the DOC samples collected from primary production
experiments. Dark bottles in this experiment act as a background value, or control,
because spiked 14C bicarbonate should not be incorporated for use in photosynthesis by
the incubated phytoplankton in the absence of light. Since no incorporation of labeled
bicarbonate occurs, there should be no production of labeled DOC. Any rates of
excretion seen in these bottles will act as the background rates for all other bottles.
Rates of DOC production were significantly lower than the background rates at all
time-points (0, 4, 8, 12, 16, 20, 24 hours) (Figure 2.3). There was incorporation of labeled
bicarbonate seen after 12 hrs by increasing rates of POC production. The rates of
incorporation follow the daily light cycle with a decline primary productivity after 20
hours of incubation (Figure 3).
The addition of erythromycin to incubation bottles resulted in little difference in
DOC excretion rates compared to the control and dark bottles and were below
background detection values (Figure 2.4a). Erythromycin addition did significantly,
however, suppress primary production rates, F= 14.637; p< 0.01 thus there is a
significant difference between the erythromycin addition and the non-antibiotic
17
Rates of DOC production from sloppy feeding by copepods were low and were not
significantly higher than background levels (Figure 2.5a). Integrated DOC production
(100 m) from copepod treatments were not significantly different from one another, F=
0.423; p=0.689.
Rates of bacterial production (BP) increased from inside to the outside eddy
stations on all cruises (Figure 2.6). Integrated bacterial production (to 100 m) did not
scale with bacterial abundance collected from the same water samples (Figure 2.6).
Rates of BP were similar at the BATS station between spring and summer seasons, but
the cyclonic eddy showed higher rates of BP in the center(9.2 mgCm-2d-1) and edge(10.4
mgCm-2d-1) of the eddy compared to the anti-cyclone center(2.2 mgCm-2d-1) and edge
(5.1 mgCm-2d-1). Bacterial productivity at the BATS station outside of the eddy influence
was similar during cruises AE1101 (14.5 mgCm-2d-1), and AE1118 (13.7 mgCm-2d-1)
(Figure 2.6).
2.4 Discussion
Dissolved organic compounds are almost exclusively consumed by bacteria and
are either incorporated into the microbial food web and made refractory and or
respired as CO2 (Eichinger, 2006). I predicted that excretion rates of the
picophytoplankton, namely cyanobacteria eg. Synechococcus, would exceed that of the
larger phytoplankton, because the smaller cells are more abundant in oligotrophic
ecosystems and are responsible for the majority of the primary productivity.
Observations in other ecosystems have shown that, generally, rates of DOC excretion
18
of DOC production will vary over a 24 hr period, being largest during times of high light
conditions. DOC should fluctuate on hourly to daily timescales in relation to
phytoplankton responses to light. It can also vary unpredictably due to local release
from phytoplankton enhanced by spikes in nutrients from mesoscale eddy interactions
(Mouriño-Carballido & Neuer 2008). Past experiments using natural whole seawater
incubations spiked with 14C bicarbonate showed that dissolved primary production
rates, or DOC excretion rates, were less variable than primary production and ranged
from 1.3% to 81% of gross primary production (Lagaria et al, 2013); however these
experiments were done in the Aegean Sea, which is a more productive region than the
Sargasso Sea.
Results of experiments detailed in Section 2 clearly show that fluctuations in
DOC production were not observed and that excretion of DOC by phytoplankton and by
zooplankton is a difficult (if not impossible) rate to measure in the open ocean. The
turnover rates of DOC (production by phytoplankton followed by consumption by
bacteria) could be so rapid that pools of DOC do not accumulate over short timescales
(Baxter & Sieberth, 1984; del Giorgio & Cole, 2000; Carlson et al, 2002). Another
possible reason for low DOC detection is that GF/F filters have been shown to adsorb
100 times more DOC than polycarbonate filters, even after only a brief period of contact
with 14DOC extract, which could also result in a severe over-estimation of POC
19
During my time series incubation I was unable to see any DOC production rates
above background values. This could be because my shortest time scale for measuring
DOC incorporation was 15 minutes; in 2007 Stoker’s research showed that bacteria can
take up DOC produced from phytoplankton exudate in the matter of minutes to
seconds. Stoker found that a nutrient patch could become a bacterial hotspot within
tens of seconds and have nutrient depletion to as much as 40% of the original nutrients
remaining after only 3 minutes in situations with mobile bacteria (Stoker, 2007). Rapidly
utilized DOC can be turned into either CO2 through bacterial respiration, used for
growth, or re-excreted into chemically resistant refractory DOM which usually has a
residence time of over a year (Eichinger, 2009).
Even though antibiotics such as erythromycin have been seen to significantly
inhibit protein synthesis in bacteria (Yokokawa et al, 2012), during my conducted
experiments it limited cyanobacterial production during incubations. The primary
species contributing to primary production in this system is the cyanobacteria
Synechococcus; the erythromycin instead of only affecting heterotrophic bacteria
inhibited the internal mechanisms of Synechococcus causing a decrease in PP compared
to the control. It has been shown previously that erythromycin can reduce leucine
incorporation up to 75 ± 11% (Yokokawa, 2012), which could have helped distinguish a
rate of DOC excretion by phytoplankton without the influence of bacteria. Results could
20
The role of grazers and “sloppy feeding” significantly contributing to the DOC
pool has been seen in multiple circumstances (Moller, 2005; Moller, 2007; Steinberg et
al, 2000). Copepods are linked to the microbial loop by contributing to the pool of
dissolved organic material (DOM) through excretion, leakage from fecal pellets and
“sloppy feeding” (Azam, 1983; Moller, 2001). Since only about half the carbon
requirement of the bacteria can be directly met by release of organic carbon from
phytoplankton, DOM production through zooplankton feeding may fill the gap (Baines
&Pace, 1991). Moller (2005) found that copepods were capable of grazing on organisms
>85 times smaller than they are. Even though copepods are capable of feeding on
organisms much smaller than they are, larger cells would be preferentially grazed upon.
Larger consumed cells would have a higher likelihood of producing excess DOC by
sloppy feeding. However, in this system small cyanobacteria are the dominant
producers, which if consumed by larger zooplankton would produce little to no excess
DOC from consumption. Since we did not see any creation of labile DOC, in our
experiment we have to assume that bacterial incorporation was equivalent to or
surpassed the DOC production/excretion by our experimental sources, which includes
larger phytoplankton. This caused rates of DOC production to be undetectable in our
experimental treatments.
My inability to determine rates of DOC production above background value was
seen in all experiments. This could have resulted from the 14C bicarbonate having too
low of a specific activity to be able to detect the rates of DOC production after it has
21
have occurred is that rates of bacterial incorporation of DOC were faster than we could
detect, even during time series experiments. This explanation has been seen in a
previous study conducted by Roman Stocker in 2007. He found that in nutrient poor
water, bacteria gain significant growth advantages by “exploiting ephemeral nutrient
patches” (Stocker, 2007). This means that bacteria were able to quickly take up nutrient
pulses from sources such as phytoplankton leakage, cell lysis or fecal degradation within
tens of seconds. The ephemeral patches can contain biologically labile organic
compounds at concentrations two to three orders of magnitude above ambient
seawater (Stocker, 2007). The consumption of these patchy nutrient pulses can have a
strong influence on the total carbon turnover in the system by not allowing DOM to
diffuse throughout the nearby water. In 2000, Goldberg found that that seasonally
accumulated DOC could not be metabolized by the surface bacterioplankton over short
time scales (Goldberg et al, 2000). However, he did find that the carbon being removed
during incubation was glucose, a labile compound. Labile DOM production, such as
carbohydrates and amino acids, by phytoplankton and utilization by bacteria appears to
be to be tightly coupled, thus preventing accumulation of labile DOM during stratified
conditions (Carlson et al, 2002). The lack of accumulation of labile organic compounds
and steady DOC standing stocks in the upper 40m in the northwestern Sargasso Sea
summer (Hansell & Carlson 2001) along with extremely low bioavailable carbohydrates
(Pakulski & Benner, 1994) shows that bacteria could be rapidly utilizing recently
produced labile DOC and causing rates of DOC production to be unobtainable by the
22
steady standing stock of DOC indicates the quantities in the water column have not
been produced instantaneously and have been present for a long time.
A significant source of loss of 14C during experiments is plausibly from high rates
of bacterial respiration; this loss could account for the lack of DOC excretion signal. Rate
measurements of bacterial respiration of not only 14C but also 3H have been seen to be
up to 60% of the carbon or leucine that was taken up (Suttle et al, 1991). These
respiration rates coupled with high bacterial activity and uptake rates would limit the
ability to detect DOC excretion in low biomass regions like the Sargasso Sea. An
additional discrepancy seen with the bacterial results was the lack of a trend between
bacterial productivity and abundance. The bacterial abundance counts were conducted
using DAPI stain; this stain binds the DNA of bacteria as it is taken up (Porter, 1980).
Using this to determine cell abundance makes the assumption that all bacteria are
uniformly active so that every cell is labeled exactly the same (Smith & del Giorgio,
2003). Often the dominant fraction of bacteria in an assemblage is unresponsive to
activity probes like DAPI (Sherr et al. 1999, del Giorgo & Bouvier, 2002). It has been seen
that the ranges for bacterial activity from cell hybridization in the open ocean generally
lay between 39-96% (Glockner et al. 1999, Eilers et al. 2000). This range of bacterial
activity leaves the claim that all bacteria are active and uniformly growing to be not well
supported. The lack of agreement from bacterial production and abundance results is
most likely subject to the lack of activity of all the bacteria and labeling occurring at the
23
Since excreted DOC is largely actively available for uptake by bacteria, there is a
direct link between primary and secondary production and bacterial production that is
essential for the cycling of matter through the food web (Ducklow & Carlson 1992,
Legendre & Rassoulzadegan 1996). Picophytoplankton namely Synechococcus are
typically the most abundant primary producers within the Atlantic oceanic gyres
(Partensky et al., 1999), and it is likely that bacteria in the euphotic zone of this
oligotrophic habitat are specifically adapted to incorporating exudates produced by
these cyanobacteria. Marine bacteria can form bacterial hotspots around exuded patchy
nutrient inputs such as excreted DOC (Stocker, 2007). There is growing evidence that
these picophytoplankton release DOC even under nutrient limited conditions (Bertilsson
et al., 2005) like that of the Sargasso Sea. Uptake and cycling of DOC in low nutrient
conditions has the potential to happen on short timescales, which is a possible
24
25
Cruise Date Location Cast Experiments Conducted Depths (m)
AE 1118 7/23/2011 Center 2 DOC from PP & On deck simulated in-situ (20,50,80,100) & (5,80) 7/25/2011 Center 7 DOC from PP & On deck simulated in-situ (20,50,80,100) & (5,80) 7/28/2011 Edge 14 On deck simulated in-situ (5,80)
7/31/2011 BATS 21 DOC from PP & On deck simulated in-situ (20,50,80,100) & (5,80) 8/2/2011 BATS 27 DOC from PP & On deck grazer experiment (20,50,80,100) & (5,80) AE 1206 3/15/2012 Center 2 DOC from PP (20,50,60,80)
3/16/2012 Center 6 On deck grazer experiment (45,85) 3/17/2012 Center 14 Time Series : On deck simulated in-situ (80) 3/19/2012 BATS 18 On deck grazer experiment (20,80) 3/21/2012 BATS 28 Time Series : On deck simulated in-situ (80)
AE 1219 7/20/2012 Center 6 DOC from PP (20,50,85,100) 7/20/2012 Center 7 Time Series : On deck simulated in-situ 90
7/22/2012 Center 11 Antibiotic Experiment 90 7/22/2012 Edge 14 Time Series : On deck simulated in-situ 93 7/24/2012 Edge 24 Time Series : On deck simulated in-situ 90 7/26/2012 BATS 30 14
DOC Time Series : On deck simulated in-situ 80 7/30/2012 BATS 38 14DOC Time Series : On deck simulated in-situ 80
Bacterial Production experiments were conducted at all sampling locations on every cruise.
On all cruises, the Bermuda Atlantic Time Series (BATS; 31° 40’ N, 64° 10’ W) site was used as the “outside” eddy control station. “Center” refers to the geographical center of each eddy as
measured by Sea Surface Height (SSH) anomalies. “Edge” refers to the outermost edge of each eddy determined by visual inspection of the SSH data.
26
Figure 2.2. Representative data from phytoplankton DOC excretion experiments: (A) size-fractionated DOC excretion during the AE1206 cruise at the eddy center station. Triplicate samples were taken for each size fraction, including the dark bottle. (B) Integrated DOC excretion from the eddy center station conducted on all 3 cruises.
27
Figure 2.3. Time series DOC incorporation and excretion rate measurements from the AE1206 cruise at stations in the eddy center and at BATS. Triplicate samples were taken for each time point and DOC measurements were taken from the filtrate of the POC measurements.
28
A
B
B
29
Figure 2.5. Simulated in-situ grazer-addition experiments conducted during the AE1206 cruise using water collected
from a high Chl a depth (45m) & the Chl a maximum (85m). A) Measured rates of DOC excretion from size
fractionated pre-screened incubations; measured rates were not above the background detection limits. B) Integrated rates (100 m) of DOC exertion and integrated to 100m.
30 0 2 4 6 8 10 12 14 16
Inside Edge BATS Inside Edge BATS
B ac te ri al Pr o d u ctiv ity (m g C m
-2 d -1) B ac te ri al Ab u n d an ce (c e lls * 10
7 ml -1)
(AE1102) (AE1118)
Production Abundance
31
CHAPTER 3
Inverse Modeling of DOC Flows in Mesoscale Eddy Food Webs of the Sargasso Sea
3.1 Introduction
As discussed in the prior section, it is sometimes difficult or impossible to measure
carbon flows in food webs directly. When measurements are possible, it is often the
case that only some interactions can be characterized and these only at limited locations
and times. To fill in the gaps, numerical modeling can be used as a way to characterize
the missing interactions and thus produce a complete picture of flows within an
ecosystem (Vezina & Platt, 1988; Niquil et al., 2012; Bisset, 1999). In this section I
describe my use of an inverse modeling approach to characterize DOC dynamics in
eddies of the Sargasso Sea.
Models are said to be inverse when they are used to estimate unknown
quantities from a set of known (measured) quantities in a system (Donali, 1999). Linear
inverse modeling (LIM) relies on the principle of conservation of mass at steady state,
this means that the sum of fluxes in and out of the system equals the rate of change in
their standing stocks (Niquil et al, 2012). Past modeling procedures has been to select a
single solution out of many probable ones; the most often applied of these is the
32
from the model (Vézina and Platt, 1988). The Ecopath framework is the most used in
this type of procedure. Ecopath is mostly used to investigate higher trophic levels with
the lower trophic levels simplified to largely undifferentiated compartments. Most
recently, new methods have been developed to describe the solution by calculating a
representative sample of all the possible solutions using a Monte Carlo approach (Kones
et al., 2006; Van den Meersche et al., 2009; Van Oevelen, 2010; NIquil et al., 2012).
Four steps are used to create and setup the modeling criteria, the first is to
define your knowns and unknowns. This involves determining how many compartments
your model will have, then defining what flows are coupled with another, “who eats
whom” or what enters or leaves the system. Once this is decided you can then throw
out flows that are highly unlikely or impossible, for example, microzooplankton to
phytoplankton (Niquil, et al, 2012). The second step is to set up your linear equalities, or
mass balances. In most cases the simplest model is one where the sum of the flows
entering the compartments equals the sum of the flows leaving. You will then be able to
add the data collected from in situ experiments. The third step is constraining your
model, so that flows like respiration does not exceed ingestion (Niquil et al, 2012). The
last step is to represent the results and to select one solution, in our case the mean, or
to define each unknown by the range of its possible solutions (Niquil et al, 2012).
Here, I constructed models for a cyclonic eddy (AE1118). Recognizing that eddies
are heterogeneous with respect to sub-mesoscale physical, chemical, and biological
33
different regions of the eddy: at the center, on the edge and outside the eddy. I used
the same general model structure for all stations on the cruise.
3.2 Methods:
Each food web contained 40 flows and all webs were structured identically. The
currency of each model is carbon (dissolved or particulate). The structure of the webs
was based on the hypothesis that the size of the producers and consumers was a major
determinant of the trophic dynamics of this system. Each of the 40 carbon flows used in
the model are between two compartments or from a compartment to outside the
system. Here, “outside” the system is defined as a flow to below the euphotic zone. The
living components of the food webs included two phytoplankton compartments, three
grazer compartments and one compartment for heterotrophic bacteria. We divided the
phytoplankton into two size categories, small (0.2 to 2 µm) and larger phytoplankton (2–
200 µm). All living compartments contributed to a DOC pool through excretion and
could contribute to the detrital pool (Det) through mortality or defecation. Sloppy
feeding by grazers would contribute to both Det and DOC pools. Detritus was
transformed to DOC from dissolution processes mediated by microbial activity (Jumars
et al., 1989). Flows leaving the system included respiration by all living compartments.
All non-respiratory losses from the system were represented by flows to and from the
external compartment by advection. POC could be exported through the detritus
pathway or by consumption of mesozooplankton by higher trophic levels. Grazer
34
copepods 20 – 200 m) and mesozooplankton (Mes; mainly copepods, 200 – 2000 m)
and macrozooplankton (e.g. salps, jellies > 2000 m).
Values for known flows were taken from biomass and process rate data
generated by Richardson, Neuer, and colleagues on cruise AE 1118 (July 2011) (Bachman
et al., in prep; Lomas et al., in prep.). All data can be accessed from the Biological and
Chemical Oceanography Data Management Office at the Woods Hole Oceanographic
Institution (http://bcodmo.org/). Data used for known flows includes measurements of
size-fractionated primary productivity (Bachman et al., in prep). Microzooplankton
grazing rates were taken from dilution experiments (Landry and Hassett, 1982) done by
Neuer, de Martini et al. (manuscript in prep). Mesozooplankton grazing rates were
measured by the R. Condon et al. on each cruise. Rates of bacterial production were
from experiments by M. Lomas or by me as described in Section 2 of this thesis.
The inverse method of Vezina & Platt (1988) was used to reconstruct values for
all flows in the system using code written in MATLAB 5.3. Detailed descriptions of the
method can be found in Vezina & Platt (1988), Jackson & Eldridge (1992) and Donali et
al. (1999). Table 3.1 summarizes the symbols that will be used to represent carbon pools
in the food web, while Table 3.2 gives the mass balance equations.
As described in the section above, data were used directly or were combined to
formulate six input equations or knowns: (1) small phytoplankton NPP, (2) large
plankton NPP, (3) grazing rates of the microzooplankton community, (4)
mesozooplankton grazing rates, (5) net bacterial production, and (6) detrital (POC)
35
the total flows entering any compartment are equal to the flows leaving a
compartment, with the exception of the external compartment (Richardson et al.,
2004). Combined with the 8 mass balance equations (Table 3.2), the total number of
equations available to describe the system was 14. In this model there are 7 potential
contributors to the DOC pool including small and large phytoplankton, micro-, meso-
and macrozooplankton, bacteria, and detrital dissolution. The known biomass and
carbon production values collected from experiments conducted during research cruises
are shown in Table 3.3. Because there were 34 unknowns, the problem was a
mathematically under-determined system with an infinite number of solutions.
Biological constraints on the calculated flows are presented in Table 3.5. The
Monte-Carlo based minimization scheme of van Oevelen et al. (2010) was used to find the best
solution for each food web construction.
3.3 Results:
Flows calculated for all three models are presented in Table 3.6 and graphically
in Figure 3.1 (A,B,C). The focus of these results will be on the estimated fluxes to and
from the DOC pool. Average rates of DOC excretion by the small phytoplankton were
higher than those of the large phytoplankton. (Figure 3.2). The location in respect to the
eddyaffected the DOC production of both phytoplankton size classes; we see that the
cyclonic eddy displayed increased DOC production from the small phytoplankton inside
the eddy compared to the edge, and at the BATS station (12.23, 7.86, 9.60 mmol C m-2 d
-1
) respectively. The larger size class however showed little difference depending eddy
36
locations (Figure 3.2). Eddy influence on DOC production by grazers varied between size
classes. Microzooplankton displayed increased DOC excretion at the inside and edge
stations, while outside of eddy influence at the BATS station DOC excretion was
reduced. Mesozooplankton showed an opposing trend having low DOC excretion values
inside the eddy and increasing moving outward from the center to the BATS station.
Macrozooplankton showed high DOC excretion values inside the eddy center, while at
the edge and BATS station was reduced (Figure 3.3). Detrital input to the DOC pool
increased from the Eddy center to outside the eddy; the same trend was seen from
Bacterial DOC excretion (Figure 3.4).
There were two destinations that the produced DOC could go through the
system, into the bacterial compartment as bacterial production, or out of the system as
DOC advection, which in our models is the system exit (Ext) compartment. Bacterial
incorporation of DOC increased moving from the eddy center to outside the eddy. The
calculated values for DOC to Ext were highest in the center of the eddy and were lower
at the edge and outside eddy stations (Figure 3.5).
3.4 Discussion
The size specific estimated phytoplankton DOC production rates ranged between
10.1-19.5% of integrated primary production; this falls into the 10-20% range that is
typically seen in open ocean oligotrophic environments (Cole et al. 1988; Ducklow 2000;
Kawasaki & Benner, 2006). DOC excretion was dominated by the small phytoplankton in
all sampled locations excreting over three times the amount of the larger plankton.
37
the large plankton excreted a greater percentage (10.5-19.5%) compared to that of the
smaller plankton (10.1- 12.9%).
Consumption of primary producers can lead to varying rates of DOC production
through “sloppy feeding” depending on the size of the zooplankton and the size of its
prey (Moller, 2005). Each zooplankton size class had varying contributions to total DOC
production in the three sampling locations. The macrozooplankton were the dominant
DOC producers inside the eddy center, contributing values over double that of the
smaller grazers. At the eddy edge and BATS station, the zooplankton excretion rates
were moresimilar. For the inside station the macrozooplankton DOC production could
have been higher from an increase in biomass inside the eddy influence. McGillicuddy
found that zooplankton biomass inside an eddy in the Sargasso Sea became elevated
compared to mean summertime conditions in 2004-2005 (McGillicuddy, 2007)
Mesozooplankton showed increasing DOC production moving along that same transect
having its highest DOC production rates at the BATS station.
There were a few inherent problems with the models; one of the largest was the
lack of constraints available including grazing rates and respiration rates to put on the
macrozooplankton. This was a problem because there were no collected values for rates
into or leaving the macrozooplankton compartment. This allowed excess carbon
distributed by the model to go into the macrozooplankton compartment. Another
problem was the microzooplankton grazing rates that were used as a known value to
38
microzooplankton historically have had a large range when compared to primary
production; Lessard & Murrell 1998 found the percent of primary production grazed by
microzooplankton ranged from 0 – 245%. Another study by Calbet and Landry in 2004,
found grazing rates globally ranged between 59 and 74% of primary production. Values
collected from experiments conducted during our research had a slightly larger range
(34.5 - 74.7%). Microzooplankton grazing rates have been found to be over-estimated
and unlikely to show low grazing rates from dilution experiments (Dolan & McKeon,
2005). Problems with detecting low grazing rates are that they can be difficult to detect
with regression analysis because of small n values, and detecting low grazing rates
requires distinguishing slight differences in the start and end of chlorophyll
concentrations, which could be difficult in the higher dilution treatments (Dolan &
McKeon, 2005). Another problem could be that combined effects of grazer mortality in
high dilution treatments and growth in undiluted treatments could result in
over-estimation of grazing rates which is especially common in low chlorophyll waters (Dolan
et al., 2000). Through an analysis of 185 dilution experiments Dolan found that the
average rate of microzooplankton grazing does not exceed 50% of primary production.
In some calculated values we have wide standard deviations for potential values, which
are caused by the limited constraints on those compartments. Next to the macro and
microzooplankton previously mentioned, the detritus to DOC rate has the largest error
bars. This is because those values only have one constraint, having to be at least 10% of
the sum of primary production, respiration and excretion, which causes the value to be
39
analysis for the calculated values. This occurred because the carbon inputs from primary
production were completely used by other compartments, the most significant being
the microzooplankton.
Many studies have shown that anti-cyclonic eddies exhibit increased bacterial
production and biomass in the euphotic zone compared to outside locations (Baltar,
2010; Baltar, 2009), but others have also seen up to three times the amount of bacterial
production during cyclonic eddies at the BATS site (Tarran, 2001; Ewart, 2008). In our
study, however, we found the opposite trend, with bacterial production values
suppressed within the influence of the eddy and increasing outside of it. With these
varying results in bacterial production found to occur in eddy systems, their importance
in carbon transfer in these systems is immensely important to quantify correctly.
Bacteria play a major role in determining the fate of new production (Ewart, 2008). With
increased bacterial biomass and production, high rates of organic carbon
remineralization can lead to a significant fraction of the newly produced organic matter
being regenerated in the euphotic zone minimizing the potential carbon flux of eddies
(Legendre and Le Févre, 1995). Contrary to the findings produced from my model which
showed the highest rates of DOC production outside of the eddy, a study by Lasternas in
2013 found that the production of DOC was significantly higher in anti-cyclonic eddies
compared to cyclonic eddies and an outside station despite all locations having similar
40
One of the largest flows of DOC in our model was the advection of DOC out of our
system, which can be attributed from diffusion through the nutricline, from
eddy-induced motion and turbulent mixing. Modeled DOC advection values ranged from 19.8
– 38.68 mg C m-2 d-1. This value, however large, falls into the range of DOC advection
found by Carlson et al in 1994; he found that DOC out of the upper ocean of the
Sargasso Sea near Bermuda ranged from 0.99-1.21 mol C m-2 yr-1 and when translating
this value to an average daily rate excluding seasonal influences, the range of DOC
advection is 32.58 - 39.81 mg C m-2 d-1 (Carlson et al, 1994). In continuation the
importance of the diffusive flux in removal of DOC from the surface ocean should not be
overlooked. A study by Guo et al in 1995 calculated a diffusive flux out of the upper 250
m of 1.8 – 3.6 x 10⁻⁴ mol C m-2 d-1, which converts to 2.2- 4.3 mg C m-2 d-1 from the Gulf
of Mexico and the Mid Atlantic Bight (Guo et al, 1995). However, these stations are
continental slope regions and not open ocean oligotrophic regions; the similar potential
for the same magnitude of DOC diffusion is still probable. Downward fluxes of DOC from
the upper 100 m can represent a significant fraction of the TOC flux and may play an
important role in the carbon cycle of the ocean. Lateral advective DOC fluxes, however,
could be orders of magnitude higher than POC fluxes, depending on physical influences
conditions like eddies (Guo et el, 1995).
Globally, the pool of DOM is about the same in magnitude as atmospheric CO2
(Moller 2007), and DOC is an important aspect and can make up a significant portion of
the DOM pool. As oceans become more stratified and oligotrophic, smaller
41
These cyanobacteria have vastly different cell structures and kinetics compared to large
diatoms, which have shown to be very productive in drawing CO2 out of the
atmosphere. Thus, small changes in the phytoplankton community could have strong
effects on atmospheric CO2 (Gruber & Sarmiento, 1996). With increasing CO2 in the
earth’s atmosphere coupled with lowering pH values and increased freshwater inputs,
the global oceans could become more stratified having a similar ecosystem dynamic and
composition to the Sargasso Sea (Riebesell et al., 2007). In addition to these physical
changes at the sea surface coupled with ocean circulation processes, the fixation of CO2
by phytoplankton transports carbon rich detritus to the ocean’s interior “biological
carbon pump”; this can play an important role in regulating global CO2 on longer
time-scales (Neuer et al., 2002). With large amount of eddy influence causing vertical mixing
events, DOC could be sequestered out of the surface waters creating a significant
carbon export out of the system (Carlson, 2002). With new insights on the potential for
picoplankton to attribute significantly to export flux, (Richardson et al, 2007) the
importance for understanding carbon flow in this oligotrophic region is vital.
Understanding the pathway and the rates of carbon flows through this systems
biological pump could shed light on how the carbon could move through the food web
in the future with increasing CO2 conditions.
3.5 Conclusion.
I quantified DOC excretion by plankton in the Sargasso Sea through a cyclonic
eddy using inverse modeling. DOC excretion rates by phytoplankton were between
42
were 11.7 % of total primary production. Generally, DOC excretion was higher inside
the eddy compared to the Edge and BATS station. Modeling results indicated that one of
the largest potential destinations for DOC in our system was advection out of the
euphotic zone.The highest rates of DOC advection were seen inside the eddy center,
decreasing moving to the edge and then outside of the hydrodynamic influences of the
cyclonic eddy. Direct measurement of DOC excretion by phytoplankton and zooplankton
was unobtainable from our experimental procedures most likely from instantaneous
43 Table 3.1 Symbols used in the Sargasso Sea food web.
Symbol Description
Ph1 Picophytoplankton
Ph2 nano → microphytoplankton
mic microzooplankton
mes mesozooplankton
mac macrozooplankton
res respiration
bac bacteria
doc dissolved organic carbon
det detritus
44
Table 3.2 Mass balance relationships used in inverse model analysis.
Mass Balance Equation
Ph1 (.7-2µm) gPh1_Ph1 - Ph1_res - Ph1_mic - Ph1_det - Ph1_mes - Ph1_mac - Ph1_doc
Ph2 (2-200µm) gPh2_Ph2 – Ph2_res – Ph2_det – Ph2_mes – Ph2_mac – Ph2_doc
det Ph1_det + Ph2_det + mic_det + mes_det + mac_det + bac_det – det_doc–
det_Mic – det_mes – det_mac – det_ext
doc Ph1_doc + Ph2_doc + mic_doc + mes_doc + mac_doc +bac_doc + det_doc
– doc_bac –doc_ext
bac doc_bac – bac_res – bac_mic –bac_mes – bac_det – bac_doc
mic Ph1_mic + Ph2_mic + bac_mic + det_mic – mic_res – mic_mes – mic_mac
– mic_det – mic_doc
mes Ph1_mes + Ph2_mes + bac_mes + det_mes + mic_mes – mes_res –
mes_det – mes_doc – mes_mac – mes_ext
mac Ph2_mac + mic_mac + mes _mac + det_mac – mac_res – mac_doc –
mac_det – mac_ext
45
Table 3.3 Biomass and carbon production values.
AE1118
Biomass (mg C m-2) Inside Edge BATS
ph1 370.6 508.1 670.1
ph2 82.2 121.1 108.7
mic 15.2 15.2 12.4
mes 123.9 156.2 220.2
bac 637.1 261.7 518.5
mac 19.7 19.3 32.0
AE1118
Carbon Production (mg C m-2 d-1) Inside Edge BATS
Cph1 117.3 77.6 74.1
Cph2 18.2 21.1 15.3
Cdet 24.1 31.2 20.5
Cbac 9.2 10.4 13.7
Cmic 50.0 58.0* 30.9
Cmes 3.8 5.0 6.7
Known sources of data as biological constraints for the flow of carbon through the modeled food web.
46
Table 3.4 Inverse analysis flow constraints for food web construction.
Process Bound Description Equation Reference
Respiration-Picoplankton lower At least 5% off Gross Primary Production (GPP) 5% GPP Vezina andPlatt (1988)
Respiration-Picoplankton upper No more than 30% GPP 30% GPP Vezina andPlatt (1988)
Respiration- large Phytoplankton(2-200µm)
lower At least 5% off Gross Primary Production (GPP)
5% GPP Vezina andPlatt (1988)
Respiration- large Phytoplankton(2-200µm)
upper No more than 30% GPP
30% GPP Vezina andPlatt (1988)
Respiration-microzooplankton lower At least 20% of total ingestion
0.2* (total ingestion by microzooplankton) Vezina et al. (2000), Vezina and Pace (1994)
Respiration-microzooplankton upper No more than the maximum specific respiration (d-1; a function of body size (W;pgC/cell) and temperature (T; 25C))* microzooplankton biomass (mgC/m3)
1.7W-0.25*e(0.0693*(T-20))*biomass
Moloney and Field (1989)
Respiration-mesozooplankton lower At least 20% of total ingestion
0.2* (total ingestion by mesozooplankton) Vezina et al. (2000), Vezina and Pace (1994)
Respiration-mesozooplankton upper No more than the maximum specific respiration (d-1; a function of body size (W;pgC/cell) and
temperature (T; 25C))* mesozooplankton biomass (mgC/m3)
14W-0.25*e(0.0693*(T-20))*biomass
Moloney and Field (1989)
Respiration-Bacteria lower At least 20% of total DOC uptake
0.2* (Total bacterial ingestion) Vezina et al. (2000), Vezina andPace (1994)
Respiration-Bacteria upper No more than the maximum specific respiration (d-1; a function of body size (W;pgC/cell) and
temperature (T; 25C))* bacterial biomass (mgC/m3)
14W-0.25*e(0.0693*(T-20))*biomass
Moloney andField(1989)
Excretion- Picoplankton lower No less than 10% of Net Primary Production NPP 0.1(NPP) Baines and Pace (1991)
Excretion- Picoplankton upper No more than 55% of NPP 0.55(NPP) Baines and Pace (1991)
Excretion- large Phytoplankton(2-200µm)
lower No less than 10% of NPP
0.1(NPP) Baines and Pace (1991)
Excretion- large Phytoplankton(2-200µm)
upper No more than 55% of NPP
0.55(NPP) Baines and Pace (1991)
47
microzooplankton Assimilation efficiency- microzooplankton
upper 90% of total ingestion
0.9 (total ingestion by microzooplankton)
Assimilation efficiency- mesozooplankton
lower 50% of total ingestion
0.5 (total ingestion by mesozooplankton)
Assimilation efficiency- mesozooplankton
upper 80% of total ingestion
0.8 (total ingestion by mesozooplankton)
Bacterial Production efficiency lower Respiration + excretion is 50% of total ingestion 0.5 (Respiration + excretion) Bacterial Production efficiency upper Respiration + excretion is 90% of total ingestion 0.9 (Respiration + excretion) Gross Production efficiency-
microzooplankton
lower Respiration + excretion + DOC excretion is 50% of
total ingestion 0.5 (respiration + exretion + DOC)
Gross Production efficiency- microzooplankton
upper Respiration + excretion + DOC excretion is 75% of
total ingestion 0.75 (respiration + exretion + DOC)
Gross Production efficiency- mesozooplankton
lower Respiration + excretion + DOC is 50% of total
ingestion 0.5 (respiration + exretion + DOC)
Gross Production efficiency- mesozooplankton
upper Respiration + excretion + DOC is 75% of total
ingestion 0.75 (respiration + exretion + DOC)
Detritus- system export ? ? ?
Detritus-DOC lower Primary Production + respiration +excretion is
10% of detritus to DOC .01(PP + respiration + excretion) Ingestion- mesozooplankton upper No more than the maximum specific ingestion (d-1;
a function of cell size (W;pgC/cell) and
temperature (T;25C))*mesozooplankton biomass (mgC/m3)
63W-0.25*e(0.0693*(T-20))*biomass
Moloney and Field (1989)
Ingestion- microzooplankton upper No more than the maximum specific ingestion (d-1;
a function of cell size (W;pgC/cell) and
temperature (T;25C))*microzooplankton biomass (mgC/m3)
63W-0.25*e(0.0693*(T-20))*biomass
ingestion- bacteria upper No more than the maximum specific ingestion (d-1; a function of cell size (W;pgC/cell) and
temperature (T;25C))*bacterial biomass (mgC/m3)
3.6W-0.25*e(0.0693*(T-20))*biomass
Moloney and Field(1989)
GPP = gross primary production, DOC = dissolved organic carbon. Carbon content values (pg C cell-1) were 0.00645 for