University of London
THE MODULARITY OF
PROCESSING AND PERCEPTION
IN THE VISUAL BRAIN
Andreas Martin Sebastian Bartels
Ph.D. Thesis
University College London
ProQuest Number: 10042724
All rights reserved
INFORMATION TO ALL USERS
The quality of this reproduction is dependent upon the quality of the copy submitted. In the unlikely event that the author did not send a complete manuscript and there are missing pages, these will be noted. Also, if material had to be removed,
a note will indicate the deletion.
uest.
ProQuest 10042724
Published by ProQuest LLC(2016). Copyright of the Dissertation is held by the Author. All rights reserved.
This work is protected against unauthorized copying under Title 17, United States Code. Microform Edition © ProQuest LLC.
ProQuest LLC
789 East Eisenhower Parkway P.O. Box 1346
Abstract
Practical and theoretical approaches were applied to try to unravel the relationship of the anatomical processing sites to the relative timing of processing and perception. Psychophysical, imaging and theoretical studies led to the overall conclusion that simultaneously presented attributes that are perceived at the same time are processed at the same site, and ones that are perceived at different times are processed at different sites. This is referred to as to the theory o f perceptual sites. Functional magnetic resonance imaging (fMRI) experiments charted the organisation of the human colour centre (the V4-complex), and found it to be more complex than previously believed. It has two subdivisions, V4 and V 4 a , of which V4 is retinotopically organised, while V 4a is not. The extent and organisation of the colour
Acknowledgements
First, and with utmost emphasis, I would like to express the enormous joy, privilege and honour I had to have Prof. Dr. Semir Zeki as my mentor. The little word "with" is important here: It was never working "for" or "under" him, but "with" him, from my first day here in London onwards, when I was still ignorant of the visual brain. Also, to "work" with Semir Zeki meant to philosophise, plot, invent, travel, even act and perform, to mention only a few. It was not only his outrageously unconventional character, his inventive thinking, his very instinctive and judging nose, his competitive spirit and his "digital eyes" from which I learned so much. Much more important was that I had the rare luck of having a "chemistry" that matched with his - or expressing it in Platonic terms, we shared a surprisingly similar set of ideals - a coincidence whose value can not be overestimated. I learned here that concepts matter more than facts, which is an important piece of hand baggage I will carry with me during all my life. In short, and using his own words, Semir Zeki does not only turn science into art, but also art into science.
Third, I owe much debt to my former biology mentor, Prof. Riidiger Wehner, without whose wise advice I might not have ended up here in London.
Fourth, I am grateful to all my close friends in London House, who formed my environment apart from science, and I am especially thankful to Joana Novais for herself and all her love, and especially for keeping me in touch with the rest of the world apart from neuroscience (- yes, it exists! Or is it all in the brain?). I would also like to thank Prof. Graeme Mitchison, whose brilliant mind had a most stimulating effect on mine, lasting well beyond our various excursions in nature, arts and gastronomy.
Table of contents
Abstract...2
Acknowledgements...3
Table of contents...5
List of figures... 11
List of tables... 14
List of publications...15
Part 1:
INTRODUCTION...
17Overview... 17
(A) Practical...19
1. The organisation of the colour centre of the visual brain and the extent to which activity in that area results in our capacity to see the world in colour...19
2. The influence of attention on activity in visual areas... 20
3. The chronoarchitecture of the human brain revealed by the computational isolation of functionally specialised cortical areas from fMRI data...21
(B) Theoretical... 22
1. The asynchrony of consciousness... 22
Historical survey... 24
1. The colour centre in the human visual cortex... 24
2. Perceptual loss in colour vision following damage to the fusiform gyrus...29
3. Perceptual losses following damage to other parts of the visual brain...34
3.1. Clinical evidence for a piecemeal understanding of the visual world following damage to the prestriate component of the processing system s... 34
3.2. Object agnosia...35
3.3. Prosopagnosia or the inability to recognise (familiar) faces... 38
3.4. Cerebral achromatopsia or the inability to see the world in colour... 38
3.5. Akinetopsia or motion imperception... 39
4. Temporal consequences of the modular organisation of the brain: why the brain can be dissected computationally...41
4.1. Differences in BOLD signal dynamics across cortical areas...42
4.2. ICA analysis of fMRI d a ta ...45
Part 2:
METHODS...47
1. Experiments on colour vision... 47
1.1. Mondrians... 49
1.2. Experiment 1 ...49
1.2.1. Experimental paradigm ...50
1.2.2. Ratio-taking operations...51
1.3. Experiment 2 ... 52
1.4. Experiment 3 ... 53
1.4.1. Experimental paradigm ...53
1.4.2. Re-analysis using less spatial smoothing...54
1.5. Experiment 4 ... 55
1.6. Experiment 5 ... 56
1.6.1. Experimental paradigm ... 56
1.7. Image acquisition and data analysis...57
1.8. Analysis of fMRI data by the independent components analysis (ICA)...58
1.9. Colour methods appendix A computer model of the Land Mondrian Retinex experim ent...60
1.9.1. Calculation of the colour of each patch for given projector intensities...60
1.9.2. Emulation of a particular colour on a computer graphics output device...62
1.9.3. Problems arising from the m odel... 64
1.9.4. Discrepancies between predicted and measured X Y Z ... 65
2. The computational dissection of the brain: ICA analysis of fMRI data... 66
2.1. Study 1: Objects from m otion... 66
2.1.1. Visual stim uli...67
2.2. Study 2: the James Bond 007 movie Tomorrow Never D ie s... 69
2.2.1. Visual stimulation... 69
2.3. fMRI parameters, SPM and ICA analyses... 70
2.4. Graphical display methods... 71
2.4.1. Glass brain projections...71
2.4.2. Chronoarchitectonic m aps...71
2.4.3. Correlation maps and Correlograms... 71
2.4.4. Timings for the correlograms of study 2 ...72
Part 3:
R E S U L T S ... 73
1. The architecture of the human colour centre...73
1.1. Experiment 1 - Dynamically illuminated Mondrians... 74
1.2. Experiment 2 - Dynamic illumination of a meaningful scene... 78
1.3. Experiment 3 - The retinotopic organisation of V4 but not V 4 a ...79
1.4. The co-operative activity of the two subdivisions within the fusiform gyrus: ICA analysis... 81
1.5. Experiment 4 - Segregation of V4 and V 4a with falsely and correctly coloured objects... 82
1.6. Experiment 5 - Attention to colour co-activated V4 and V 4a and modulated V4 retinotopically... 83
2. The computational dissection of the human hrain...86
2.1. Why it should not work... 86
2.2. Study 1 - Recognition of objects derived from m otion... 88
2.2.1. Task dependence: ICA and SPM... 88
2.2.2. Correlation m ap s... 91
2.2.3. Correlograms...93
2.2.4. Consistency and reproducibility across subjects... 95
2.2.5. The chronoarchitecture of the cerebral cortex... 96
2.3. Study 2 - The human brain in natural viewing conditions: Watching the James Bond 007 movie Tomorrow Never D ie s...98
2.3.1. The richer the stimulus the more individualistic are the areas... 98
2.3.2. Brains are all alike...99
2.3.3. Left and right brains are alike...99
2.3.4. The correlation between cortical areas is stimulus dependent...99
2.3.5. The brain's BOLD signal needs more than 30 seconds to recover...100
2.3.6. Eye movements and their relation to BOLD signals...100
Part 4:
D I S C U S S I O N ... 107
1. The generation of constant colours...108
1.1. The architecture of the human colour centre: the V4-complex...110
1.2. Possible homologies with macaque monkey V 4 ...112
1.3. The V4 complex as the ratio-taking site of the colour system ...117
1.4. A processing-perceptual system for colour... 118
2. The computational dissection of the brain...121
2.1. The independent components of the human brain are functionally specialised areas... 121
2.2. Identification of cortical areas: bilaterality as a reliable hallm ark... 122
2.3. The more complex the better: brain stimuli that lead to its optimal computational dissection...123
2.4. The chronoarchitecture of the human b ra in ... 124
2.5. The human brain in natural viewing conditions: Watching the James Bond 007-movie Tomorrow Never D ies...126
3. Toward a theory of visual consciousness...129
3.1. The modularity of processing and perception... 129
3.2. The parallel processing systems of the visual brain...132
3.3. The basic anatomy of the parallel processing systems... 133
3.4. Integration and binding within and between processing system s... 136
3.5. The asynchrony of consciousness... 140
3.6. Microconsciousnesses are functionally specialised...144
3.7. The processing systems are also perceptual system s... 145
3.7.1. Clinical evidence for conscious experience of an attribute not processed by V I ... 146
3.8. The autonomy of the processing systems... 149
3.9. Integration is a multistage process...151
CONCLUSIONS... 155
List of figures
INTRODUCTION
Figure 1. Spectra of light reflected from a piece of white paper which was
illuminated by different illuminants... 26
METHODS Figure 2. A typical Mondrian...49
Figure 3. The meaningful visual scene containing coloured vegetables that was displayed in conditions of a dynamically changing illumination and a static illumination... 52
Figure 4. The stimuli used in the retinotopic mapping study of the human colour centre... 53
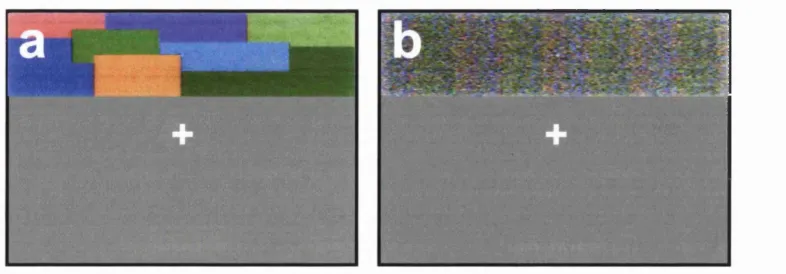
Figure 5. Examples of a meaningful scene shown in natural (a) and abnormal (b) colours... 55
Figure 6. A schematic representation of the stimuli used in the retinotopic attention mapping study of the human colour centre... 56
Figure A l. Typical reflectance spectrum of a red patch...61
Figure A2. Typical medium-wave illuminator radiant spectrum... 61
Figure A3. Typical gamma curve... 63
RESULTS
Figure 8. The cortical activity elicited when subjects viewed a dynamically
illuminated coloured scene... 74
Figure 9. Comparisons of activity obtained by passive viewing of dynamically vs. statically illuminated Mondrians that were
coloured (a,b) or achromatic (c,d)...76
Figure 10. The V4-complex was activated when subjects maintained colour constancy while viewing a dynamically illuminated meaningful
scene of vegetables... 79
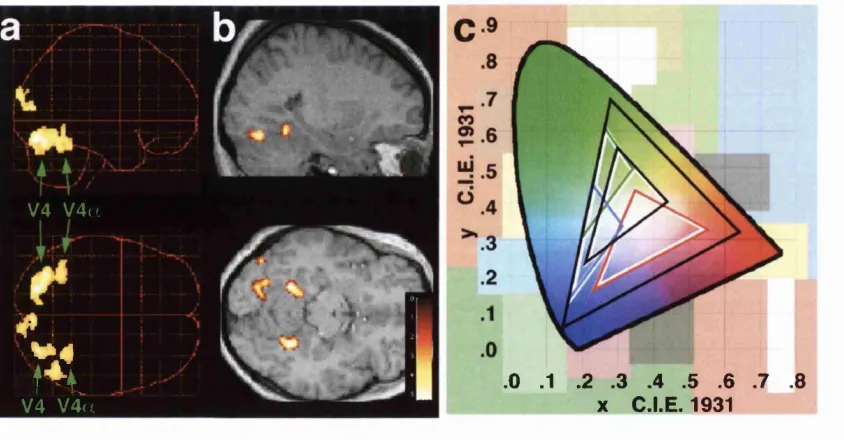
Figure 11. The segregation of the colour selective region in the fusiform gyrus (the V4-complex) into two areas, the posterior
retinotopically organised area V4 and the anterior area V 4a, as
revealed by the re-analysis of the V4 mapping stu d y ... 80
Figure 12. Functional segregation of the posterior (V4) and anterior (V4a)
areas within the V4-complex... 82
Figure 13. Selective attention to colour or to motion activated the areas
specialised for processing these attributes... 83
Figure 14. Selective attention to colour activated both subdivisions of the
V4-complex, V4 and V 4 a ...84
Figure 15. Attentional modulation of V4 was retinotopic when subjects
paid attention to quadrants in the upper and lower hemifields...85
Figure 16. Independent components (ICs) and statistical parametric maps
(SPMs) reveal the same functionally specialised areas... 88
Figure 17. Independent components (ICs) and correlation maps (CMs)...90
Figure 18. Correlogram of the time courses of the visual areas isolated by
ICA...94
Figure 19. Consistency of activity and ICA performance across subjects... 96
Figure 20. ICs, their time courses and chronoarchitectonic maps...97
Figure 21. ICs isolated from a single subject (CG) watching the 007 movie (left), and CMs calculated for the hottest voxels of each IC
(right)... 102
Figure 22. Correlograms of activity in the visual areas while the subject
(CG) is watching the 007 movie... 103
Figure 23. Consistency of activation of the same areas across different
brains... 104
Figure 24. Relation of eye movements and activity in visual areas V 1 and
V5, for all three subjects...105
Figure 25. Chronoarchitecture of the human brain during natural viewing
DISCUSSION
Figure 26. The centre is a drawing of a section taken through the lateral part of the occipital lobe of the macaque brain, at the level
shown in the top drawing...113
Figure 27. The approximate positions of the two subdivisions of the V4- complex of the macaque brain are shown on this surface
drawing...114
Figure 28. The figure shows the locations of the three areas that are
discussed in the text, in a glass-brain projection...115
Figure 29. The theory of perceptual sites is based on evidence summarised
List of tables
INTRODUCTION
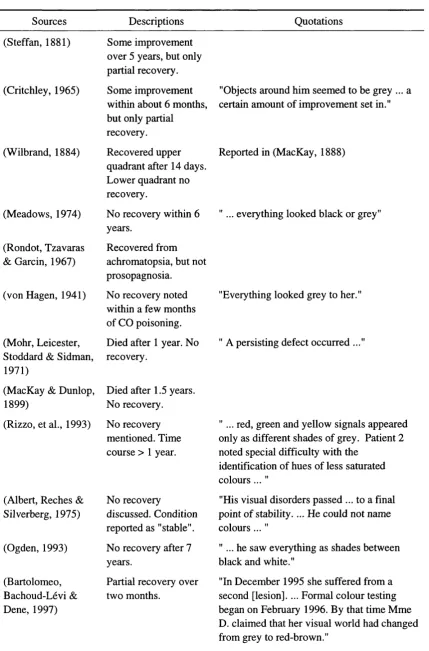
Table 1. Examples reported in the literature of patients with colour deficits
and different degrees of recovery...30
RESULTS
Table 2. Colour selective regions identified in the fusiform gyrus... 77
Table 3. Correlation coefficients (r) of six visual areas in the
object-from-motion experiment... 95
Table 4. Correlation coefficients of eleven visual areas watching a James Bond movie (subject CG), corresponding to the correlogram
List of publications
Papers:
S. Zeki and A. Bartels. The asynchrony of consciousness. Proceedings o f the Royal Society Vol. 265, p. 1583-1585, 1998.
A. Bartels and S. Zeki. The theory of multi-stage integration in the visual brain. Proceedings o f the Royal Society o f London, B, Vol. 265, p. 2327-2332, 1998.
S. Zeki and A. Bartels. The autonomy of the visual systems and the modularity of conscious vision. Philosophical Transactions o f the Royal Society o f London, B, Vol. 353, p. 1911-1914, 1998.
S. Zeki, D.J. McKeefry, A. Bartels and R.S.J. Frackowiak. Has a new color area been discovered? Nature Neuroscience, Vol. 1(5), p. 335-335, 1998.
S. Zeki and A. Bartels. The clinical and functional measurement of cortical (in-) activity in the visual brain, with special reference to the two subdivisions (V4 and V 4a) of the human colour centre. Philosophical Transactions o f the Royal Society o f London, B, Vol. 354, p. 1371-1382, 1999.
S. Zeki and A. Bartels. Toward a theory of visual consciousness. Consciousness and Cognition, Vol. 8, p. 225-259, 1999.
A. Bartels and S. Zeki. The architecture of the human colour centre: new results and a review. European Journal o f Neuroscience, Vol. 12(1), p. 172-193, 2000.
A. Bartels and S. Zeki. The neural substrate of romantic love. NeuroReport, Vol. 17(11), p. 3829-3834, 2000.
Abstracts:
A. Bartels and S. Zeki. The cortical site for the ratio-taking operations of the color system. Soc. NeuroscL Abstr. , 788.4., 1998.
S. Zeki and A. Bartels. The relationship of relative perceptual times to perceptual sites. Soc. NeuroscL Abstr. 493.10, 1998.
A. Bartels and S. Zeki. Can Independent Component Analysis (ICA) isolate cortical areas from fMRI data? Soc. NeuroscL Abstr., 766.5, 1999.
A. Bartels and S. Zeki. Are the independent components of brain imaging data functionally specialized areas? Meeting o f the Federation o f the European neuroscience Societies (FENS), 98.1, 2000.
A. Bartels and S. Zeki. Imaging the neural correlate of romantic love. Soc. NeuroscL Abstr., 403.12, 2000.
Part 1 :
Introduction
Overview
(A) Practical
Most of the practical work has been concerned with brain imaging, using the technique of functional Magnetic Resonance Imaging (fMRI), which detects areas of the brain which are especially active when humans perform given tasks. For analysis I used the statistics package developed in this department (SPM) and a more novel technique, the Independent Components Analysis (ICA), which locates independent components of brain activity in space, using maps acquired at different times. Using these techniques, I concentrated on three problems raised above, namely the one of conscious experience, the one of knowledge acquisition, and the one of modularity of the cerebral cortex:
1. The organisation of the colour centre of the visual brain and the extent to which activity in that area results in our capacity to see the world in colour.
The colour system is one of the best examples of the brain's capability of acquiring a constant knowledge from a changing environment, a capability whose significance and consequences mankind has only begun to understand (Zeki, 1999). Schopenhauer was among the first to recognise explicitly that it was the brain that extracted and held this abstract knowledge, and hence recommended the study of colour as a general example of studying the knowledge-acquiring system of the brain, "..because a more precise knowledge and firmer conviction of the wholly subjective nature of colour contributes to a more profound comprehension of the Kantian doctrine of the likewise subjective, intellectual forms of all knowledge, and so it affords a very suitable introductory course of philosophy." (Schopenhauer, 1854).
computational one, not involving memory or stored associations to properties of known objects. Because this is the site which, when damaged, leads to the syndrome of acquired colour blindness (cerebral achromatopsia), the evidence I have obtained suggests that the processing site and the perceptual site for colour are one and the same and that activity generated in V4 by viewing coloured stimuli is not reported to further hypothetical sites which might be involved in the perception of colours. Additionally, we found that the activity in the brain was identical for coloured or black and white stimuli viewed under changing illuminants, confirming that the basic ratio-taking operation involves identical processing areas. The activity was identical both for illuminants changing their wavelength composition or just changing in intensity. ICA isolated the two subdivisions within the V4-complex together from the rest of the brain, showing that their acitivity time courses are highly related.
The activity also revealed that the colour centre has a much more complicated organisation than previously believed. In particular, human V4 appeared to have two subdivisions. We attempted to show that the two parts are indeed two separate areas, both anatomically and functionally, in three steps. First, we re-analysed an earlier study of the retinotopic mapping in V4 (McKeefry & Zeki, 1997) using less spatial smoothing; this revealed not only that both hemifields are completely mapped in both V4 and in the anteriorly lying V 4a, but also that only V4 has separate maps for lower and upper hemifield, whereas V 4a does not, indicating that the latter has no retinotopic organisation. Second, we show that attention to colour also activates the two subdivisions. Third, by re-analysing data from a study on naturally and un-naturally coloured objects (Zeki & Marini, 1998) we were able to show a functional segregation between V4 and V 4a: only the latter was co-active with the even more anteriorly
located object recognition area. In the discussion, I compare the organization of the human colour cemtre with that of the macaque (Bartels & Zeki, 2000a).
2. The influence of attention on activity in visual areas.
retinotopic organisation of V4 as the retinotopic mapping during passive viewing did, revealing a retinotopy of attention in V4 (Bartels & Zeki, 2000a).
3. The chronoarchitecture of the human brain revealed by the computational isolation of functionally specialised cortical areas from fMRI data.
(B) Theoretical
Based on the published evidence and on our own experimental results, we discuss several conceptual consequences that current evidence has for our understanding of how the brain functions. These can be summarised in the three theories outlined below.
1. The asynchrony of consciousness.
Different visual areas get their input signals at different times (e.g. (Buchner, Weyen, Frackowiak, Romaya & Zeki, 1994; ffytche, Guy & Zeki, 1995) and terminate their tasks at different times (Moutoussis & Zeki, 1997b). The perception of a stimulus is a conscious event. We hypothesise that the asynchrony of percepts corresponding to different attributes of a unitary event in the outside world reflects that the very processing areas themselves generate separate conscious events asynchronously with respect to each other and with respect to the outside world. In other words, we believe that consciousness is not a unitary faculty, but that it is made up of many microconsciousnesses (Zeki & Bartels, 1998a).
2. The theory of multistage integration.
The cortical system for colour includes several stages, such as specialised groups of cells in area V I, V2 and V4 and parts of the parietal cortex. Each stage is specialised for processing the attribute at a different level of complexity. We have hypothesised that activity at each stage of a processing system can become perceptually explicit. In other words we can be aware of what happens at each stage, thus perceiving a given scene through several perceptual layers. For example, we perceive not only the correct constant colour of a surface (mediated by activity in area V4) but also whether the surface is illuminated predominantly by ‘blue’ or ‘red’ light (areas V I, V2). What happens at each stage can be integrated with activity of any other stage of the same or of another processing system, thus leading to the theory o f multistage integration in the visual brain. As a corollary, we theorise that there is no strict hierarchy in perception (Bartels & Zeki, 1998b).
3. The theory of perceptual sites.
Historical survey
1. The colour ceutre in the human visual cortex
"Tout ceci nous montre combien de questions sont encore à résoudre dans ce domain des localisations cérébrales et combien nous nous mouvons encore sur un terrain peu ferme. Cependant toute nouvelle contribution à cette étude a son importance pour l'édification de ce monument dont Charcot et ses élèves ont été les fondateurs, et c'est là ce qui m'a engagé à publier l'observation précédente"
Louis Verrey, 1888
well summarised by Holmes' statement that "...occipital lesions do not produce true dissociations of function with intact retinal sensibility" (Holmes, 1918). The evidence for a colour centre was not to be considered again until after the experimental demonstration of a specialisation for colour in the visual brain of the macaque monkey (Zeki, 1973). It was Meadows (1974) who, reviewing all the published evidence of acquired achromatopsia, found a correlation between the syndrome and the site of the lesion, located ventrally in the occipital lobe, in the territory of the lingual and fusiform gyri. A further insight, though one not remarked upon by him, is present in the title itself of Verrey's paper - "Hémiachromatopsie droite absolue".
F ig u re 1. Spectra o f light reflected from a piece o f w hite paper w hich w as illum inated by d ifferen t illu m in an ts. E ven though the w av elen g th co m p o sitio n reach in g the o b serv ers eye from this surface c h an g es co m p letely in d ifferen t illu m in an ts, the p erceiv ed co lo u r rem ain s co n stan t (w h ite). Top:
T u n g sten light from a standard light bulb. H alo g en light and can d le light are very sim ilar, the fo rm er h av in g a slightly steep er onset in the sho rt-w av e region, the latter w ith a co n cav e, alm o st e x p o n e n tia lly risin g curve. M iddle: F lu o rescen ce light in an office. T he 'w h ite' o f a c o m p u ter screen has features c o m p arab le to the sp ectru m show n, in th at it also co n sists o f both b road and sharp p eak s (e.g. an A p p le V ision 1710 screen has b road peaks at 4 4 0 and 530 nm , and sharp peaks at 620 and 7 10 nm ).
B ottom : S unlight after sunset in rainy w eath er co n d itio n s. T he light o f a blue sky has a m ore flat sp ectru m across all w av elen g th s, w hereas the light co m in g from g rey clo u d s at m idday is m o re intense in the m id d le and lo n g -w av e region than in short-w ave. T he d ips o ccu rrin g at 690, 730 and 760 nm are ty p ical fo r all d ay lig h t spectra and indicate p ro b ab ly the ab so rp tio n sp ectra o f c o m p o u n d s su ch as w ater.
Mapping experiments, using functional magnetic resonance imaging (fMRI) (McKeefry & Zeki, 1997), have shown that both quadrants of the contralateral hemi field are indeed contiguously but separately mapped within the colour centre. This, together with antecedent anatomical and physiological work, has established that the colour centre in the fusiform gyrus is one part of a cortical colour processing system that extends from the striate cortex through area V2 to V4, and beyond to the inferior temporal cortex (Zeki & Marini, 1998). Yet the resolution of this problem leaves several questions un-answered, particularly in relation to the role of each stage of this
colour processing system in the generation of colour. One way of trying to answer this question is to study the role of the individual stages of this colour processing system in the generation of the single most important property of the colour system, namely colour constancy. By this we mean an invariance in the colour category of a surface despite a continually varying wavelength composition of the light reflected from it (see Figure 1).
Studies of humans with lesions in the colour centre (Kennard, Lawden, Morland & Ruddock, 1995) and experimental evidence from monkeys with V4 lesions (Walsh, Carden, Butler & Kulikowski, 1993) show that both experience difficulty with colour constancy tasks; they are unable to "discount the illuminant" (Helmholtz, 1911). Hence for them the perceived colour of surfaces changes with changes in the wavelength composition of the illuminant and deviates towards the colour of the dominant wavelength reflected from the surface. This suggests that the colour centre is critical for the ratio-taking operations that enable the brain to compare the wavelength composition of the light reflected from one surface and that reflected from surrounding surfaces in order to assign a constant colour to a surface (Land, 1974). However it is not known whether this is a co-operative phenomenon involving all stages of the colour pathways or one that is vested in the colour centre alone. Whether this is the only function of this centre in relation to colour is itself problematic.
The variability in severity, degree and characteristics of the recovery suggests at first sight that the colour centre may have been unequally damaged in different cases of achromatopsia (Zeki, 1990a). The issue is difficult to decide on the basis of the published evidence because the colour vision of many of these patients was assessed by asking them to recognise the colours of common objects, rather than to identify the colours of abstract scenes. Unlike the latter, coloured objects activate a large part of the medial temporal lobe, extending from the fusiform gyrus anteriorly and medially (Zeki & Marini, 1998). The colour centre itself, as determined in our previous experiments, is large and extends 2 cm antero-posteriorly (Lueck, Zeki, Friston, Deiber, et al., 1989; McKeefry & Zeki, 1997); this makes it possible to suppose that it is not totally damaged in all cases of achromatopsia or that it may contain further, possibly specialised, subdivisions within it, just as in the macaque monkey (Zeki, 1977).
2. Perceptual loss in colour vision following damage to
the fusiform gyrus
The discoveries that I have made regarding the architecture of the human colour centre made it interesting to review the clinical literature concerning the visual loss following damage to the region of the fusiform gyrus where the V4 complex (the colour centre) is located).
Table 1. Examples reported in the literature of patients with colour deficits and different degrees of recovery.
Sources Descriptions Quotations
(Steffan, 1881)
(Critchley, 1965)
(Wilbrand, 1884)
(Meadows, 1974)
(Rondot, Tzavaras & Garcin, 1967)
(von Hagen, 1941)
(Mohr, Leicester, Stoddard & Sidman,
1971)
(MacKay & Dunlop, 1899)
(Rizzo, et al., 1993)
(Albert, Reches & Silverberg, 1975)
(Ogden, 1993)
(Bartolomeo, Bachoud-Lévi & Dene, 1997)
Some improvement over 5 years, but only partial recovery.
Some improvement within about 6 months, but only partial
recovery.
Recovered upper quadrant after 14 days. Lower quadrant no recovery.
No recovery within 6 years.
Recovered from achromatopsia, but not prosopagnosia.
No recovery noted within a few months of CO poisoning.
Died after 1 year. No recovery.
Died after 1.5 years. No recovery.
No recovery mentioned. Time course > 1 year.
No recovery
discussed. Condition reported as "stable".
No recovery after 7 years.
Partial recovery over two months.
"Objects around him seemed to be grey ... a certain amount of improvement set in."
Reported in (MacKay, 1888)
"... everything looked black or grey"
"Everything looked grey to her."
" A persisting defect occurred ..."
"... red, green and yellow signals appeared only as different shades of grey. Patient 2 noted special difficulty with the
identification of hues of less saturated colours ..."
"His visual disorders passed ... to a final point of stability.... He could not name colours ..."
" ... he saw everything as shades between black and white."
(Orrell, James- Galton, Stevens & Rossor, 1995)
(Fine & Parker, 1996)
(Paulson, et al., 1994)
(Mellon,
Newcombe, Polden & Ratcliff, 1980)
(Cole & Perez- Cruet, 1964)
(Bornstein & Kidron, 1959)
(Ross, 1980)
(Beyn & Knyazeva, 1962)
(Ogden, 1993)
No recovery. Died within a few months.
Recovered after five months.
No recovery in few months.
(Two cases).
No recovery after 8 years.
No recovery after 1 year.
Recovery of achromatopsia over the course of a few days leaving profound prosopagnosia and other symptoms.
Case 1 : No recovery after 2 years.
Case 2: No achromatopsia.
No recovery after 1 year, but was using compensatory techniques.
No recovery after 7 years.
"Over a period of two weeks there was some improvement in his vision, but persistence of the loss of colour vision."
"This perversion of colour recognition persisted for the best part of five months ..."
"color vision ... was profoundly disturbed" [Case 1]
"... colour vision was markedly abnormal in this quadrant" [Case 2]
"MS has been repeatedly tested over the period 1972-1978 [original illness in 1970] and his condition is stable in that his colour vision has not improved..."
"Under most conditions, however, he was unable to state the colour of objects shown to him, calling a red pen 'black' and yellow objects 'light'..."
"While in hospital no disturbance in colour sense was noted, but apparently it did exist before that time..."
"On Feb 6 1974, the patient lost the ability to read, recognize objects, and perceive
colours..." "The patient was admitted ... in November 1976."
"(2) a severe inability to recognize and name colours that could not be explained by the patient's congenital colour blindness;"
"Six months later ... he made greater use of compensatory methods, e.g. comparing the colour of a given object with that of an object such as his own fountain pen ... five months later [12 months since first
admission] there was a very slight
improvement in recognition of pictures and of facial expression."
(Whiteley & Warrington, 1977)
(Green & Lessell, 1977)
(Ishii, Kita, Nagura, Bandoh &
Yamanouchi, 1992)
(Damasio, et al., 1980)
(Brazis, Biller & Fine, 1981)
(Young & Fishman, 1980)
Case 1 : No recovery within 9 months.
Case 2: No achromatopsia.
Case 3: Mild
achromatopsia, but no time course
information given.
Case 1 : Increasing achromatopsia due to growing carcinoma.
Case 2: Carcinoma - no recovery.
Case 3: Stroke - no recovery, no time course given.
Case 4: Stroke - no recovery, no time course given.
Case 5: Stroke - no recovery, no time course given.
No recovery after 7 years
Case 1 No recovery within 3 weeks.
Case 2 No recovery within 8 weeks
No recovery in two years
No recovery after 3 years
"His symptoms remained unchanged at follow-up nine months later." [Case 1]
"was examined early ... had normal colour vision. Several months later ... he was colour-blind." [Case 1]
"Despite good visual acuity she was colour blind" [Case 2]
"... he retained good visual acuity and colour vision. Subsequently, after a second stroke ... impaired colour vision developed." [Case 3]
"... he retained good visual acuity and normal colour vision. After a second stroke ... he had become colour blind." [Case 4]
"... she did show moderate evidence of colour vision impairment..." [Case 5]
Original text in Japanese.
"the defect persisted unchanged for the 3 weeks prior to our initial exam"
[Case 1]
"Her colour perception defect was unchanged after the onset of the latter problem" [Case 2]
"Two years after the initial result he
presented to us because of the persistence of these symptoms."
3. Perceptual losses following damage to other parts of
the visual hrain
The above section revealed the tight relationship of lesions in a particular part of the brain, namely the fusiform gyrus, with a particular perceptual deficit, that of colour perception or at least the ability to construct constant colours. The question arises whether this relationship is unique to the colour system or whether it is also true for other attributes, in other words whether this is an example of the more general phenomenon of the modular organisation of the visual brain. Modular organisation in turn raises the question of the relationship between processing sites, which may be specialised for given attributes, and perceptual sites, which may or may not be the same as the processing sites. If a processing site is also a perceptual site, then we can speak of processing-perceptual sites, a formulation that has far reaching consequences for understanding how the visual brain is organised. A good indication of the independence of these processing-perceptual modules will be given by asking how specific the perceptual consequences of a lesion in a specific cortical site is or can be. An alternative way of asking the question is to enquire into the extent to which the perception of other attributes is affected when that of one is impaired.
The above considerations make it worthwhile to review some of the clinical literature on lesions in the prestriate cortex and their perceptual consequences, which is given below.
3.1. Clinical evidence for a piecemeal understanding of the visual world following damage to the prestriate component of the processing systems
processing-perceptual system should be able to experience all attributes of the visual scene, save the one processed by the compromised system; moreover, they should be able to experience something about the attribute processed by the damaged system, and that something must be related to the physiological capacities of the undamaged nodes of that processing-perceptual system, meaning the physiological capacities of area V 1 and possibly V2. Below we consider examples from different patients to illustrate these two points, by showing that the well known syndromes of achromatopsia, object agnosia, prosopagnosia and akinetopsia - all caused by specific lesions of the prestriate cortex - share a property in common. That common property is the ability to see and experience details of a given attribute without being able to combine the details into a whole and thus experience the whole. They are, in brief, able to see and understand what the intact nodes of their processing-perceptual systems allow them to see and understand.
3.2. Object agnosia
authors of this fascinating report state that the patient "has intact registration of form elements (single lines and edges), but... his ability to integrate these elements into 'perceptual wholes' is in some way impaired. The intact information about the local form elements enables him to make accurate copies of stimuli he cannot identify" (Humphreys & Riddoch, 1987)
The consequences of a large lesion are also illustrated by the famous patient of Adler (1950), who suffered from carbon monoxide poisoning at a Boston night club during the Second World War. She has also described her experiences in piecemeal terms. Shown a green battleship, she mistook it first for a fountain pen, then for a green knife before identifying as "a boat". She explained; "At first I saw the front part. It looked like a fountain pen because it was shaped like a fountain pen. Then it looked like a knife because it was so sharp, but I thought it could not be a knife because it was green. Then I saw the spokes and that it was shaped like a boat, like in a movie where I had seen boats. It had too many spokes to be a knife or a fountain pen". Another patient, "When looking at a picture... could identify individual detail but could not appreciate the significance of the entire scene" (Gomori & Hawryluk, 1984). These descriptions are so representative that they apply to many agnosic patients.
In principle, one should be able to account for some of the characteristics of the syndrome, namely a capacity to see the details but not the whole, by appealing to the physiology of the visual pathways, and in particular the capacities of the nodes that are left undamaged by the lesion. This is not an easy task, because the visual areas which are involved in the recognition of even simple objects, as well as the details of the integrative processes, are not known, especially in man. But there are clues to suggest that the residual capacity of a patient to see the details, the lines in particular, is related to the physiological capacities of areas VI and V2, partially spared by the lesion. We suppose that the orientation selective cells, a conspicuous feature of the physiology of VI and V2, are largely intact and that activity of cells at these nodes can become perceptually explicit, that is have a conscious and perceptual correlate. This, to us, is a far more satisfactory explanation than vague references to uncoupling between "seeing" and "understanding".
inclined to attribute the scotoma to a lesion of V2, which is also known to cause scotomas (Horton & Hoyt, 1991) although it may have been more extensive. One of the interesting features of this artist was his failure to see illusory contours, for example Kanizsa triangles. When shown such a triangle he described it as "a three cornered thing... I see three edges and three circles". The authors explain that the patient's "descriptions and drawings focused on the individual elements physically present, omitting, despite probing, any reference to the subjective occluding figure" (Wapner, Judd & Gardner, 1978). The patient, in brief, was not able to "fill in" perceptually the gaps in the Kanizsa triangle. This failure is similar to the agnosic patient described above, in whom the failure of integrative mechanisms was such that he commonly failed to "fill in" or complete. Physiological evidence shows that cells which are capable of responding to the illusory borders which are characteristic of the Kanizsa figures are present in VI and V2 (von der Heydt, 1987; Grosof, Shapley & Hawken, 1993). We thus conjecture that the artist is capable of seeing and understanding what the intact cells of his VI and V2 are capable of signalling. Such an explanation is as plausible, or even more so, than one which postulates a mysterious breakdown in "understanding" what was seen.
3.3. Prosopagnosia or the inability to recognise (familiar) faces
The remarkable feature of prosopagnosia is that subjects commonly know that
they are looking at a face but cannot recognise it. A somewhat frightening example is
the record of the dissolution of facial recognition, while it happened. It is the experience of a man who, while talking to his physiotherapist, suddenly exclaimed, "But Mademoiselle, what is happening is that I can no longer recognise you", although
he knew who she was and knew that he was talking to her (Lhermitte, Chain, Escourolle, Ducarne & Pillon, 1972). They do not seem to be able to combine the many individual features, which they are able to perceive, into a whole. One prosopagnosia patient related how "I can see the eyes, nose and mouth quite clearly but they just don't add up" (Pallis, 1955). The point that we emphasise here is the residual ability of such patients, their capacity to see much but not to combine everything into a whole. If we
suppose that the area in the fusiform gyrus implicated in the perception of familiar faces, and damage to which leads to prosopagnosia, is a distinct node, then the clear implication of the above is that the patient is able to experience what the antecedent nodes have processed, namely the details of the face (although no one knows where these details are processed). More simply stated, the capacity of the patient is related to the physiological capacities of the intact parts of the processing system.
3.4. Cerebral achromatopsia or the inability to see the world in colour
This somewhat complex syndrome, discussed above, provides even more compelling grounds for supposing that the processing and perceptual systems are one and the same. The syndrome is one in which patients either cannot see colours at all, describing the world in shades of 'dirty' grey or one in which they can see some colours, more often reds, but not others, more commonly greens and blues (Zeki, 1990a), a
condition which we refer to as dyschromatopsia. In the latter condition, a patient's
ability to "discount the illuminant " (Helmholtz) is much impaired, with the consequence that they are not able to construct constant colours and hence cannot see colours in a
stable way, like normals (Kennard, et al., 1995). But V4 is only one node in an extensive colour processing-perceptual system that extends from VI to the inferior temporal cortex (Zeki & Marini, 1998). Damage to the V4 complex may, and often
does, leave the antecedent parts intact. The consequence is interesting and can be related directly to the physiological capacities of the nodes that are left intact by the
lesion. It has been found, for example, that achromatopsic patients are able to
discriminate remarkably well, and consciously, between lights of different wavelengths, even if they are not able to ascribe colours to them (Victor, et al., 1989; Vaina, 1994). Like humans, monkeys with V4 lesions can also discriminate between light of different
we believe, reflects the physiological capacities of the wavelength selective cells in V 1 and probably V2, which respond when light of the appropriate wavelength is flashed into their receptive fields, without being concerned with the colour of the stimulus in their fields (Zeki, 1983b).
An interesting insight is provided by an achromatopsic patient who had retained the ability to detect the border between two equiluminant colours, without being able to distinguish the colours on either side of the border (Heywood, Cowey & Newcombe, 1991). The authors of this study seek a complicated explanation for this residual capacity, by supposing that there are two specialised prestriate areas, one specialised for the conscious perception of colour and the other for extracting contours from colour. But a simpler explanation might lie in the physiology of orientation cells in V I. These cells, though responsive to lines of particular orientation, will respond to a border between two equiluminant stimuli of the same orientation, without caring much about the colour on either side of the border (Gouras & Kruger, 1979; Thorell, De Valois & Albrecht, 1984). This is precisely what the patient could discriminate, without being able at the same time to detect the difference between the two stimuli, just like a VI interblob cell. VI constitutes a node of the colour processing system and, in the absence of V4, there is at present no good reason to suppose that the activity of such cells in it does not have a perceptually explicit correlate. And it is interesting to note in this context that cells such as the one described above, located in the interblobs of V I, project to V4, either directly or through the thin stripes of V2 (Livingstone & Hubei, 1984b; Zeki & Shipp, 1989; Nakamura, Gattass, Desimone & Ungerleider, 1993). In brief, the knowledge of these achromatopsic patients reflects such physiological capacities as the wavelength selective cells of VI and V2 have.
3.5. Akinetopsia or motion imperception
(Shipp, de Jong, Zihl, Frackowiak & Zeki, 1994), have shown that the patient is able to detect certain kinds of simple, slow, motion, leading the authors to say "Thus, the overall results suggest that the local component information necessary for the derivation of motion is intact and thus that the anomaly occurs at a later stage, where a more global analysis takes place" (Hess, Baker & Zihl, 1989). We take this to be a reflection of the capacity of the direction plus orientation selective cells of her intact area V I, and possibly those in areas V2 and V3 as well.
Because VI is not directly connected to the frontal lobes, it has been suggested that we are not aware of what happens in V I, thus excluding VI from direct involvement in conscious experience (Crick & Koch, 1995). This may well turn out to be so, and we have no compelling evidence that it is not. On the other hand, the evidence reviewed above could be interpreted to imply that activity in V 1 itself has a direct conscious correlate. This is emphasised further by recent experiments in which a patient blinded as a consequence of a severe heart attack nevertheless retained the ability to see colours (Humphrey, Goodale, Corbetta & Aglioti, 1995). But our further examination of him revealed that his colour vision, (which is completely divorced from form vision in that he is not able to perceive the form of the colours which he describes correctly) is wavelength based. In other words, he is not able to construct constant colours. Imaging experiments show that, when he discriminates colours according to wavelength, the activity in his brain is located in area V 1 (Zeki, Aglioti, McKeefry & Berlucchi, 1999). Even in spite of this, we are diffident about saying that activity in VI has a conscious correlate, because we have no means of knowing what residual, and undetected, activity may have occurred elsewhere.
4. Temporal consequences of the modular organisation
of the hrain: why the hrain can he dissected
computationally
If the visual areas of the brain are indeed to some degree autonomous, and the results of my studies on the colour centre, together with a review of the published literature, show them to be so, then one might expect this autonomy to be reflected in activity time courses that differ from area to area, with no area having the same activity time course as any other. I therefore decided to use the technique of independent components analysis to fMRI data, first to show that this is true for the human colour centre and then for other visual and non-visual areas as well, leading me to collect additional fMRI data and to introduce the concept of chronoarchitecture.
In fact, the motivation for applying the information theory based ICA to brain activation data stems from a fundamental property of the cerebral cortex: the principle of functional specialisation (Zeki, 1993b). This states that separate cortical areas have different physiological and anatomical and therefore different processing properties, and that they are involved differently in different tasks. Different areas are therefore stimulated independently to varying degrees and are therefore active with varying degrees of independence. A classic example from the visual cortex is that stimulation with colour or motion selectively activates areas V4 or V5, respectively (Zeki, et al., 1991). It is therefore plausible to believe that functionally specialised areas can be identified and segregated using clever computational tools (such as ICA) alone, without a priori knowledge. By analysing whole-brain activity without knowing the type of specialisation, localisation or spatial extent of the areas or anything about the type or time course of the stimulation applied, a computational tool should be able to dissect the brain into its functional components.
that differs anatomically from others must have a unique function, and, vice versa, any functionally specialised area must differ in at least one anatomical property from all the others. For example, by staining brain slices for myelin, it has been shown that area V5 has higher contents of myelin than others (Clarke & Miklossy, 1990; Tootell & Taylor,
1995). Myelin allows for a higher conductance speed of the axons: a short signal arrival time and fast processing are functional properties of V5, derived from anatomical ones.
In the next section some additional physiological properties are described that have been shown to differ from area to area, and which contribute to differences of the BOLD signals associated with these areas. These properties facilitate their segregation, based purely on the activity time course detected by fMRI.
4.1. Differences in BOLD signal dynamics across cortical areas
Any method trying to segregate different cortical or sub cortical areas from each other using fMRI data has to rely on differences in their BOLD response. Parametric methods such as SPM are designed to exploit such differences when the experimenter can predict these in advance: e.g. by hypothesising that a motion stimulus activates a given area more than a colour stimulus. SPM is therefore limited to identifying brain regions whose response have been predicted in one way or another. In contrast, non- parametric, explorative methods such as ICA can exploit both known and unknown differences in the BOLD response of different regions in the brain. This promises to lead to the discovery of unknown subdivisions of already known areas, of areas that have not been described before, or to the identification of interesting particularities of the BOLD response properties of known areas. In this section, some of the factors that can lead to differences in the BOLD signal in different areas are described. Even though some of these factors are known, they are not known precisely enough to be formulated in terms of clear hypotheses that could be used by SPM. At the same time, these factors almost certainly contributed in this study to the successful segregation of various brain regions by ICA.
The following factors contribute to and cause differences in the activity time courses measured as BOLD signal across different cortical or sub-cortical areas:
whose BOLD response differs merely because of their particular and unique stimulus preferences.
Second, even though the hemodynamic response function that underlies the BOLD signal appears to be quite similar in different cortical regions, it has been reported that cortical regions differ in the latency of their BOLD response to a given stimulus, but a differential BOLD signal latency across different regions is a disputed and unresolved issue (Guy, ffytche, Brovelli & Chumillas, 1999). This works to the advantage of data-driven brain analyses, but will have to be taken into account for statistical mapping, which commonly assumes a constant and identical response delay for all cortical regions.
Third, stimulated by their preferred stimulus, areas differ in the dynamics of their response. For example, cells in VI display less spike frequency adaptation than cells in V4, and subdivisions of ORA display differences in their adaptation to repeated stimuli, which led to the discovery of its subdivision (Grill Spector, Kushnir, Edelman, Avidan, et al., 1999). Thus, when a constant stimulus is presented which activates two cortical areas, the two areas can be segregated because they differ in their response to the stimulus over time (e.g. one remains active while the other slowly returns to baseline activity). Similarly, a linear change in stimulation, e.g. word presentation rate, has been shown to elicit different non-linear response changes in BOLD data that differ across cortical areas (Buchel, Holmes, Rees & Friston, 1998), thus allowing a segregation of the areas involved.
Fourth, a segregation of an area from those providing input to it can be facilitated by the fact that many areas can be activated through more than one pathway. An example is the object area ORA: It can be activated via the colour-pathway involving areas V1A^2A^4 by presenting objects derived from isoluminant colours, or it can rely entirely on the motion pathway involving areas V1/V2/V3/V5 when objects are derived from motion as in study 1 (Grill Spector, Kushnir, Edelman, Itzchak & Malach,
1998).
Howseman, Edwards, Sandeman & Zeki, 2000). Such differences can help to segregate areas that may otherwise be co-active and therefore indistinguishable.
Sixth, interactions between brain areas provide additional means of segregating them: When area A is co-active with areas B and C, but selectively increases its activity when both area B and C are active simultaneously, A can be segregated from the other areas.
Seventh, different areas and even functional subdivisions within areas differ substantially in their vascularisation density (Zheng, LaMantia & Purves, 1991). This constitutes an anatomical difference directly affecting the BOLD signal.
4.2. ICA analysis of fMRI data
The non-parametric, explorative fMRI time series analysis is clearly still in its early days and will probably see an exciting future. In this study we concentrated on the application of a method rather than on evaluating or developing new ones. Other groups have examined in great detail the merits and pitfalls of a variety of explorative analytic techniques, including ICA (Friston, 1998; McKeown, Jung, Makeig, Brown, et al., 1998a; McKeown & Sejnowski, 1998).(McKeown et a l, 1998a) and several other techniques, such as PCA (Friston, Frith, Liddle & Frackowiak, 1993; McKeown, Makeig, Brown, Jung, et al., 1998b) and non-linear PCA (Friston, Phillips, Chawla & Buchel, 2000), ICA combined with SPM (McKeown, 2000), clustering techniques (Baumgartner, Ryner, Richter, Summers, et al., 2000a; Baumgartner, Somorjai, Summers, Richter, et al., 2000b) and derivatives of ICA (Nakada, Suzuki, Fujii, Matsuzawa & Kwee, 2000). However, none of these groups have attempted analysis of nearly as substantial data sets as was done here, in which the whole brain is represented, most of the areas in which were highly and differentially activated. It is probable that a very rich and complex data set as the one employed here will not only reveal more details about the strengths and weaknesses of these methods, but it might also lead to a change in their ranking in obtaining useful results.
Brown, Jung, et al., 1997; Friston, 1998; McKeown, et al., 1998a; McKeown, et al., 1998b). The key weakness of PCA stems from its constraint to isolate components that are orthogonal to each other, such that most variance in the data are accounted for by the first component, while the last component accounts for virtually no variance in the data. This stands in contrast to the brain's organisation, in which each brain area contributes similarly to the overall activity; any algorithm trying to segregate the brain's areas should therefore allow each component to explain a similar amount of the total variance, which ICA does. ICA constrains its components to be as independent as possible (in one of the two dimensions), which does not mean they need to be orthogonal. We applied ICA for the first time to fMRI data with both a high temporal and a high spatial resolution, and discovered that in this case ICA not only isolates voxels that are involved in different tasks, but that it isolates functionally specialised areas (Bartels & Zeki, 1999; Zeki & Bartels, 1999a; Bartels & Zeki, 2000b; Bartels & Zeki, 2000a).
Part 2:
Methods
1. Experiments on colour
vision
In total the following five separate experiments were performed, in which twenty seven subjects with normal colour vision took part.
Experiment (1): Six subjects viewed statically and dynamically illuminated versions of coloured and achromatic Mondrians.
Experiment (2): Three subjects viewed statically and dynamically illuminated versions of a naturally coloured scene consisting of fruits and vegetables.
Experiment (3): In the light of the results obtained from (1) and (2), which revealed a subdivision of the human colour centre, we re-analysed the data of four subjects originally collected by McKeefry & Zeki (1997), using less spatial smoothing to obtain a higher spatial resolution. In that experiment, which was essentially a study of the retinotopic organisation of V4, which has been recently confirmed (Hadjikhani, Liu, Dale, Cavanagh & Tootell, 1998; Tootell & Hadjikhani, 1998; Zeki, McKeefry, Bartels & Frackowiak, 1998), the subjects had viewed a coloured Mondrian and its achromatic counterpart presented separately in the upper and lower halves of their visual fields.
Experiment (4): The results obtained from (1) - (3) also led us to re-examine data collected by Zeki & Marini, (1998) in which nine subjects had viewed correctly and incorrectly coloured natural scenes and their achromatic counterparts.
Experiment (5): We investigated how the human colour centre is affected by attention to colour and to different quadrants of the visual field, in an experiment in which five subjects paid attention to either colour or motion in each one of the four quadrants of the visual field separately.
1.1. Mondrians
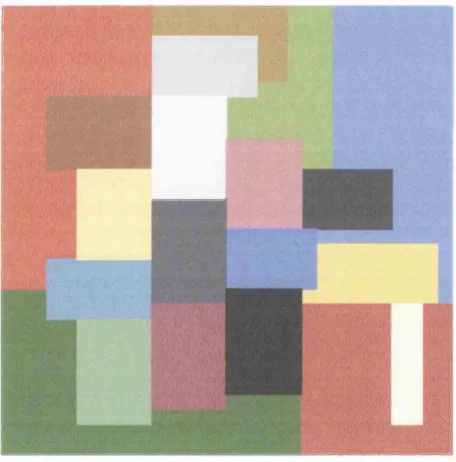
Experiments (1) and (3) relied on multicoloured or achromatic abstract scenes with no recognisable objects, used extensively by Edwin Land in his psychophysical experiments (see Land, 1974; 1986), and by previous imaging studies from this laboratory, as the one shown in figure 2 (Lueck, et al., 1989; Zeki, et al., 1991; McKeefry & Zeki, 1997). They bear a certain resemblance to the paintings of Piet Mondrian and are hence known as the Land colour Mondrians or Mondrians in brief. By achromatic counterpart we mean the black, white and grey versions of the coloured stimuli. We do not imply that black, white and grey are not colours. They are regarded as colours by scientists such as Bering (1877) and Land (1974), as well as by artists, e.g. Matisse, (1972).
F igu re 2. A typical M ondrian.
1.2. Experiment 1
In this study, six subjects viewed statically and dynamically illuminated coloured and achromatic Mondrians, while fixating the centre of the Mondrian. Here we tried to simulate experimentally what would happen when a scene is viewed in lights of continuously changing illuminants, so that the wavelength composition of the light coming from every patch changes (see the Colour Methods Appendix for a detailed description of the illumination simulation methods). Prior to scanning, we
asked subjects to report the colours of nominated patches of a Mondrian while the wavelength composition changed (see below), thus allowing us to ascertain that changes in the wavelength composition did not lead to changes in the perceived colour of any patch in any of our subjects. Colour constancy was thus achieved in the face of a continually changing wavelength composition.
1.2.1. Experimental paradigm
The patches of the achromatic version were made isoluminant to their coloured counterparts as follows: using the radiant spectra of the illuminant and the reflectance spectra of each patch, the reflected light from each was calculated and the intensity re calculated from this as a CIE 1931 Y value. This was then matched to an equiluminant grey.
the light reflected from the screen was measured and its transmittance was determined. The actual luminance values were so derived for a few representative conditions and the remaining ones calculated by our simulation software (see Colour Methods Appendix), using the measured values as calibration points. All measurements were performed using a Photoresearch PR650 Spectra Colorimeter.
Conditions were repeated six times within blocks which consisted of different random permutations of the six conditions; each condition lasted 32.8 s, thus allowing 8 whole brain acquisitions to be made.
1.2.2. Ratio-taking operations
1.3. Experiment 2
Previous studies have shown that areas in the fusiform gyrus beyond the V4- complex are involved when colours are viewed as parts of recognisable objects (Zeki & Marini, 1998). We therefore designed an experiment to test whether these further areas are involved in the ratio taking operations when natural scenes are involved or whether the ratio-taking is done at a unique site, regardless of the nature of the stimulus. Three subjects viewed a complex natural scene of coloured vegetables, as is shown in figure 3. The stimuli were divided into two types. In one, the wavelength composition of the illuminant changed continuously (as described for the Mondrian above) while in the other it remained constant. The stimuli were presented 18 times altematingly and lasted 32.8 s each. The measurement and analysis techniques were as given for experiment (1).
1.4. Experiment 3
Experiments (1) and (2) revealed two subdivisions of the colour centre in the fusiform gyrus. To learn whether the two subdivisions have different retinotopic organisations - which would be an indicator that they actually are separate cortical maps - we re-analysed the data from four randomly chosen subjects collected by McKeefry and Zeki (1997).
1.4.1. Experimental paradigm
In this study, subjects viewed a grey screen that contained a Mondrian stimulus confined to either the upper or the lower third of the screen, while they fixated a central cross. The Mondrian alternated at 1 Hz with a homogenous surface that had the same mean luminance and mean hue as the Mondrian (see figure 4). The Mondrian was either coloured or achromatic, thus leading to four stimulus conditions: (A) Upper field coloured, (B) lower field coloured, (C) upper field achromatic and (D) lower field achromatic. For the colour conditions, the eight patches of the Mondrian were set to isoluminance with the gray background for each subject separately, using the heterochromatic flicker method (Kaiser, 1991). The mean luminance of the coloured Mondrian was equal to the mean luminance of the achromatic version, which contained gray patches that differed in luminance. Each of the four conditions was presented in blocks lasting 30.4 s (5 TRs) and was repeated 16 times in a pseudo-random sequence. The whole scanning session lasted 32 min 27s.
-ÿ.-V
t-F ig u r e 4. T he stim uli used in the retin o to p ic m ap p in g stu d y o f the h u m an c o lo u r centre. T he tw o stim uli (a and b) altern ated at 1 H z in the upper fie ld coloured condition w h ile the su b ject fixated the central cross. L o w er field stim u latio n used the sam e stim u lu s, but rotated by 180 degrees. F o r the ach ro m atic co n d itio n s, the M on d rian in (a) co n sisted o f g ray patches o f d iffe re n t lu m in an ce and the screen in (b) w as ho m o g en eo u sly gray. T he stim u latio n w as co n fin ed to the u p p er or the lo w er third o f the screen.
By comparing the colour with achromatic conditions, the human colour centre as a whole would be revealed (see figure 11a). By making the contrast of e.g. (A-C) - (B-D), the colour selective cortical region representing upper field only should become apparent, assuming a topographic map within V4 (see figure lib ).
1.4.2. Re-analysis using less spatial smoothing