Mathematical Models for the Seismic Analysis of Civil Structures
Carlos L. M. Prates, Ricardo C. Albano, Glauco J. T. Mello Jr. Eletrobr~is Termonuclear S / A - Eletronuclear
ABSTRACT
The floor response spectra of the civil structures are usually obtained to be employed as the dynamic seismic loading to the safety related components of the nuclear power plants (NPP). The most simple mathematical models of the buildings are those where each level is represented by a beam and the extreme points are connected to the centre of rigidity by rigid beams. Even if these beam models have been frequently employed, there are some cases where a complete 3D-plate model is required.
This paper presents a comparison of the results of a time history modal analysis for both models for different foundation conditions (Hard rock and Soft soil with pile foundation). The results are analysed in order to point out where the beam models provide conservative results and where correction measures should be considered.
I N T R O D U C T I O N
The structural behaviour is represemed mathematically by a set of equations (algebraic, differential or integral equations). The solution of this set of equations provides the displacement, velocity and acceleration of any point of the structure.
The choice of the kind of mathematical model for a certain structure is based on the fact that the required results must be obtained with an approximation considered admissible from the engineering point of view. The easiness of the preparation of the model and the interpretation of the results obtained has also to be taken into account.
In the specific case of seismic analysis there are two main purposes for which the structural response is to be used: civil design of buildings (superstructure analysis) and design of the secondary structures.
For the superstructure analysis, the beam model can always be used when the plane section assumption is verified. This hypothesis, for buildings of a nuclear power plant, is reasonable when the superstructure is relatively stiff in comparison to the foundation stiffness. In general, if the floors can be considered as rigid (in and out of plane), the plane section assumption can be guaranteed. This simple model can provide displacements, accelerations and forces for the design of the structure. The refined finite element model with plates and other elements is an alternative model, which can be used if the set structure-foundation does not fulfil the necessary requirements to represent the structure with a beam model. The structural behaviour and the results can be easier interpreted in case of use of more simple models.
The local analysis of the floor slabs, steel structures, components and piping require the use of the floor response spectra. For these calculations, if the assumption of rigid floor can be adopted, the beam model provides acceptable results. Normally, a structure is modelled using a refined finite element mesh with the aim of reproducing the stiffness properties of the structure. The more detailed finite element model permits to reproduce also localised vibration modes, which can not be obtained, using the beam model.
The floor response spectra at a certain nodal point of the structure depend not only on the time history maximum acceleration, but also on the frequency content of the secondary acceleration time history.
The analysis presented here is based on a class I Switchgear building of a NPP as described in the next section. The same mathematical models of the superstructure (3-D beam and 3-D plate finite elements) are used for two considered foundations - hard rock and soft layered soil with pile foundation. Only the foundation stiffness and associated damping values are changed.
So, four different floor response spectra are computed for each direction (X1 and X2 for horizontal and X3 for vertical) and for a representative floor in the building. These spectra are compared and the differences are analysed. Some conclusions can be taken from these results.
ANALYSIS P R O C E D U R E
Description of the Structure
The structure is rectangular in plan constructed of reinforced concrete and the foundation is modelled considering two conditions, hard rock or soft layered soil with pile foundation. The structural dimensions are about 75 m x 25 m in plan and 30 m height. The foundation slab has dimensions of 84 m x 34 m in plan. The top of the
SMiRT 16, Washington DC, August 2001 Paper # 1267
1.0 m thick foundation mat is at elevation -0.15 m and the structure contains 9 main stories up to the roof elevation + 29.85 m. Below elevation + 6.15 m the exterior walls are 0.50 m thick and above this elevation the exterior walls are 0.25 m and 0.35 m thick. Floor slabs are generally 0.25 m thick. The structure is roughly symmetrical about the transverse axis. The total mass of the building is about 484000 kN including dead weight and all other dead loads.
The material properties used for the concrete of the structure are the Young modulus (E = 30000 MPa), mass density (p = 2.50 kg/m 3 ), damping ratio ( D = 7 %) and Poisson ratio (v = 0.2).
Input Excitation
Three statistically independent time histories applied on the ground surface (base of the superstructure) are generated for each global direction from the 7% damping site specific earthquake design response spectrum presented in the Table 1, scaled for the maximum ground acceleration 0.1 g and 0.067g (g = 9.81 m/s2), respectively, for horizontal and vertical directions. The developed time histories have duration of 15 seconds with
1.5 seconds of rise time, 10.0 seconds of strong motion and 3.5 seconds of decay time digitised at 0.01 seconds.
Table 1. Numerical Values of the Design Response Spectra
Damping
Ratio (%) 0.33 2.00 20.00
Frequency (Hz)
8.50 I 12.50
0.230 0.135
33.00
7.0 0.039 0.230 0.107 0.100
Method of Analysis
The dynamic analyses of the structure on subgrade springs are performed using the time history modal superposition technique. The excitation is applied simultaneously on the three directions.
Two 3-D finite element models are considered in the analysis:
- A more detailed model with plate and beam elements and springs- Model 1;
- A simplified model with beam and spring elements- Model 2.
The eigenvalues extraction of the models, using Lanczos method with frequencies up to 60 Hz, and the computation of secondary time histories at the chosen nodal points are performed. The integration time interval used in the analyses is 0.005 seconds.
Composite modal damping are computed using standard energy principles. They are determined from the element damping ratios of the structure and rock foundation by an averaging procedure taking as weight the strain energy stored in the corresponding element.
In Model 1, as the damping value for the hard rock foundation in the vertical direction is high and due to the fact that the rocking modes of the building also work on the vertical springs, a conservative procedure is adopted of considering high composite modal damping just for the modes which are clearly vertical ones. For Model 1 on soft soil with pile foundation this procedure is not required because the same damping value is associated with both vertical and rocking springs. Model 2 does not require this kind of consideration.
From the secondary individual time histories, response spectra are generated in each direction. These spectra are computed for 4 % damping. The enveloped floor response spectra are broadened using the procedure from [2].
MATHEMATICAL MODEL
The Model 1 is generated representing the walls and floors by plate elements and the columns and horizontal beams, which support the slabs by beam elements. All plate elements resist in plane, transverse and bending forces and their extreme nodes have 5 degrees of freedom, 3 translations and 2 rotations which act on the element thickness. Beam elements have nodal points with 6 degrees of freedom. Dead and equipment weight, covering and openings are properly accounted. Fig. 1 shows a global view of the Model 1 used in the analysis together with the chosen points.
The subgrade stiffness and damping values are connected to the nodes at level - 0.70 m. They are presented in the next section and a rigid base is assumed for the distribution of the total subgrade stiffness over the nodes of the foundation slab.
XI)
X2
. /
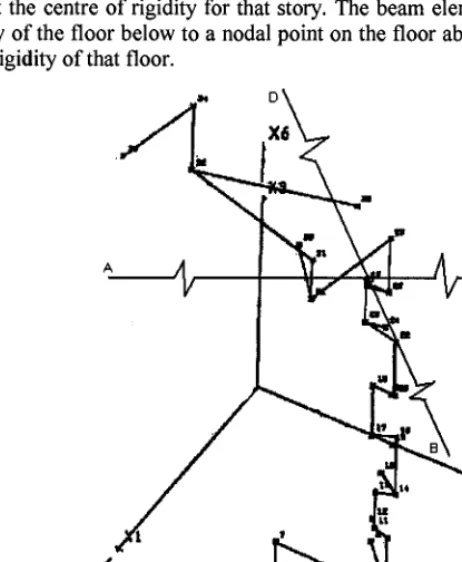
Fig. 1. Global View of the Model 1 and Chosen Points for Spectra
X1
Fig. 2 shows a global view of the Model 2. This is a 3-D model and includes rotational effects at each floor level, through the eccentricity between the centres of rigidity and mass. The assumption of the floor diaphragms is utilised by connecting the centres of mass and rigidity through the rigid links at each floor level. The masses for each floor are lumped at the centre of mass and the stiffness properties for the element linking each floor are given about the centre of rigidity for that story. The beam element for each story passes vertically from the centres of rigidity of the floor below to a nodal point on the floor above, which is in turn connected by a rigid link to the centre of rigidity of that floor.
13
X6
A A I I f J ' ~ . . [ !~ 0
x¢"
Soil Subgrade Stiffness and Damping Values
The structure is founded on a soil modelled by means of frequency dependent springs and damping ratios defined for each degree of freedom presented in the Table 2, using as a first approximation the ones obtained from the half space theory [3] corrected by the factors taken from [4], [5] and [6].
The discrepancies between the K and C values for both models for the hard rock condition are due to the different frequencies obtained for these models which are used to calculate the frequency dependent values.
The composite modal damping are limited to 15 % for horizontal and rocking modes and 30 % for vertical modes according to [ 1 ].
Table 2. Frequency Dependent Stiffness Coefficients (K) and Damping Ratios (C)
Model 1- Hard Rock Model 2- Hard Rock
Degree of K C K C
Freedom (kN/m) (%) (kN/m) (%)
X1 1.2x10⁹ 16. 1.2x10⁹ 22.
X2 1.4x10 r 12. 1.4x10 r 17.
X3 1.4xl0 r 51. 1.3xl0 r 74.
R4 4.3x10 II 1.0 4.3x10 ~ 1.1
R5 1.8xl 0 lz 1.8 1.6xl 0 lz 7.3
R6 1.7xl 0 lz 1.0 1.6xl 0 lz 2.0
Models 1/2- Soft Soil K
(kN/m)
7.7x10⁶ 7.9x 10⁶ 3.0x10⁸ 2.9x10 ~° 2.0x10 ~l 6.0x10 ~z
C
(%)
10. 10. 7. 7.
. 10.
F L O O R DESIGN R E S P O N S E S P E C T R A
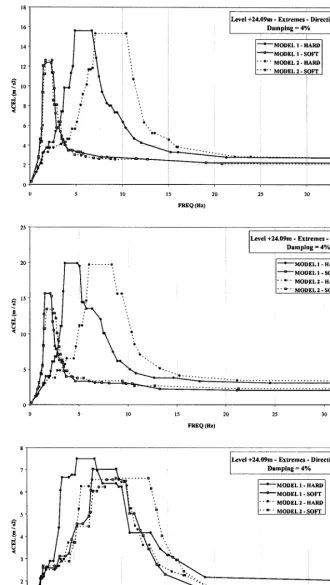
In order to generate the floor design response spectra for the models 1 and 2, considering the hard rock and soft soil conditions, the enveloped floor response spectra are broadened by + 15 % of the frequencies according to [2]. These floor design response spectra are presented for the X1, X2 and X3 global directions. The floor design response spectra for the mentioned earthquake excitation are calculated for a representative level of the building +24.09 m (see Fig. 1 and Fig. 2), taking into account three cases, as follows:
- Enveloping only four extremes points of the floor (A up to D - Fig. 3);
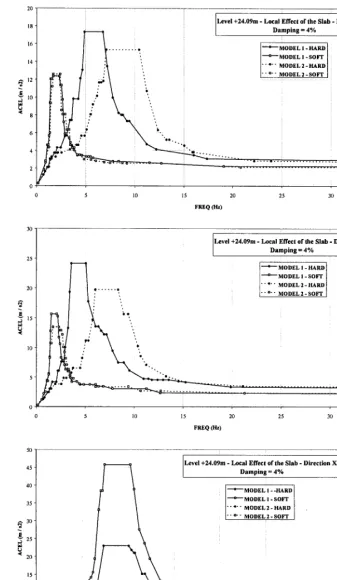
- Adding internal points of the floor to the enveloped floor response spectra (for the Model 1) to show the local effects of the s l a b s - Fig. 4;
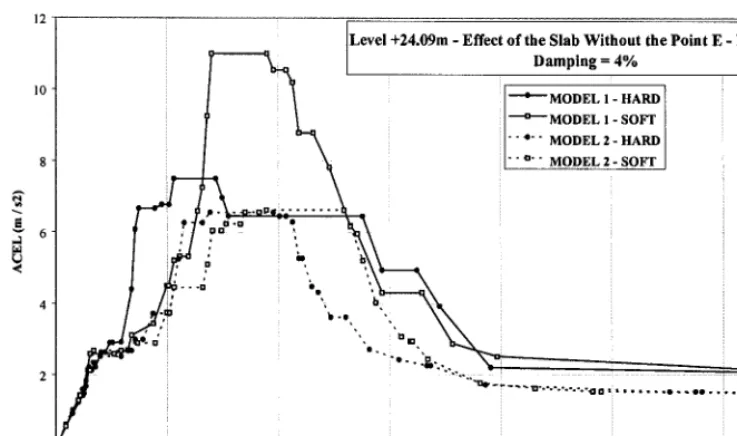
- Eliminating the point E from the enveloped floor response spectra (only for X3 direction- Fig. 5). Good agreement between the models 1 and 2 for the horizontal directions and soft soil condition can be seen (see Fig. 3 and Fig 4). This occurs due to the fact that the dynamic characteristics of this soil are predominant, which means that the structure is much stiffer than the soil. So, in the condition of the soft soil with pile foundation, the superstructure vibrates basically in only one frequency determined by the foundation stiffness.
For the hard rock condition the frequency where the peak acceleration occurs for the Model 2 for all the cases is greater than that of Model 1. The terms Arg 2 and Mrm 2 in Model 2, as considered for its generation, causes an increased stiffness in comparison to Model 1. The dynamic behaviour is basically determined by the superstructure, which has many vibration modes leading to broad horizontal response spectra. For the vertical direction, neglecting the local effects of the slabs, this fact is not verified because the foundation is relatively stiffer due to the axial stiffness of the piles.
Fig. 4 shows that the local effects do not modify the horizontal response spectra in relation to the ones without local effects. In the vertical direction the local effects are important and predominant for hard rock condition.
The vertical response spectra depend on the stiffness of the slabs. To illustrate this fact, Fig. 5 presents the floor response spectra at level 24.09 m without the local free edge slab (point E) to compare with Fig. 4 in the vertical direction with this point.
C O N C L U S I O N S
Generally, also for stiff foundation, the beam model is preferred due to the previous arguments and because the calculation of internal forces depends on the maximum acceleration at each level. That means, the
12
~°
.1
6
4
I
Level +24.09m - E x t r e m e s - Direction xl I. . . D a m p i n g = 4 %
l
---e--- MODEL 1 - HARDJ
~ MODEL 1 - SOFTI '" •" " MODEL 2 - HARD 1-- a-- MODEL 2 - SOFT
i . o . - u . . .
b
, i
15
5
5
~4
3
2
1
o 5 lo 15 20 25 30 35
FREQ(Hz)
I Level +24.09mDamping- Extremes= 4%" Direction X2[
- ~ .e . . . , ~ M O D E L 1 - HARD
i ". I ~ M O D E L 1 " S O ~
. - - o - - M O D E L 2 - HARD
j . ~ ~ ~ • 1- - a-- MODEL 2 -SOFT
e '. ;
b.
m " ~ - -
. . . i...~ . . . ".. . . . . . : . . .
, ! i i ,
0 5 10 15 20 25 30 35
F R E Q (Hz)
Level +24.09m - E x t r e m e s - Direction
I
S ! ~ * i ~ ~ " "'*"--MODELDamplng = 4%1 - tl X3 I
. .. ~.-ep ~ . . . u. ---ARD
--a----MODEL 1 - SOFT -. 4D.. MODEL 2 - HARD
: , ' .- a-- MODEL 2 - SOFT
. . . ~
a
5 I0 15 20 25 30
F n L Q (Hz)
~ 12
8
~7
45
40
35
~ 3o
~ 25 ~ 2o
15
10
5
0
L e v e l + 2 4 . 0 9 m - Local Effect of the Slab - Direction Xl[ i
D a m p i n g = 4 %
I
i ~ ~ MODEL 1 - HARD
! . . . -"°"-- MODEL 1 SOFT
"" *'" MODEL2 HARD
" " 43"" MODEL2 SOFT
. . . wo _
5 ]o 15 20 25 30 35
FREQ (Hz)
0
°f° Sl b °
i°nX lo m , , .
i "'*"-- MODEL 1 - HARD
..--o..-- MODEL 1 - SOFT
• " *" " MODEL 2 - HARD
• . . . ¶ .. o.. MODEL 2 - SOFT
"''" ~
! i
5 10 15 20 25 30
FREQ (Hz)
~ ]Level +24.09m - Local Effect of the Slab - Direction X3]
/ \ [ Damping= 4%
I
/ X I'--°--"OOEL''SOFT I ~ I ... MO,,EL~-HAS,, I
MODEL2 SOFT [
~.~...' " " ~ ~ ... - : . . ~ . ~ . . . . i - " ' - - - ~ _ _ _ _ _ _ _ _ _
evee, o- - , . . . ~ w..~ . . . - c * - - - o . . . . o o ' . . . - o . -
0 5 10 15 20 25 30 35
FREQ ( H z )
<
Level + 2 4 . 0 9 m - Effect of the Slab Without the Point E - D i r e c t i o n X 3 ~ 4 ~ D a m p i n g - 4 %
i / ~ M O D E L 1 - H A R D ~ M O D E L 1 - S O F T - - ~ - - .e-- M O D E L 2 - H A R D
..., ~ % ', ~
', i~ i~n ~'~'~ ... !
e . " .
:
-..2°
" ' " U o ' ' " ' " " ~ " " " " " ' - " a O ::.s • . . . o , , , o o , , : . . .
2
,
5 10 5 20 25 30 35
F R E Q (Hz)
Fig. 5. E x t r e m e Points Plus L o c a l Effects of the Slab W i t h o u t the P o i n t E - L e v e l + 2 4 . 0 9 m
intemal forces depend on the rigid body acceleration. It is known that rigid body acceleration is not very sensitive to different types of model. The building, which is analysed here, is in the limit of the plane section assumption for a beam model.
In general, in case of very soft foundations the floor response spectra determined by employing beam models are adequate.
In case of stiff foundations the use of complete finite element models is advisable.
For intermediate type of foundations it must be taken into account the other characteristics of the structures (relative dimensions, weight, etc.) in order to permit the choice of the most adequate model.
However, in case of the stiff foundation, beam models may be used for evaluation of the spectra since correction measures about the stiffness of the floor are taken into account to represent the local effects at the floor. This can be made with an additional local analysis of the floor slabs, which can not be considered, as rigid. The results of this analysis have to be combined with the floor response spectra of the beam model in order to generate the design response spectra for the secondary systems.
The vertical behaviour is the most affected by a stiff foundation because the floors can have deformations out of its plane. That means that the biggest difference between the floor response spectra obtained using the two kinds of models is expected in the vertical direction.
The relative dimensions must be considered in order to permit the definition of the most adequate model, because for structures, which have one dimension in plan much bigger, than the other one and that are founded on medium to stiff soil, the plane section assumption can not be adopted.
In some cases, when it is necessary to know the relative movements between the supports of the component or piping, only a refined finite element model can be employed.
R E F E R E N C E S
1. KTA 2201.3 - Design of Nuclear Power Plants against Seismic E v e n t s - Part 3: Design of building Structures. 2. USNRC Regulatory Guide 1.122 - Development of Floor Design Response Spectra for Seismic Design of
Floor - Supported Equipment or Components.
3. F. E. Richart, Jr., R. D. Woods and J. R. Hall, J r . - "Vibration of Soils and Foundations"- P r e n t i c e - Hall International Series in Theoretical and Applied Mechanics, 1970 by Prentice Hall, Inc., Englewood Cliffs, New Jersey.
4. A. S. Veletsos and B. Verbic - " V i b r a t i o n of Viscoelastic Foundations" Earthquake Engineering and Structural Dynamics, Vol. 2, page 8 7 - 102, April 1973.
5. A. S. Veletsos and Y . T . W e i - "Lateral and Rocking Vibration of Footings" Journal of the Soil Mechanics and Foundation Division, Proceedings of the American Society of Civil Engineers, Sept. 1971.
6. M. Novak and K. S a c h s - "Torsional and Coupled Vibrations of Embedded Footings" Earthquake Engineering and Structural Dynamic, Vol 2, page 11 - 33, 1973.
: i)!~ ,