Study on The Biomechanical Causes and
Effects of Abnormal Patterns of Human Gait
Aparna Madhu, Vinu Palissery
Dept. of Civil Engineering, MCET, Thiruvananthapuram, India
Dept. of Civil Engineering, NIT Calicut, Calicut, India
ABSTRACT: Human gait or walking pattern is the forward displacement of the body produced as a result of a number
of forces and moments developed in its components. Abnormal gait patterns can result due to defects in any of the three systems i.e. skeletal, muscular or nervous system. Any gait pattern can be described in terms of gait parameters. These can be spatiotemporal parameters such as gait speed or stride length, kinematic parameters such as the joint angles and kinetic parameters such as the moments and muscle forces that cause the motion. The differences in the pattern and magnitude of these parameters can be used to identify a gait as abnormal.
Gait can be considered similar to the movement of a multibody rigid linked system where the links of the system consists of the segments of human body, which are connected at the joints across which muscle forces and moments act that ultimately result in the forward displacement of the so called multibody system. The activity of the muscles, the active force generating component, is controlled by the nervous coordination from the brain. Gait analysis based on mathematical modelling of the musculoskeletal system is used for determining the gait parameters, with the motion capture data and ground force reaction during a gait cycle as the input to the model. The system being highly redundant, with a large number of unknown muscle forces, an optimization approach is sought to solve the problem with the use of musculoskeletal simulation softwares.
In the present study the calculation of the kinematic and kinetic parameters of a set of abnormal human gait were carried out by means of an inverse dynamic analysis of the human lower extremity during walking, using the software OpenSim. In the study five gait patterns, one normal and four crouch gait, an abnormality typically caused as a result of cerebral palsy, have been analyzed to obtain the muscle forces and joint reactions at the final stage, and a comparative study with normal has been done. A brief discussion of possible causes and effects has been done from this comparison. The options for validation have been discussed and the suggestions for improving the quality of predictions are also made.
KEYWORDS: gait parameters,multibody,musculoskeletal system
I. INTRODUCTION
A. HUMAN MUSCULOSKELETAL SYSTEM
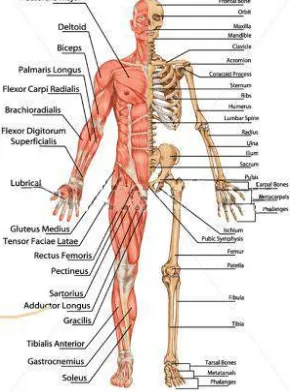
The primary functions of the human musculoskeletal system (Fig. 1.1 a) include supporting the body, allowing motion, and protecting the vital organs of the body. The skeletal system consists of bones connected to each other through joints. There are 206 bones in human skeletal system. The joints allow relative movements between bones especially the joints between bones of upper and lower limbs. Cartilage prevents the bone ends at these joints from rubbing directly on to each other. Muscles span across joints, connecting one bone to the other (Fig 1.1 b). The major joints which allow movements are the shoulder, hip knee and ankle joint (Fig.1.1c). There are 642 skeletal muscles in the body. Muscles are activated by neural signals resulting in a series of biochemical processes, causing contraction and producing force to pull on the attached bones causing the relative movement (mostly rotation) of the bones about the joints. Ligaments and tendons are connective tissues which connect bones at the joints and muscles to bones respectively.
A cross sectional view of the skeletal muscle and muscle fiber is given in Fig. 1.2.The process of contraction of human muscle gets initiated with neural signals called action potentials travelling through motor neurons to the respective muscle fibers. The connecting site between the motor neuron and the muscle is called the neuromuscular junction. One motor neuron can have branches to many muscle fibers, and these together are called a motor unit. When the nerve impulse reaches the end of the nerve fiber, a few chemical and electrical potential changes occurs in the muscle fibe causing the sliding motion of actin filaments about the myosin filaments causing the muscle to contract. These contractive forces in muscles produce movements of bones. Muscles always contract whatever the type of movement. To cause a particular movement and its opposite movement different group of muscles may have to work in tandem. Movements are made possible mostly muscles working in groups.All muscles have an origin and insertion point bridging across the joint about which they act. For example movements of the hip joint, are caused by mainly muscles shown in Fig. 1 (b). The origins of most of these muscles lie on the pelvis 4 or hip bone and they are inserted to the femur bone on the thigh portion. The contraction of hip flexor muscles (shown red) causes the thigh to lift up and hence the hip is said to get flexed.
Electromyogram is a record the muscle activity in the form of electric potentials during the muscle activation known as electromyography (EMG). The use of EMG is widely practiced in the field of medicine and it aids in knowing whether a muscle or usually a muscle group is active or inactive during a particular time by analyzing the EMG during that time.
1
B. BIOMECHANICS OF GAIT
The biomechanics of gait deals with the analysis of movements and the forces causing them. The goal of walking or gait , is to move the body forward towards a desired location and at a desired speed using the least amount of energy possible. The body does this by moving in as straight a line as possible while moving forward. During walking, the most energy efficient movement is one in which the body moves up and down very little.
C.TERMINOLOGY IN GAIT ANALYSIS
(i) Gait: Walking pattern of an organism.
(b) Hip joint with the hip flexor muscles
(ii) Gait cycle: The set of cyclic events during walking that starts when one foot makes contact with the ground and ends when that same foot contacts the ground again. The major events of a normal gait cycle are shown in Fig. 2. (iii)Stance phase: The phase during which the foot is in contact with the ground.
(iv) Swing phase: The phase during which the foot is swung forward for forward locomotion. (v) LHC: Left Heel contact on the ground.
(vi) RHC: Right heel contact on the ground.
(vii)LTO (Left Toe Off): The point when the Left toe leaves the ground. (viii)RTO (Right Toe Off): The point when the Right toe leaves the ground. Important joint movements
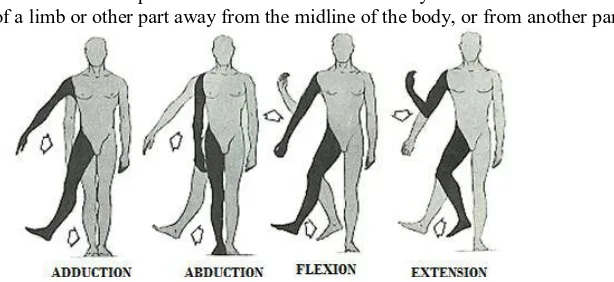
Flexion: The movement in which there is an increase in the angle between the segments meeting at the joint. (Fig.1.4.) Extension: The movement in which there is an decrease in the angle between the segments meeting at the joint.
Fig 2 Gait cycle
Adduction: the movement of a limb or other part towards the midline of the body.
Abduction: the movement of a limb or other part away from the midline of the body, or from another part.
Fig.3 Important movements in gait
Gait Parameters
The various gait parameters include kinetic kinematic and spatiotemporal parameters. The kinematic parameters are the angles of joints during flexion adduction rotation etc.
For example if the knee joint is considered, the flexion or the bending at the joint to bring the shank towards the thigh is known as hip flexion. The third figure in Fig. 3 shows the same.
The angle at the joint turned by the shank from its original orientation the knee flexion angle. During hip flexion, the angle produced between the axis of the thigh segment (femur) and the transverse plane at the hip is the flexion angle, whereas that made by the shank (tibia) with the transverse plane at the knee joint is the knee flexion angle. Similarly at the ankle joint there is a flexion angle.
Adduction angles are measured from the sagittal plane or the plane of propagation during locomotion and rotation about the frontal plane.
The various kinetic parameters include the net moments produced, muscle forces and joint reactions developed at the joints of the lower extremity during gait.
The analysis of movement of human skeletal system and under the action of forces can be treated similar to the analysis of a structural system. The skeletal system with its bone and joint feature forms the structural system, while the muscle forces and other external forces like ground reacting forces cause the motion. The analysis is quite complex considering the complexities and variations in geometry, joint features, number of muscle forces and force activation process. However simplified mathematical models of the system are used for analyses which were found to be useful in many applications.
In gait analysis, models represent the dynamics of a system of rigid bodies and joints that are acted upon by forces to produce motion. The skeletal part of a model is represented by rigid bodies interconnected by joints. Joints define how a body (e.g., bone segment) can move with respect to its parent body. All bodies have a parent and are connected to its parent via a joint, except for ground. Constraints can also be applied to limit the motion of bodies.
Muscles are modeled as specialized force elements that act at muscle points (ie. insertion and origin points) connected to rigid bodies. The force of a muscle is typically dependent on the path through muscle points comprised of muscle fiber and tendon lengths, the rate of change of the fiber lengths, and the level of muscle activation. Musculotendon models describing the muscle force generation in relation to muscle activation and muscle and tendon tissue stiffness (active and passive elements) of the unit are used to describe these models.
The derivation of the equations of motion for the skeletal system, modeling of the structure and muscle force, and the muscle path can be either automated or greatly facilitated by the use of software tools. Also the various phases involved in the analysis procedures demand the use of optimization and other iterative procedures.
SIMM is a commercial musculoskeletal modeling software that originated from the bioengineering department of Stanford University. It can perform both forward and inverse simulations but its interactive graphical tools for editing models or building new models are rather limited.
OpenSim shares many of the features and algorithms in SIMM and the tools in SIMM can be used to build and edit its musculoskeletal models.
C. GAIT ANALYSIS
There are qualitative and quantitative methods for analysis of gait. By qualitative it is meant that the gait is analyzed based on clinical observation and evaluation with or without analyzing a recorded data of the movement through any motion capture system in a gait lab.
Observational, or qualitative analysis is a visual method of analysis and can be as simple as watching an individual walk whereas quantitative analysis requires instrumentation such as synchronized opto-electronic cameras, force platforms, and electromyography. Using quantitative gait analyses to fully describe a person's gait generally entails the combination of numerous measurements, including:
(i) Temporal-spatial parameters: measures related to walking distance, speed, and length of steps. (ii) Kinematics: the geometry of motion, including joint angles.
(iii)Kinetics: measures of motion that include force, including joint moments. (iv)Energy expenditure: measures associated with the metabolic cost of walking.
Regardless of the methods, the measurements that are collected are used to assess the quality of the gait and to characterize the motion. It requires a high skill in observational or qualitative gait analysis, to perform a rapid assessment of a gait in the clinic and suggest appropriate measures to eliminate or reduce gait abnormalities. Here the quantitative gait evaluations are able to provide additional, objective information to supplement the clinical observation.
D. METHODS IN QUANTITATIVE GAIT ANALYSIS:
Gait analysis mainly involves two main procedures: (i) The collection of human gait data and
(ii) The analysis of the gait using such data.
the computer calculates the trajectory of each marker in three dimensions. To calculate the kinetics of gait patterns, most labs have floor-mounted load transducers, also known as force platforms or plates which measure the ground reaction forces and moments, including the magnitude, direction and location (called the center of pressure). The spatial distribution of forces can be measured with pedobarography equipment.
Analysis and calculations are then performed in order to obtain all the data required for evaluating the quality of the subject’s gait, including basic gait parameters (spatial-temporal, angular, kinetic parameters), forces and moments occurring in the joints, muscle activity during each gait cycle, velocity and acceleration of each segment of the limb, etc.
The methods involved in analysis are: Inverse Dynamics
Though the external forces are measurable directly through force plates or load cells, the muscle forces and joint reaction forces remain unknown.Since direct muscle force measurement is not possible in humans as it is considered too invasive, in order to provide estimation of these internal forces, musculoskeletal models have been introduced for a comprehensive review. These models are composed of rigid bodies representing the bones connected by mechanical joints. Muscles are included in the model as actuators able to contract and provide the joint torques necessary to accelerate the segments, so generating the body movement. . With this and the known dynamics of each body segment, enables the solution of equations based on the Newton–Euler equations of motion permitting computations of the net forces and the net moments of force about each joint at every stage of the gait cycle.
Fig. 1.6 Subject with markers at different positions on the body
The computational method for this is known as inverse dynamics. But the highly indeterminate nature of the skeletal structure, owing to the large number of unknown forces acting on it is the greatest challenge in the development of such models. This is where the use of musculoskeletal modelling and analysis soft wares become inevitable.
Forward simulation
The forward dynamics problem provides the motion of a multibody system over a given time period as the consequence of its initial conditions and the applied forces. The state of a model is the collection of all model variables defined at a given instant in time that are governed by dynamics. In a musculoskeletal model the states are the coordinates and their velocities and muscle activations and muscle fiber lengths. If the initial states of a subject are known, the dynamics of a model calculates the rate of change of the model states (joint accelerations, activation rates, and fiber velocities) in response to forces and controls. A forward dynamic simulation is the integration of the musculoskeletal model‟s dynamical equations starting from a user-specified initial state. After applying the controls, the activation rates, muscle fiber velocities, and coordinate accelerations are computed. Then, new states at small time interval in the future are determined by numerical integration.
Forward simulation is also a method that can be used as a check to the results of inverse dynamics i.e. the joint forces and moments calculated by inverse dynamics procedures can be used to drive the forward dynamic analysis, in which the movements produced as a result of these forces are calculated, and these results can be compared with the actual kinematic data measured.
1.1.6 Abnormal gaits and the application of gait analysis
human gait. The effects of such abnormal gait also result in such as overloading of joints and development of excess pressure on limbs etc. may lead to irreparable damages on the health of such subjects or patients. Thus there is a need for the quantitative assessment of gait disorders which would help to identify these changes of a particular gait in order to prescribe treatment or correction methods and also to follow up the effects of corrective orthopaedic surgeries. This is where gait analysis finds its main application.
The quantitative measurements of gait, discussed before vary during each gait cycle and this variation follows different patterns for normal and abnormal gait.In the present study a few cases of abnormal gait, crouch gait, will be studied to understand its biomechanical effect on components. Crouch gait is characterized by excessive knee flexion during stance, which is usually accompanied by exaggerated flexion, adduction, and internal rotation of the hip. Excessive knee flexion substantially increases the energy requirements of walking and, if not corrected, can lead to chronic knee pain and joint degeneration. Thus the quantitative analysis of gait parameters at various components of the body allows a better method of studying the causes and effects of abnormal gaits. This thesis work aims at the detailed biomechanical study of a few cases of crouched gait patterns. Observed measured abnormal patterns of gait will be studied by a detailed analysis of the system to get joint forces or moments and muscle forces, for comparison with the normal data.
E. OBJECTIVES
i. To carry out a comparative study of variation of kinematic and kinetic parameters of the human lower extremity during locomotion (gait) through musculoskeletal simulation.
ii. To obtain the causes and effects of an observed abnormal gait pattern using the results from such a comparative study.
iii. To check the accuracy of such prediction and to arrive at suggestions for improving the same.
F. SCOPE OF THE STUDY
The evaluation of gait parameters during walking is helpful in assessing abnormal gait. However the analysis using computational tools always may not lead to realistic results as a generalized model is used and the incorporation of certain subject specific properties may not be possible for all cases. Hence the reliability of output obtained from such studies needs to be further investigated and validated with some in vivo measurement or clinically available information like EMG. Statistical tools are generally adopted for this purpose. Such output can also be checked against the clinically available information in order to be validated.
II. METHODOLOGY
A. GENERAL
The methodology followed for the evaluation and comparison of gait parameters are as follows: (i) Collection of data of subjects captured in motion capture laboratories.
(ii) Choosing an appropriate musculoskeletal model in OpenSim.
(iii)Conversion of input data to required formats and incorporation of this data into the chosen model. (iv) Analysis of the model in OpenSim.
(v) Analysis to obtain kinematic and kinetic parameters like joint angles, net moments, muscle forces and joint reactions.
(vi) Analysis of results and identifying possible causes and effects of abnormal gait. (vii)Discussion on possible verification options for the predictions.
MUSCULOSKELETAL MODELLING SOFTWARE AND MODEL
OpenSim software was chosen for the analysis. The model Gait2392 simbody was chosen for this study. The Gait 2392 model has 23 degrees of freedom and 92 muscle actuators in the model. The Gait 2392 model is a three-24 dimensional, 23-degree-of-freedom computer model of the human musculoskeletal system. It features 92 musculotendon actuators to represent 76 sets of muscles in the lower extremities and torso.
B. DATA COLLECTION
1. Marker positions (a total of 40 markers) the form of spatial coordinates (along X, Y and Z axes) of the model coordinate system during standing pose and walking of subjects.
2. Ground reaction force developed obtained from force plate readings. 3. Electromyography recording of important muscles.
The website www.simtk.org, being the official website of the software used i.e. OpenSim, the spatial coordinates in the data match with the coordinates in the software used.
C. ANALYSIS USING OPENSIM
A comparative study of the variation in the kinetic and kinematic parameters of the lower extremity (right leg) of 5 subjects was done by analyzing them using the musculoskeletal modeling and analysis software known as OpenSim. The kinetic parameters were normalized with respect to the body mass of each subject. The resulting joint moments were normalized with respect to the body mass of each subject since it is highly effective in reducing variances due to weight differences between the subjects. The subject with normal gait pattern had a body weight of 72.6 kg and subjects C1, C2, C3 and C4 had body weights of 28.2 kg, 28 kg, 29 kg and 28 kg respectively. The following are the chief stages in the analysis of gait.
Scaling
Scaling is the first step in the analysis which alters the anthropometry of a model so that it matches a particular subject as closely as possible. This is done by minimizing the error between experimental and model marker coordinates during static pose of the model (Fig.3.1). The mass distribution of the body is also carried out in this step by a process known as measurement based scaling. This is done by allocating the mass on the basis of scale factors of each segment obtained as the sum ratios of the distance between two of the three markers on a segment in the subject to the distance between the same two markers on the same segment in the model.
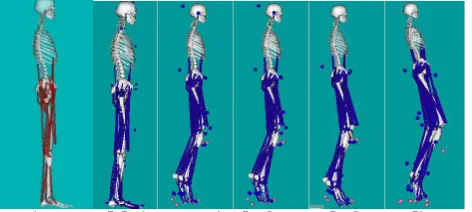
Fig. 4 Models in open sim before and after scaling
From left to right, Unscaled model, scaled models for Normal , C1,C2, C3 and C4
Inverse kinematics
This computes the joint angles for the musculoskeletal model that best reproduce the motion of a subject from the coordinates of the markers during movement of the subject. This step also puts the model into motion.
Inverse dynamics
In inverse dynamics, the joint angles obtained in the previous step, the angular velocities, and angular accelerations of the model, obtained by differentiation of the position coordinates, together with the experimental ground reaction forces and moments are used to solve for the net reaction forces and net moments at each of the joint. Inverse Dynamics solves intersegment reaction forces and moments using Newton‟s Equation of motion and Euler‟s equation. Residual Reduction Algorithm (RRA)
The residual forces that occur during the previous step of analysis are reduced here. The ideal residual and reserve joint actuators are identified and there is An adjustment in mass distribution center of mass of the torso, as well as the kinematic tracking tasks. Here control constraints on the actuators (to limit the maximum residual force) can be specified. This step reduces the residuals to a minimum value, by adjusting the center of mass of the torso.
Static Optimization
Joint Reaction Analysis
Calculation of the joint forces and moments transferred between consecutive bodies in a model. These forces and moments correspond to the internal loads carried by the joint structure. These loads represent the contributions of all un-modeled joint structures that would produce the desired joint kinematics, such as cartilage contact and any omitted ligaments.
E. VARIATION OF GAIT PARAMETERS
Post processing the results of the analyses, the patterns and magnitudes of various parameters, kinetic and kinematic against time can be graphically represented and studied. The comparison of kinematic results for normal and abnormal gait was done for one complete gait cycle where as that of kinetic parameters were done for the stance phase being the period for which the ground reaction force data of the subjects was available.
III. RESULTS AND DISCUSSIONS
A. GENERAL
The study of biomechanical parameters during abnormal human gaits can be carried out in two ways.
1. By the overall comparison of variations of gait parameters for different subjects through one gait cycle with that of normal gait and their differences from each other.
2. The comparison of variation of parameters for each particular gait pattern with that of normal pattern and deriving conclusions based on the interpretation of significant differences between both.
Since the variation of qualitative and quantitative variation of gait parameters studied vary in different subjects during each phase of the gait cycle in different patterns, this method of comparison is more suitable when the prediction of causes and effects of abnormal gait are the primary aim.
B. COMPARISON OF KINETIC AND KINEMATIC PARAMETERS OF ABNORMAL GAITS WITH NORMAL
GAIT
The comparison is based on the results obtained by the analysis of lower extremity model in OpenSim. The interpretation of results is aimed at finding the reason behind the abnormality especially as the malfunction of muscles which is the usual reason behind the development of gait problems in cerebral palsy.
Kinematic parameters: Variation of joint angles
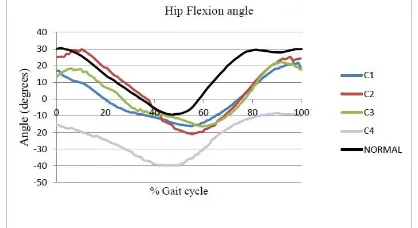
The variation of kinematic parameters for normal gait and 4 crouch gaits were compared for one complete gait cycle. The pattern of variation of hip flexion angle in one gait cycle, shown in Fig. 4.1 shows that the flexion of hip in all crouch gaits was slightly reduced than normal. An evident difference was observed in gait C4 where the flexion of the hip joint was very low compared to the normal.
Fig. 5 Variation of hip flexion angle with % gait cycle
Fig.6 Variation of knee flexion angle with % gait cycle
In normal gait, a knee angle range of 0 to 60 degrees occur during on complete cycle. The persons with abnormal gait showed abnormal knee flexion which never dropped to zero (Fig.6) , which means that the knee does not extend fully as in normal case at any point during the gait cycle. One of the chief identifications of crouch gait is such a condition where the knee remains flexed throughout the gait cycle.
The ankle flexion showed a slightly similar pattern as in that of normal gait only in subject C1 (Fig. 7) . The normal range of ankle joint angle is from 25 degrees of plantarflexion (negative) to about 7degrees of dorsiflexion (positive). The remaining C2, C3 and C4 showed a negative value of flexion angle indicating a plantar flexed foot ankle or equinnus foot throughout the gait cycle. The ankle flexion showed a slightly similar pattern as in that of normal gait only in subject C1 (Fig. 7) . The normal range of ankle joint angle is from 25 degrees of plantarflexion (negative) to about 7degrees of dorsiflexion (positive). The remaining C2, C3 and C4 showed a negative value of flexion angle indicating a plantar flexed foot ankle or equinnus foot throughout the gait cycle.
Fig.7Variation of knee flexion angle with % gait cycle
The narrow range of knee flexion angle observed for gait C1 indicates a stiff knee gait typically seen in crouch gait. Posssible causes and effects
Excessive dorsiflexion of the ankle can be the result of weakness in soleus muscle. or the fusion of ankle and subtalar joints. Here Fig shows action of soleus failing which the ankle remains dorsiflexed.
Kinetic parameters:
The study of variation of kinetic parameters was limited to the stance phase of the gait cycle. The majoraction of forces and moments, i.e. the kinetic parameters on joints occur during the stance phase.
Causes of inadequate hip flexion can be the weakness of hip flexor muscle. The effect of such a weakness is increased adduction since there are some common muscles (Fig.4.20) in flexors and adductors and in case of weak flexors and thereby a reduced flexion of the hip, some of these muscles do extra work to bring about flexion required and the result is increased adduction strain to these abdominal muscles.
Hip flexion moment
It is seen that the hip flexion moments developed in all gait patterns do not show considerable variations from the normal range. The moments normalized by the body weight ranges within -1 to +1, the sign convention being negative for flexion and positive for extension the general variation being the development of a flexion moment during initial and midstance followed by extension as the hip joint angle reduces and the foot gets ready for toe off . The muscle force variations over the gait cycle follows the normal pattern except in the case of C4 where the range of flexion moment developed as well as the muscle forces acting significantly less compared to normal. This is evident in the reduced hip flexion kinematics of C4.In normal gait, the knee flexion moment (Fig 4.7) increases during the first half of stance as the tibia moves forward and the flexion ankle increases. This pattern is seen in all the crouch gaits C1to C4 considered. But during the later stance where the knee joint gets extended, opposite moments do not seem to develop for the crouch gaits as in normal ie. the magnitude of the moment goes on increasing and finally reducing to zero only towards the end of the stance phase when the foot is ready to be swung. Here it must be noted that the initial absence of zero knee flexion ankle in kinematics is not due to an abnormally developed moment at the initial stance. This brings the possibility of a cause to be the flexed condition of the knee without the action of any abnormal forces at the joint.
The chief flexor muscles of the knee show a development of higher force than normal case. Especially in cases C1 and C2 the muscle forces are more than the normal range compared to the other crouch gaits. Also in gait C2, the pattern of variation of force shows resemblance to that of normal, and correspondingly the knee joint kinematics of C2 is the one that matches most with the normal.The magnitude of normalized joint moments produced at the ankle is less for the crouch gait than for normal. But the variation pattern seems to be similar.
C. COMPARISON OF PARAMETERS OF GAIT C1
Discussion of parameters
In the normal human walking, just after heel strike (which is considered here as the beginning of the gait cycle), or initial contact of the heel with the ground, there is a minimum amount of plantar flexion which brings the forefoot in contact with the ground. Once the foot is completely rests on the ground, it remains stationary while the tibia moves forward in the direction of propagation leading to dorsiflexion (Fig. 4.16) which continues through the first half of terminal stance after which plantar flexion again comes into play as the foot gets ready for toe off position. This shows in the plot as the reduction in the flexion angle from the maximum to the minimum. After this the dorsiflexion prepares the foot for the next heel strike. In crouch C1 the main observations are:
i. Dorsiflexion after heel strike or initial contact. Here the foot is placed on the ground in the dorsiflexed position, i.e. there is no plantar flexion following initial contact
ii. Also evident from the ankle flexion moment variation that at heel strike the center of pressure of foot is anterior to the ankle axis due to which the net moment is an external dorsiflexion moment. Figure 4.16 shows the shifting of center of pressure during and just after heel strike causing subsequent change in flexion moment developed at the ankle in normal gait. In crouch gait C1, the initial moment itself is dorsiflexion which means that stage B is the initial contact on the ground i.e. there is a foot flat initial contact.
ii. iii. Here the toe off occurs around 50% of the gait cycle
The narrow range of knee flexion angle observed for gait C1 indicates a stiff knee gait typically seen in crouch gait.
4.3.2 Posssible causes and effects
Excessive dorsiflexion of the ankle can be the result of weakness in soleus muscle. or the fusion of ankle and subtalar joints (fig 4.18). Here Fig 4.19 shows action of soleus failing which the ankle remains dorsiflexed.
Discussion on verification procedures
Model validation is the process of determining how well the model represents the real world data. The fundamental goal of a validation process is to assess the computer simulation‟s ability to predict certain variables of interest. However in this study the final results are the muscle forces whose magnitudes cannot be measured experimentally. Instead these can be compared with the Electromyographs of the subjects to check whether the general variation is in accordance with the EMG values measured.
Here the pattern of normalized EMG of the muscle tibialis anterior matches with the pattern of force variation in the muscle (normalized to the body weight). This indicates that the muscle force variation obtained as part of the analysis in OpenSim is in accordance with the EMG pattern of the subject measured. Generally EMG cannot be compared with the magnitude of muscle force but the pttern of activity of the muscle.
b) Rectus femoris:
The lower value of hip flexion moment can be the result of weak action of the hip flexors. Studying the normal EMG of rectus femoris , one of the main hip flexor muscles, and the EMG of crouch C1, there is a considerable difference in amplitude of the EMG. The normal range of EMG as a percentage of the mean EMG from Patikas et al. (2007) was compared to the EMG of the gait C1 for the rectus femoris muscle which is a hip flexor and a knee extensor. There seems to be a considerable difference in the amplitude range (Fig. 4.24) towards the initial phase of the gait cycle, i.e. 0 to 20%. This may also account for the increased knee flexion during the period.
D. COMPARISON OF PARAMETERS OF GAIT C2
Discussion of parameters
The ankle joint remained plantar flexed throughout gait cycle Causes of excessive plantar flexion
i. Pretibial muscle weakness. Especially weakness of tibialis anterior to produce an adequate dorsiflexion but in such cases the excessive plantar flexion is more apparent during the mid-swing phase.
ii. Plantar flexion contracture
iii. Soleus and Gastronemius spasticity: The state in which the soleus and gastrocnemius muscles remain always in an active state due to which the ankle joint is plantarflexed.
iv. Voluntary excessive plantar flexion: The quadriceps is a set of muscles contributing to the extension at knee joint. If the quadriceps are weak, then, to protect it from the pain caused during knee flexion, the heel is raised, for the knee to extend which leads to a deliberate plantar flexion
Effects of excessive plantar flexion:
During the stance phase, in normal gait, the entire foot rests on the ground, but in a gait with excessive plantar flexion, the initial contact on ground is made by the toe unlike the normal case where the heel first touches the ground. The persistent flexion at the knee joint (Fig.4.27) and the plantar flexed nature of the ankle can be the result of spasticity of gastrocnemius. Premature heel off and short step length are the effects.
IV. CONCLUSIONS AND SCOPE FOR FUTURE WORK
i. Abnormal gait patterns in humans have a significant impact on the different components of the human musculoskeletal system
ii. The quantitative measures of these values for normal gait depend on the specific characteristics of the patient such as age, body weight and defects by birth.
iii. Predictions of causes and effects of abnormalities can be done with the help of validated musculoskeletal modeling software but it needs a further understanding of the system defects.
iv. The analysis of gait using subject specific models would ensure more conclusive results.
ii. Possibility of incorporation of various properties such as muscle fiber lengths and specific joint properties into the model has to be investigated so that the analysis is done on a model which has properties and constraints suiting the subject.
iii. The analysis of muscle forces can be said to be more accurate provided the results can be validated with the help of electromyograms (EMG) .This can be possible only if the EMG of important muscles aiding in the gait are available that can be post processed and analyzed.
REFERENCES
[1] Anderson F. C., Pandy M.G, (1980), “Dynamic optimization of human walking”. Journal of Biomechanical Engineering , 123, pp 381-390, [2] Anderson F. C., John C. T., Guendelman E., Arnold A. S., Delp S. L., (2006), „„SimTrack: Software for Rapidly Generating Muscle-Actuated
Simulations of Long-Duration Movement”, National Institutes of Health through the NIH Roadmap for Medical Research Grant.
[3] Arnold A. S. , Thelen D.G. , Schwartz M.H. , Anderson F.C. , Delp S.L. , (2007), “ Muscular coordination of knee motion during the terminal-swing phase of normal gait” , Journal of Biomechanics, 40, pp 3314–3324
[4] Bergmann G., Deuretzbacher G., Heller M., Graichen F., Rohlmann A., Strauss J., Duda G.N. , (2001) , “Hip contact forces and gait patterns from routine activities” ,Journal of Biomechanics, 34, pp 859–871.
[5] Delp S. L., Anderson F.C. , Arnold A.S. ,Loan P. , Habib A. ,John C. T. , Guendelman E. , and Thelen D.G. , (2007), “OpenSim: Open-Source Software to Create and Analyze Dynamic Simulations of Movement”, IEEE Transactions On Biomedical Engineering, Vol. 54, No. 11, pp 1-12.
[6] Deluzio K. J., Wyss U. P., Costigan P. A. , Sorbie C., Zee B., (1999), “Gait assessment in unicompartmental knee arthroplasty patients: Principal component modelling of gait waveforms and clinical status”, Human Movement Science, 18, pp 701-711.
[7] Erdemir A. , McLean S. , Herzog W., Bogert A.J.V.D. , (2007), “Model-based estimation of muscle forces exerted during movements”, Clinical Biomechanics, (22) , pp131–154.
[8] Hardwick M. E., Pulido P.A., D'Lima D. D., Colwell Jr. C W. , (2006) e‐Knee: The Electronic Knee Prosthesis, Orthopaedic nursing,25(5), 326-329. Eason, B. Noble, and I.N. Sneddon, “On certain integrals of Lipschitz-Hankel type involving products of Bessel functions,” Phil. Trans. Roy. Soc. London, vol. A247, pp. 529-551, April 1955. (references)
[10]Kuo A.D., (1993), “A least squares estimation approach to improving the precision of inverse dynamics computations”,Transactions of the American Society of Mechanical Engineers, 120,pp 148-159 .
[11]Kaufman K. R. , Hughes C. , Morrey B. F., Morrey M. , An K.N. , (2001) , “Gait characteristics of patients with knee osteoarthritis”, Kenton Journal of Biomechanics, 34, pp 907–915.
[12]Kecskemethy A., (2011), “Integrating efficient kinematics in biomechanics of human motions”, 2011 Symposium on Human Body Dynamics, Procedia International Union of Theoretical and Applied Mechanics, pp 86–92.
[13]Landry S.C. , McKean K. A., Hubley-Kozey C. L., Stanish W. D. , Deluzio K. J. , (2007), “Knee biomechanics of moderate OA patients measured during gait at a self-selected and fast walking speed”, Journal of Biomechanics, 40,pp 1754–1761.