Fabric Defect Detection by Singular Value
Decomposition based Reduced Coefficient
Fabric Space Optimized by Particle Swarm
Technique and Implemented through OpenCL
Jayanta K. Chandra1, Debosmita Chakraborty 1, Aritra Barman1, Asit K. Datta2
Department of Electrical Engineering, Future Institute of Engineering and Management, Kolkata, India1
Department of Applied Optics and Photonics, University of Calcutta, Kolkata, India2
ABSTRACT: To detect defects in woven fabric a reduced coefficient fabric space is constructed, for which the principal components representing row and column wise data distribution of the training fabric sub images are determined with the help of a novel singular value decomposition based method. The size of this reduced coefficient fabric space is suitably optimized by particle swarm optimization method, subject to the minimum detection error of fabric defects. For faster operation the generation of overlapped test fabric sub images, equal in size with training fabric sub images along with its projection on reduced coefficient fabric space is done by using parallel processing implemented through a novel algorithm in OpenCL. Finally detection of fabric defect is done by using support vector machine classifier. The method is tested on TILDA database for its validation. Significant performance enhancement is achieved as compared to 2 directional 2DPCA method both in terms of defect detection accuracy and reduction at computational cost.
KEYWORDS: Defect detection in fabric, sub image based singular value decomposition, 2 directional 2D principal component analysis, particle swarm optimization, support vector machine, OpenCL.
I. INTRODUCTION
Out of the various reported defect detection techniques in woven fabric [1, 2], the Principal component analysis (PCA) is a well known statistical approach [3, 4], that gives the data distribution of defect free and defective fabric samples by constructing the eigen-filters, using an ensemble of micro windows containing defect free and defective fabric information [5, 6]. Though this approach offers reduced computational cost as compared to the other statistical techniques [5, 7], yet such approaches are sensitive to background noise and local fabric distortions [2]. Moreover, it suffers from the difficulty of computation of covariance matrix for developing eigen-filters [8]. This problem is addressed in [8] and a solution is provided by using two dimensional PCA (2DPCA), which easily evaluates image covariance matrix directly from the original image matrices. It has also been reported that though 2DPCA is a better feature extraction technique [9] than the conventional PCA with lesser computational complexity [8, 10], yet it suffers from the problem of high number of coefficients which has been managed by two directional 2DPCA method [11], where 2DPCA is applied along the row and column of the training images to get the coefficient matrix containing the features. It is also reported that random sub space 2DPCA method provides better recognition rate by randomly selecting the eigenvectors containing the information of fabric texture [12, 13]. However this method does not assure the optimum size of coefficient matrix, which in turn decides the coefficient of fabric space, carrying the optimized features of training fabric images.
eigenvectors of the covariance matrix without framing it [15, 8]. Since the dimension of fabric defect is very small compared to the entire fabric image under inspection, a modular approach working on sub images of fabric is used which is expected to yield good detection capability. The fabric sub images used to develop the modified fabric space are the training fabric sub images. Finally the sub images of test fabric of a fabric class, equal in size with training fabric sub images are projected onto the modified fabric space of the fabric class, from where the detection of fabric defect is possible by support vector machine classifier.
For fast processing of the proposed method an OpenCL based algorithm is developed that runs in a heterogeneous environment consisting of CPU and GPU. This is required to utilize powerful processing unit of CPU and parallel working ability of GPU simultaneously. An OpenCL implementation of PCA for large scale data analysis is implemented in [16]. As the estimation of principal components does not have any contribution on the time complexity of the proposed method at the time of defect detection, so in this paper the developed openCL algorithm efficiently detects the test fabric sub images from the test fabric image and evaluates the coefficient matrices for all the test fabric sub images.
II. METHODOLOGY
A. DEVELOPMENT OF MODIFIED FABRIC SPACE BY USING SINGULAR VALUE DECOMPOSITION (SVD) METHOD
The goal of this section is to determine the reduced features of defects of a fabric class by framing the modified fabric space. In the conventional PCA method, the fabric images are represented by 1D vectors [17] and thus determination of covariance matrix becomes an inefficient process [8]. In case of 2DPCA method the fabric images are represented by 2D vectors which require many more coefficients than 1DPCA [11] and thus occupies huge memory space. Thus to get the advantage of 2DPCA in conjunction with the reduced coefficients, the two directional 2DPCA method is utilized [11]. However in all the above techniques, the covariance matrix is determined first and then by suitable empirical thresholding the dominant eigenvectors of the covariance matrix representing the distribution of data in the training fabric images are determined. To know the distribution of data in the training fabric images, singular value decomposition (SVD) is used, which is likely to eliminate the necessity of determination of covariance matrix [18].
Applying SVD along the row and column of the training fabric sub images, two sets of eigenvectors are obtained, from where two sets of principal components are obtained. The minimum sub set of orthogonally transformed features i.e., the significant eigenvectors of covariance matrix are the principal components, the selection of which directly influences the success of the proposed method. The principal components, obtained from the row and column wise SVD operations of the training fabric sub images of a fabric class generate a reduced coefficient fabric space where both the training and test fabric sub images are projected for the detection of fabric defects. Many methods have been proposed [19, 20, 21] for the selection of principal components. Here most optimum principal components are selected by particle swarm method.
i. Determination of mean image of a fabric class
A training set of fabric sub images is created with few samples from healthy fabric images along with the possible types of defective fabric sub images. Let, pth gray scale training fabric sub image of a fabric class be denoted
as, fps (mn), such that 1 p P , where P is the total number of samples.
The mean of all the gray scale training fabric sub images of a fabric class may now be obtained as,
) (
1
1 P m n
p ps
f P
(1)As the mean image of a fabric class contains the general feature of that fabric class which all the training fabric images of that fabric class contain, so it does not play any role for detection of defects in that fabric class. Thus the
p th difference training fabric sub image of a fabric class is determined as,
) (
)
( ps m n
pd f
ii. Determination of two sets of principle components by applying SVD method
Applying SVD method on p th difference training fabric sub image of a fabric class, following equation is obtained,
T pd pd pd
pd U S V
f . . (3)
where, ( )
2
1 , ,..., ]
[ pd pd mpd m m
pd u u u
U is an orthogonal matrix consisting of the eigenvectors of
T pd pd f
f . and termed as the left singular vectors of fpd . Vpd [v1pd,v2pd,...,vnpd](nn)is another orthogonal matrix consisting of the eigenvectors of
pd T pd f
f . and termed as the right singular vectors of fpd .
) ( ,
2
1 , ..., ]
[ pd pd npd m n
pd
S is the suitably zero padded real pseudo diagonal matrix containing
singular values i.e., non zero square root of eigenvalues of
pd T pd f
f . and fpd .fpdT , such that
0 .
... 2
1pd pd npd
.
Any one of pd
U or Vpd may be considered for further processing. In this paper, Upd has been used. Thus from
pd
S and U pd , non zero square root of eigenvalues and eigenvectors of the covariance matrix fpd.fpdT are obtained without framing it. Here
pd
U gives the row wise distribution of data in fpd .
As it is required to retain the row wise information of distribution of data of all difference training fabric sub images of a fabric class, the sum left singular vectors are obtained by summing up the left singular vectors of all difference training fabric sub images of a fabric class. The sum left singular vectors for a fabric class
U
is obtained as,) ( 2 1 1 ] ,..., ,
[ m m m
P p pd u u u U U (4)
Corresponding to sum left singular vectors, the sum singular values S of the fabric class is obtained as,
) ( 2 1 1 ] ,..., ,
[ n m n
P p pd S S
(5)
where,
S
is suitably zero padded diagonal matrix, such that, 1 2...n 0.Thus for each fabric class, the proposed method eliminates the determination of covariance matrix for P
times which the 2 directional 2DPCA method requires at this stage for the determination of image covariance matrix [8, 11].
Though the sum left singular vectors of a fabric class give the row wise data distribution of the difference training fabric sub images of that fabric class, yet all columns i.e., the vectors of sum left singular vectors do not play the significant role regarding to the description of this data distribution. Thus now the task becomes to determine the significant vectors from sum left singular vectors of a fabric class which are known as the principal components of that fabric class. As corresponding to each sum left singular vector of a fabric class, a sum singular value exists, so to select the principal components the significant numbers of sum singular values of a fabric class are determined. However, to do this normalized sum singular values of the fabric class need to be determined. The i th normalized sum singular
value [22, 23] of a fabric class ( i )can now be determined as,
i
i
where,
is the mean of sum singular values of the fabric class,
is the standard deviation of sum singular values of the fabric class.Now the numbers of elements of normalized sum singular values of the fabric class which are greater than a definite positive number K1 are the numbers of principal componentsr , representing row wise data distribution of
the fabric class. At a later stage of this paper, the value of K1 is selected by particle swarm optimization technique. Thus the first set of principle components becomes,
) ( 2
1, ,..., ] [ r m r r u u u U (7)
This set of principle components represents the axes of a reduced dimensional fabric space, where all difference training and test fabric sub images will be projected, after reducing its coefficient.
For the reduction of the coefficient of the fabric space, it is required to determine another set of principle components describing the column wise distribution of data in all training fabric sub images of a fabric class.
Let the pth difference training fabric sub image of the fabric class is represented as,
] ...
[ pd1 pd2 pdn
pd f f f
f (8)
where (m1)
pdj
f is the
j
th column ofpd
f .
Applying SVD method on pdj
f the following equation can be obtained, T
V S U
fpdj pdj. pdj. pdj
(9)
where, ( )
2
1 , ,..., ]
[ pdj pdj mpdj m m
pdj u u u
U is an orthogonal matrix consisting of the eigenvectors of
T pdj pdj
f
f
.
and termed as the column wise left singular vector of pdjf . Vpdj (11) is the column wise right
singular vectors of pdj f . ) 1 ( m pdj
S is a real pseudo-diagonal matrix, whose first element 1pdj is non zero and representing the
positive singular value with all other elements are zero. Now arranging j pdj, 1
i.e., for all columns in descending
order and diagonally the following fabricated singular values of pth difference training fabric sub image is obtained.
f pd
S diag[1pd1,1pd2,...,1pdn](nn) (10)
As our target is to know the column wise data distribution of all the training fabric sub images of a fabric class, so the column wise sum left singular vectors are obtained by summing up
U
pdjfor all columns of all the differencetraining fabric sub images of a fabric class. The column wise sum left singular vectors
(
U
/)
for the fabric class is obtained as, ) ( / / 2 / 1 1 / [ , ,..., ] 1 m m m P p npdj u u u
j U U (11)
Corresponding to column wise sum left singular vectors the reconstructed sum singular values of the fabric
class
S
c can now be obtained as,) ( 2 1 1 ] ,..., ,
[ c c nc n n
P
p f pd
c S diag
S
where,
1c
2c ...
nc 0.In [11, 13] it has been found that for each fabric class 2 directional 2DPCA method requires the determination of covariance matrix for
n
.
P
times at this stage, which has completely been eliminated here.As all the columns i.e., vectors of column wise sum left singular vectors do not play the significant role regarding to the description of column wise data distribution of the training fabric sub images of the fabric class, so the corresponding principal components are required to be found out. To do so, the normalized reconstructed sum singular values of the fabric class are necessary. The ith normalized reconstructed sum singular value of the fabric class
c i
can now be determined as,c c c i c i
(13)
where,
c is the mean of reconstructed sum singular values of a fabric class, c
is the standard deviation of reconstructed sum singular values of the fabric class.
The numbers of elements of normalized reconstructed sum singular values of the fabric class which are greater than a definite positive number K2are the numbers of principal components cof the fabric class representing the
column wise data distribution of that same fabric class. The value of
K
2 is obtained later by PSO technique.Thus the second set of principle components representing the column wise data distribution of all the training fabric sub images of the fabric class becomes,
) ( / /
2 /
1, ,..., ]
[ c c
m c
u u
u
U (14)
These principal components describe the column wise data distribution of the training fabric sub images of the fabric class.
iii. Reduction of coefficients of the fabric space and development of modified fabric space
To reduce the coefficient of the reduced dimension fabric space, the coefficient matrix is determined for each training fabric sub image of a fabric class. The coefficient matrix of the
p
th difference training fabric sub image of the fabric class is obtained as,) ( )] , ( [ .
.f U x y r c
UrT pd c p
p
(15)
where, the x th row and
y
th column element of p is p(x,y).Physically with the help of the coefficient matrices the difference training fabric sub images of a fabric class are projected on a reduced coefficient fabric space, termed as the modified fabric space of that fabric class. This new fabric space now contains rc numbers of coefficients. Thus now each difference training fabric sub image of a fabric class is represented by rcnumbers of features. Since, r m and c n, the coefficient of modified fabric
space is reduced drastically. Thus the numbers of modified fabric spaces is equal to the numbers of fabric classes.
iv. Projection of test fabric sub images on the modified fabric space
Since the modified fabric space of the fabric class contains the information of the difference training fabric sub images of that fabric class, so for the defect detection, each test fabric sub image of the fabric class are also converted into the difference test fabric sub images in the following way,
) ( |
| ( test ) m n
d
test f
f (16)
where,
is the mean of the training fabric sub images of the fabric class, ftestd |and ftest |is the
thdifference test fabric sub image and
th test fabric sub image of the fabric class respectively, which are equal in size with the training fabric sub images.
varies from 1 to ((Mm)(Nn)), provided the size of test fabric image is) (MN .
|
d test
f is now projected on the respective modified fabric space through the following coefficient matrix,
) (
| . [ ( , )]
. testd c test r c
T r
test U f U x y
(17)
where, the x th row and
y
th column element of test
is test (x,y).
B. DETECTION OF FABRIC DEFECTS BY SUPPORT VECTOR MACHINE (SVM) CLASSIFIER
The test fabric sub images of a fabric class are classified in terms of defective and non defective ones by the support vector machine (SVM) classifier [24]. In general, SVM is a two class classifier, whose basic guideline is to find an optimal separating hyperplane, so as to separate two classes of patterns with maximal margin, such that the expected errors for the unknown test data is minimized. During the training phase of SVM the classification problem for the pth training fabric sub image belonging to a fabric class is defined as,
) ,
( q
C L
p
p (18)
Where, L (1 C. r)
p
is the lexicographically arranged coefficient matrix of pth training fabric sub image belonging to the fabric class having class outputq{1,1} . In this case the healthy training fabric sub image is associated with q1and defectiveq1.
The coefficient matrix of the test fabric sub images are also arranged in the lexicographical order for the classification in defective and non defective one by the trained SVM.
Once the defective test fabric sub image is detected the correlation coefficient data density matrix [25] gives the binarized image of defect only from the defective test fabric sub image.
C. SELECTION OF THRESHOLD VALUES K1 AND K2 FOR DETERMINATION OF TWO SETS OF
PRINCIPLE COMPONENTS BY USING THE PARTICLE SWARM OPTIMIZATION (PSO) TECHNIQUE For the development of modified fabric space of the fabric class, Ur and Uc are required to be optimally
truncated, to get suitable numbers of principal components. The optimal values are determined by using the particle swarm optimization (PSO) technique [26, 27].
Each particle in PSO has dimension equal to the parameters to be optimized. Each dimension is associated with randomized velocity, with which it moves in the search space. Each particle keeps track of its coordinate in the solution space on the basis of the best solution it has achieved so far, known as the personal best (pBest) and the best overall position of all the particles, known as the global best (gBest). The best solution refers to minimization/ maximization of a fitness or objective function for the minimization/ maximization problem. In each step the position and velocity of the particles are updated in accordance to pBest and gBest.
i. Selection of fitness function
E
r
c. ) .
(
. 2
1
(19)
where, 1,2 are the positive weight values, such that(12)1 [30] and E is the error for fabric defect detection of training fabric sub images of the fabric class. Thus here the objective becomes to reduce the fitness function.
ii. Up-gradation of position and velocity of the particles in swarm
Let for a fabric class, the numbers of particles in the swarm be Z. Since only 2 parameters need to be optimized, the dimension of each particle in the swarm is taken as 2.
Let at
t
th iteration the position vector of i th particle in the search space of the fabric class be, )] ( [ )] ( , ) ( [ )(t K,1t K,2t POS, t
POSi i i i j (20)
where, jvaries up to 2, Ki,1(t)and Ki,2(t) are the values of K1andK2 for
i
th particle att
th iteration ofparticle swarm. POSi(t) is the position vector of ith particle at
t
th iteration.The velocity vector of ith particle at
t
th iteration in the search space of the fabric class is given by,)] ( [ )] ( , ) ( [ )
(t v,1 t v,2 t v, t
vi i i ij (21)
where, vi,1(t),vi,2(t)are the velocity components of ith particle at
t
th iteration along two dimensions. The pBest of the ith particle att
th iteration in the search space of the fabric class is,)] ( [ )] ( , ) ( [ )
(t PB,1 t PB,2 t PB, t
PBi i i ij (22)
where, PBi,1(t),PBi,2(t) are the components of PBi(t) along two dimensions at
t
th iteration.For the first iteration each particle starts with the random values of position and velocity vectors which range within a specified maximum and minimum value. For the minimization of the fitness function the velocity of the i th particle is modified in the next iteration in the search space of the fabric class as [26, 27],
)]
(
)
(
[
)]
(
)
(
[
)
(
).
(
)
1
(
, , , 2 2 ,,
t
t
v
t
PB
t
POS
t
G
t
POS
t
v
ij
ij
i
i ij
i j
ij (23)and ] ) 1 ( , [ ) 1
(t vi j t
i
v (24)
where,
j
varies up to 2,G
(
t
)
is the global best tillt
th iteration for the fabric class,
1,
2 are the trustparameters for the fabric class and are usually set to 2 [26],
1,
2 are elements from two uniform random sequences in the interval [0, 1].The term
(
t
)
is the inertia weight of the particle att
th iteration for the fabric class. The inertia weightreduces linearly from
startto
endthroughout PSO generation [31, 32] and is given by,end end start iter t iter
t
max
max )( )
( )
( (25)
where,
iter
maxis the maximum number of iteration.The position of the i th particle of the fabric class is updated as, ) 1 ( ) ( ) 1
(t POS t v t
POSi i i (26)
Thus in each iteration each particle outputs different values of K1andK2 and the fitness function of each
particle changes at each iteration. Therefore, at (t1) th iteration the pBest of ith particle of the fabric class and gBest
is modified in the following way,
) ( )
1
(t POS t
arg ) 1 (t
G min ((PBi(t1)) ,i (28)
where, (PBi(t))is the fitness function of i th particle of the fabric class at
t
th iteration, while working withPBi(t) andargmin(.) is the minimum argument of the fitness function for all particles.When the number of iteration of PSO reaches to itermax, K1,K2 corresponding to global best (gBest) is selected as the optimum parameters for the fabric class.
C. REDUCTION OF DETECTION TIME FOR DEFECT ON TEST FABRIC IMAGE USING OPENCL:
For bigger test fabric image generation of overlapped test fabric sub images to detect defect takes huge time and thus makes the method impossible to implement in real field. To reduce this time complexity GPU can be used. But as functioning of GPU is managed by CPU, so a heterogeneous environment implemented through OpenCL coding is required. OpenCL includes kernels, the functions executing on OpenCL devices in parallel and application programming interfaces (APIs) or host, used to define and control the platforms and OpenCL devices. When a kernel is submitted for execution by the host, an index space is defined, where an instance of the kernel, called work- item, associated with a global ID is executed. Each work-item executes the same code in parallel on variable data and hence makes processing fast. However programming in OpenCL is more difficult than sequential programming [33].
In the present work the following kernel has been implemented,
__kernel void classify(__global int *in, __global int *out): for generating overlapped test fabric sub images and determining corresponding coefficient matrices. The numbers of work- items in this case are ((Mm)(Nn)) .
OpenCL algorithm for generating overlapped test fabric sub images and determining corresponding coefficient matrices is given below,
Kernel-1: Input: r
U and Uc, Test fabric image.
Output: Matrix consisting of Coefficient matrices for all test fabric sub images.
Considering the pixel coordinate of the test fabric image as the work- item, each processor in GPU selects a unique work item.
Coordinate of each work- item is determined.
A test fabric sub image of size ((am)(bn))is considered, assuming the coordinate of a work- item (a,b) . Corresponding coefficient matrix is determined by using equations (16) and (17).
Result of each coefficient matrix, arranged in lexicographical order is stored in a matrix to be used further by SVM for defect detection.
Host program:
Queries for OpenCL platform, OpenCL device, creates context for OpenCL, creates command queue for OpenCL device, creates buffer, creates program objects, builds the program for checking syntactical error, creates kernel object for running kernel and specifying arguments.
Test fabric image is read by using OpenCV.
Enqueues kernel-1, i.e., object of kernel-1 is placed in command queue for execution.
A buffer reading operation is enqueued in the command queue for storing the result in a matrix.
III. RESULTS AND DISCUSSIONS
For testing the proposed method, TILDA database [34] for fabric defects is used. Images of TILDA database are 8 bit grey and of size (768512)pixels. The method is tested on 4 fabric classes namely, fine, medium, semi-coarse and
coarse. A few images from each fabric class are shown in figure- 1.
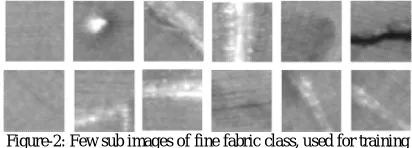
The training fabric sub images are taken of size(6464), so that even the smaller fabric defects become significant in the sub image and the background information is retained at the same time. A few of these training fabric sub images of fine fabric class are shown in figure 2.
Figure-2: Few sub images of fine fabric class, used for training
The numbers of training fabric sub images of fine, medium, semi-coarse and coarse fabric classes are 201, 174, 171 and 174 respectively, which contain both the healthy and defective samples. These training fabric sub images are used to develop the respective modified fabric spaces by using the proposed method. The method is tested on another 25, 25, 25, 37 defect-free and 195, 150, 107, 136 defective test fabric images of fine, medium, semi-coarse and coarse fabric classes respectively, containing 10 types of fabric defects.
For fabric defect detection tasks, the performance of the proposed system can further be defined in terms of the parameters, explained in Table 1.
Situations Actually defective
Actually
defect-free
Actual
Detection
Success
rate
TP FN TN FP TN TP (ADSR)
Detected as defective
True positive(TP)
False
positive(FP) or false alarm Detected
as defect-free
False negative(FN)
True negative(TN)
Table 1 Situations of occurrence of different results for a particular test
The test result along with the coefficients of the modified fabric space, obtained by the proposed method for the different fabric classes are given in tables 2.
Class of fabric → Fine Fabric Medium Fabric Semi-coarse fabric Coarse Fabric
Coefficient of modified fabric space
→ (6×5) (7×4) (12×11) (21×11)
Nt Nd Nt Nd Nt Nd Nt Nd
Oil mark/ spot 46 46 43 43 28 28 44 44
Snarls/ loops/ float thread 20 20 4 4 9 9 12 10
Small holes 17 17 19 19 9 9 9 7
Slub/ fly 43 43 57 56 28 27 15 13
Thick yarn/ reed mark/ crack 46 44 0 0 0 0 10 8
Thin places 4 2 2 2 7 6 0 0
knots 7 7 5 5 5 5 3 3
Broken pick 0 0 10 9 0 0 23 21
Short pick 7 7 10 8 0 0 20 18
Snag 5 5 0 0 21 21 0 0
The parameters obtained from test result are briefed in table-3.
Fabric class TP FP FN TN ADSR Overall ADSR
Fine 97.9% 4% 2.1% 96% 96.9%
96.125%
Medium 97.33% 0% 2.67% 100% 99%
Semi coarse 98.1% 4% 1.9% 96% 96.9%
Coarse 91.5% 8.1% 8.5% 91.5% 91.7%
Table-3: Parameters obtained from test result.
Detection of fabric defects for the same test fabric samples are also done by using conventional 2 directional 2D PCA method, where principal components are determined by empirical thresholding of eigenvectors of row and column wise covariance matrices, which are derived in the conventional way as in [11]. The sizes of fabric sub images are also(6464) in these cases. The test result is given in table-4.
Type of fabric Number of samples tested (defective + healthy)
False alarm ADSR Size of modified
fabric space
fine 195+25 88% 33%
(
4
4
)
medium 150+25 80% 30%
(
4
5
)
Semi coarse 107+25 72% 48%
(
8
5
)
coarse 136+37 95% 24.5%
(
10
9
)
Table-4: Test results of defect detection on fabric samples by conventional 2 directional 2DPCA method.
Thus overall ADSR for all of the above fabric classes becomes 34% by using the conventional 2 directional 2D PCA method.
While applying PSO, as more preference is given at the reduction of detection error than the reduction of coefficients of modified fabric space, so,
1
0
.
3
and
2
0
.
7
are selected. 10 particles and 100 iterations arechosen for PSO. The values of
start and
end required for the determination of inertia weight are taken as 0.4 and 0.9 respectively.A few of the test results of defect detection by the proposed method and after suitable thresholding are shown in Figure- 3.
Figure-3: Test results: Test fabric and binarized fabric showing the defects
fabric sub images and to project them on the modified fabric space. OpenCL algorithm is implemented in the heterogeneous computing environment consisting of INTEL i3 2.40 GHz CPU and NVIDIA GeForce GT 650T GPU. As OpenCL and OpenCV may be embedded in the same coding, so SVM is implemented in OpenCV. For comparison of the time complexity, sequential coding using C is also done for developing test fabric sub images from test fabric image along with its projection on modified fabric space. Figure- 4 shows the result of this comparison for different sizes of test fabric sub images.
Figure- 4: Comparison of time complexity between proposed OpenCL algorithm and sequential C coding.
IV. CONCLUSION
The proposed method is carried out by constructing a reduced coefficient modified fabric space. The modified space is derived by singular value decomposition based method and optimized by particle swarm technique. The proposed method bypasses the determination of covariance matrices. The method is capable of reducing the coefficients of modified fabric space from
(
64
64
)
to a satisfactory small value for a wide variety of fabric classes. The test result shows that the proposed method works well for different woven fabric classes. Comparatively poor result is obtained in case of coarse fabric class, where the hairiness and voids may sometimes look identical to the small fabric defects and hence becomes difficult for training. It has also been observed that the time complexity of the proposed method is reduced appreciably by using the novel OpenCL algorithm.
REFERENCES
1. H. Y. T. Ngan, G. K. H. Pang, and N.H.C. Yung, “Automated fabric defect detection – a review”, Image and Vision Computing, 29, 442- 458, 2011.
2. A. Kumar, “Computer vision based fabric defect detection: A survey”, IEEE Transaction on Industrial Electronics, 55(1), 348–360, 2008. 3. M. Unser, and F. Ade, “Feature extraction and decision procedure for automated inspection of textured materials,” Pattern Recognit. Lett., vol. 2,
pp. 181-191, 1984.
4. F. Ade, “Application of principal component analysis to the inspection of industrial goods”, Proc. SPIE, 397, pp. 216-223, 1983.
5. A. Monadjemi, M. Mirmedhi, and B. Thomas, “Reconstructed eigenfilter matching for novelty detection in random textures”, Proc. Of the 15 th British Machine Vision Conf., pp- 637- 646, 2004.
6. F. Ade, “Characterization of texture by ‘eigenfilter’”, Signal Processing, 5(5):451–457, 1983.
7. M. Varma, and A. Zisserman, “Texture classification: Are filter banks necessary?”, In: CVPR, pp- 691- 698, 2003.
8. J. Yang, D. Zhang, A. F. Frangi, and J. Y. Yang, “Two dimensional PCA: a new approach to appearance based face representation and recognition”, IEEE Trans. On Pattern Analysis and Machine Intelligence, vol. 26, no. 1, pp- 131- 137, 2004
9. A. Srikaew, K. Attakitmongcol, P. Kumsawat, and W. Kidsang, “Detection of defect in textile fabrics using optimal Gabor wavelet network and two dimensional PCA”, L.N.C.S., Advances in visual computing, vol 6939, pp- 436- 445, 2011
10. L. W. Wang, X. wang, M. Chang, and J. F. Feng, “Is two dimensional PCA a new technique?”, ACTA Automatica Sinica, vol 31, no 5, 2005.
11. D. Zhang, and Z. H. Zhou,“
(
2
D
)
2PCA: Two- directional two dimensional PCA for efficient face representation and recognition” , Neural Networks in Signal Processing, Elsevier, Vol.- 69, Issues- 1-3, pp- 224- 231, 2005.12. N. Nguyen, W. Liu, and S. Venkates, “Random subspace two dimensional PCA for face recognition”, L.N.C.S, vol 4810, Advances in Multimedia Information Processing- PCM, pp- 655- 664, 2007.
15. A. Kumar, “Neural network based detection of local textile defects”, Pattern Recognition, vol. 36, pp. 1645-1659, 2003.
16. J. Bowden, “OpenCL implementation of principal component analysis for large scale data analysis and benchmarking of heterogeneous clusters”, eResearch conference, Australia, 2011.
17. L. Malagon-Borja, and O. Fuentes, “Object detection using image reconstruction with PCA”, Image and Vision Computing, Elsevier, Vo.- 27, No 1- 2, pp.2- 9, 2009.
18. R. D. Phillips, L. T. Watson, R. H. Wynne, and C. E. Blinn, “Feature reduction using a singular value decomposition for the iterative guided spectral class rejection hybrid classifier”, ISPRS Journal of Photogrammetry and Remote Sensing, Elsevier, vol- 64, Issue- 1, pp- 107- 116, 2009. 19. I. T. Jollife, “A note on the use of principle components”, Wiley & Sons, New York, 1991.
20. N. C. Oza, and K. Tumer, “Dimensionality Reduction Through Classifier Ensambles”, Technical Report NASA- ARC- IC- 1999- 124, Computational Sciences Division, NASA Ames Research Center, Moffett Field, CA, 1999
21. G. Saporta, “Some simple rules for interpreting outputs of principle components and correspondence analysis”, In: Bacelar- Nicolau H., Nicolau F.C., Janssen J. (eds): Proceedings of ASMDA- 99, University of Lisbon, 1999.
22. Chi-Jie Lu, and D._Ming Tsai, “Defecet detection of patterned TFT- LCD panels using fast sub image based SVD”, Proc. Of fifth Asia- Pacific Industrial Engineering and Management Systems Conference, 2004.
23. J. K. Chandra, and A. K Datta, “Detection of defects in fabrics using sub- image based singular value decomposition”, Journal of Textile Institute, pp- 1- 10, 2012.
24. C. Cortes and V. Vapnik, “Support Vector Networks”, Machine Learning, Vol 20, pp 273-297, 1995.
25. Jayanta K. Chandra, Pradipta K. Banerjee, Asit K. Datta, “Neural Network Trained Morphological Processing for the Detection of Defects in Woven Fabric”, The Journal of the Textile Institute, Taylor and Francis, vol.- 101, no.- 8, pp- 699- 706, 2009.
26. R. C. Eberhart, and J. Kenedy, “A new optimizer using particle swarm optimization”, in Proc. 6th International Symp. Micromachine Human Sci., Nagoya, Japan, pp- 39- 43, 1995.
27. J. Kenedy, and R. C. Eberhart, “Particle swarm optimization”, in Proc. IEEE Int. Conf. Neural Networks, Vol.- 4, pp-1942- 1948, 1995. 28. M. Zhongkun Guy and A. E. Vandenbosch, “Comparison of weighted sum fitness functions for PSO Optimization of Wideband Medium- gain
Antennas”, Radioengineering, Vol.- 21, No.- 1, pp- 504- 511, 2012.
29. Y. del Valle, G. K. enayagamoorthy, S. Mohagheghi, J. C. Hernandez, and R. G. Harley, “Particle Swarm Optimization: Basic Concepts, Variants and Applications in Power Systems”, IEEE Trans. On Evolutionary Computation, Vol.- 12, No.- 2, pp- 171- 195, 2008.
30. A. D. Klamargias, K. E. Parsopoulos, P. D. Alevizos, and M. N. Vrahatis, “Particle filtering with particle swarm optimization in systems with multiplicative noise”, Proc. 10 th Annual Conf. on genetic and evolutionary computation, GECCO, 08, pp- 57- 62, Atlanta, USA, 2008. 31. R. C. Eberhart, and Y.Shi, “Comparing inertia weights and constriction factors in particle swarm optimization”, in Proc. Cong. Evol. Comp.,
pp-84- 89, 2000.
32. A. Chatterjee, and P. Siarry, “Nonlinear inertia weight variation for dynamic adaptaion in particle swarm optimization”, Computer and Operations Research, Vol.- 33, pp- 859- 871, 2006.
33. B. Barney, “Introduction to Parallel Computing”, Lawrence Livermore National Laboratory, 2012.