HIGHLIGHTED ARTICLE
| INVESTIGATION
Examining the Impact of Imputation Errors on
Fine-Mapping Using DNA Methylation QTL as a
Model Trait
V. Kartik Chundru,*,1Riccardo E. Marioni,†,‡James G. D. Prendergast,§Costanza L. Vallerga,* Tian Lin,* Allan J. Beveridge,** SGPD Consortium,2Jacob Gratten,*,††David A. Hume,††Ian J. Deary,†Naomi R. Wray,*,‡‡ Peter M. Visscher,*,‡‡ and Allan F. McRae *Institute for Molecular Bioscience and‡‡Queensland Brain Institute, The University of Queensland, Brisbane, Queensland 4072, Australia,†Centre for Cognitive Ageing and Cognitive Epidemiology, Department of Psychology, University of Edinburgh, EH8 9JZ, United Kingdom,‡Centre for Genomic and Experimental Medicine, Institute of Genetics and Molecular Medicine, University of Edinburgh, Edinburgh, EH4 2XU, UK,§The Roslin Institute, University of Edinburgh, Midlothian EH25 9RG, United Kingdom, **Glasgow Polyomics, Wolfson Wohl Cancer Research Centre, University of Glasgow, Bearsden G61 1QH, United Kingdom, and ††Mater Research Institute, The University of Queensland, Brisbane, Queensland 4102, Australia
ORCID IDs: 0002-6348-5565 (V.K.C.); 0003-4430-4260 (R.E.M.); 0001-8916-018X (J.G.P.); 0001-9493-6800 (C.L.V.); 0000-0003-1293-409X (J.G.); 0000-0002-2615-1478 (D.A.H.); 0000-0002-1733-263X (I.J.D.); 0000-0001-7421-3357 (N.R.W.); 0000-0002-2143-8760 (P.M.V.); 0000-0001-5286-5485 (A.F.M.)
ABSTRACTGenetic variants disrupting DNA methylation at CpG dinucleotides (CpG-SNP) provide a set of known causal variants to serve as models to test fine-mapping methodology. We use 1716 CpG-SNPs to test three fine-mapping approaches (Bayesian imputation-based association mapping, Bayesian sparse linear mixed model, and the J-test), assessing the impact of imputation errors and the choice of reference panel by using both whole-genome sequence (WGS), and genotype array data on the same individuals (n= 1166). The choice of imputation reference panel had a strong effect on imputation accuracy, with the 1000 Genomes Project Phase 3 (1000G) reference panel (n = 2504 from 26 populations) giving a mean nonreference discordance rate between imputed and sequenced genotypes of 3.2% compared to 1.6% when using the Haplotype Reference Consortium (HRC) reference panel (n = 32,470 Europeans). These imputation errors had an impact on whether the CpG-SNP was included in the 95% credible set, with a difference of23% and7% between the WGS and the 1000G and HRC imputed datasets, respectively. All of thefine-mapping methods failed to reach the expected 95% coverage of the CpG-SNP. This is attributed to secondarycisgenetic effects that are unable to be statistically separated from the CpG-SNP, and through a masking mechanism where the effect of the methylation disrupting allele at the CpG-SNP is hidden by the effect of a nearby SNP that has strong linkage disequilibrium with the CpG-SNP. The reduced accuracy infine-mapping a known causal variant in a low-level biological trait with imputed genetic data has implications for the study of higher-order complex traits and disease.
KEYWORDSfine-mapping; DNA-methylation; imputation; CpG-SNPs
T
HERE have been a variety of methods proposed forfi ne-mapping variants discovered in genome-wide association studies (GWAS), with the aim of statistically determining the causal genetic variant, or creating a minimal set of SNPs that contain the causal variant with a high confidence (e.g., Servin and Stephens 2007; Morris 2011; Hormozdiari et al.2014; Kichaev et al. 2014; Chen et al. 2015; Benner et al. 2016; Brownet al.2017; Huanget al.2017). One strong assumption common to all fine-mapping methods is that all possible causal variants are present in the data (Spain and Barrett 2015). This assumption is not satisfied in most studies that Copyright © 2019 Chundruet al.doi:https://doi.org/10.1534/genetics.118.301861
Manuscript received March 28, 2019; accepted for publication April 21, 2019; published Early Online April 30, 2019.
Available freely online through the author-supported open access option.
This is an open-access article distributed under the terms of the Creative Commons Attribution 4.0 International License (http://creativecommons.org/licenses/by/4.0/), which permits unrestricted use, distribution, and reproduction in any medium, provided the original work is properly cited.
Supplemental material available at Figshare: https://doi.org/10.25386/genetics. 7906109.
1Corresponding author: Institute for Molecular Bioscience, The University of Queensland, 306 Carmody Rd., Brisbane, QLD 4072, Australia. E-mail: v.chundru@uq. edu.au
use genotypes generated by arrays followed by imputation. While imputation methods with the appropriate choice of reference panel are very accurate for common variants (Mitt et al. 2017), imputation errors will still exist and can affect the relative probability of SNPs being determined as causal byfine-mapping methods.
Because of the small number of known causal variants, comparisons offine-mapping methods need to be performed through simulation, and are often idealized and do not en-compass the full range of experimental variation. However, high-throughput measurement of DNA methylation across the genome provides a potential model trait for testing fi ne-mapping methods. DNA methylation is an epigenetic modifi -cation that is influenced by both genetic and environmental factors, with an average heritability of 20% (McRae et al.
2014). DNA methylation in humans occurs primarily at CpG dinucleotides, and removal of the CpG sequence through single nucleotide polymorphisms (CpG-SNPs) di-rectly alters DNA methylation at this site (Hellman and Chess 2010; Meaburnet al.2010; Shoemakeret al.2010; Fanget al.
2012; Zhi et al.2013). For example, at a CpG locus in a population with a variant with allele frequency of 50% at the C or G, half of the population will have a CpG-site that can be methylated and the other half will not have a CpG site, as the C or G will be substituted with another nucleotide base, and this locus will not be not methylated. Thus DNA methyl-ation at a site with a CpG-SNP provides a trait with a known causal variant of large effect and can be used as a model trait to testfine-mapping. Furthermore, there are large numbers of such sites throughout the genome, and the genetic regu-lation of methyregu-lation by such SNPs have been implicated in disease risk (Dayehet al.2013; Zhouet al.2015; Chenet al.
2016).
In this study, we compare three fine-mapping methods, covering a variety of approaches, Bayesian imputation-based association mapping (BIMBAM) (Servin and Stephens 2007), Bayesian sparse linear mixed model (BSLMM) (Zhouet al.
2013), and the J-test (Davidson and MacKinnon 1981), using individual-level SNP data, and DNA methylation at CpG-SNPs as a model trait. We compare 95% credible sets of causal variants for each method, and directly contrast the use of whole-genome sequencing data and imputed genotyp-ing array data, includgenotyp-ing the choice of imputation reference panel.
Materials and Methods
Datasets
Lothian birth cohort:The Lothian birth cohorts of 1921 and 1936 (LBC) (Deary et al. 2004, 2007, 2012; Taylor et al.
2018) are both part of a longitudinal study on cognitive ag-ing. Participants were all born in 1921 or 1936, and com-pleted a cognitive ability test as part of the Scottish Mental Survey 1932 (Bartlett 1934) or Scottish Mental Survey 1947 (Ensor 1950), respectively. DNA methylation was measured
in 1366 study participants using the Illumina HumanMethy-lation450 BeadChips as described in Shah et al. (2014), McRae et al. (2018). The mean (SD) age of participants was 79.1 (0.6) from the 1921 cohort, and 69.6 (0.8) from the 1936 cohort. Out of the .400,000 probes remaining after quality control (QC), 22,000 have an SNP at the CpG site (CpG-SNP) and a significant methylation QTL (mQTL), with the CpG-SNP being genome-wide significant ðPCpG‐SNP,1310210Þ (McRae et al. 2018). A set of
1716 sites with a CpG-SNP with a minor allele frequency (MAF).0.1 were chosen to make sure we have sufficient power tofine-map the causal variant.
From the LBC, 1370 individuals were whole-genome se-quenced on a HiSeq X installation to an average coverage of 363 (minimum 19.63, maximum 65.93). All reads were mapped to the build 38 version of the reference genome using BWA (Li and Durbin 2009) and variants called using GATK (DePristoet al.2011) according to its recommended best practices. Variants were annotated using variant effect predictor and gene models from the version 85 release of Ensembl (McLarenet al.2016).
The whole-genome sequence data were compared to array data for the same individuals using PLINK 1.90 (Changet al.
2015). Standard checks for relatedness, heterozygosity, du-plication, and sex were also performed. In total, 12 samples were removed from the original 1370 because of failing one or more of these tests. The data were thenfiltered to include variants that were considered to PASS according to VQSR, had only two alleles, a maximum missingness of 10%, and a minimum genotyping quality of 40.
The imputed datasets were genotyped on the Illumina 610-Quad BeadChip arrays. The data were filtered to remove individuals with high missing rate (.5%), the SNPs with high missing rate (.5%), SNPs with Hardy–Weinberg exact test P,131026, and SNPs with low MAF (,0.01). We imputed the cleaned data using the 1000 Genomes Project Phase 3 (The 1000 Genomes Project Consortium
et al. 2015), and the Haplotype Reference Consortium
(HRC) reference panels, prephasing the data using EAGLE, and imputing using PBWT on the Sanger imputation server (Durbin 2014; Lohet al.2016; The Haplotype Reference Consortium 2016). The imputed SNPs were filtered again for MAF, deviations from Hardy-Weinberg equilib-rium, and a low imputation info score ðinfo,0:8Þ. The chosen info score threshold is quite stringent to prevent low-confidence imputed SNPs having an effect on the fine-mapping analyses. To fairly compare the datasets we use the intersection of the three (n¼1166,m6,300,000 SNPs).
Probes with low detection rate (,95% atP,0.01), and low-quality samples were removed. Individuals with low call rate (,450,000 probes detected at P , 0.01) were removed. Probes on the X and Y chromosomes were removed, leaving 450,726 probes remaining. b Values were corrected for BeadChip, sample plate, hybridization date, white blood cell count, and sex.
UK10K: We used the UK10K dataset [European
Genome-phenome Archive (EGA) accession numbers: EGAS00001000108 and EGAS00001000090] for the simulations (see Supplemen-tal Material, File S1). The UK10K dataset (UK10K Consortium
et al. 2015) comprises the whole-genome sequencing of
3781 European individuals from the United Kingdom. The dataset has a total of8,000,000 SNPs after QC (excluding SNPs with Hardy–Weinberg exact testP,131026, MAF, 0.01, and SNPs with.10% missing data).
Systems Genomics of Parkinson’s Disease cohort:The Sys-tems Genomics of Parkinson’s Disease (SGPD) cohort com-prises 956 individuals with Parkinson’s disease, and 930 controls genotyped on the Illumina PsychArray-B.bpm. In our analyses we did not take disease status into account. The data werefiltered to remove individuals with high miss-ing rate, the SNPs with high missmiss-ing rate (.5%), SNPs with Hardy–Weinberg exact testP,131025, and SNPs with low MAF (,0.01). The imputation was performed using the Sanger imputation server (The Haplotype Reference Consor-tium 2016) and was imputed using the HRC reference panel (The Haplotype Reference Consortium 2016). The imputed SNPs were filtered again for MAF, deviations from Hardy-Weinberg equilibrium, and a low imputation info score
ðinfo,0:3Þ.
The DNA methylation data were measured using the Illu-mina HumanMethylation450 BeadChip array. Raw intensity data were background-corrected and normalized using in-ternal controls, and methylation b values were generated using the R meffil package (Minet al.2018). Probes of low quality, and low detection rate were removed (,95% atP,
0.01). The R meffil package was also used to perform sample QC using Illumina recommended thresholds. Samples were dropped if call rate was low (,450,000 probes detected at
P,0.001), if predicted sex (based on XY probes) did not match reported sex, and if predicted median methylated sig-nal was.3 SD from the expected. After these QC steps, meth-ylation b values were quantile-normalized with respect to 20 principal components generated from the control matrix and the most variable probes. Additionally, normalization was adjusted for batch, slide, cohort, sentrix row/column, sex, and age. Of the 1716 probes in the LBC dataset, only 1678 remained after cleaning, thus the replication was only conducted on the respective probes.
Simulating phenotypes: Phenotypes similar to DNA meth-ylation at CpG-SNPs were simulated using the GCTA software (Yang et al. 2011). GCTA uses a simple additive genetic model to simulate the phenotypes given the causal variants,
with effect sizes drawn form a normal distribution Nð0;1Þ. In the case of a single causal variant, the narrow sense herita-bility is equivalent to the variance explained by the causal variant. We simulated three phenotypes, withh2¼0.2, 0.1, and 0.05, each with 1000 replicates using two sample sizes, the full UK10K dataset (n= 3781), and a subset of the UK10K dataset to match the sample size in the imputed LBC dataset (n= 1366). The causal variants were chosen at random from the genome, but restricted to have MAF.0.05.
Fine-mapping methods: To compare the performance of
fine-mapping methods, a 95% credible set is constructed for each method, the minimum set of SNPs which will contain the causal SNP 95% of the time. Although the credible set is a Bayesian concept, we can also use a 95% confidence set for Frequentest approach (J-test) because we use the coverage of the causal variant in the sets as a measure offine-mapping accuracy. Both sets are designed so that 95% of the time the causal variant will be captured. For simplicity we will refer to both sets as credible sets.
The J-test (Davidson and MacKinnon 1981) is a simple regression method to test non-nested hypotheses. The method is as follows:
1. Rank the SNPs by strength of association, and add the most associated SNP to the credible set;
2. Regress the most associated SNP against the phenotype
y¼m1þX1b1þe1;
3. Starting at N= 2, regress theNth best SNP against the phenotype with the fitted values from the regression in step 2 as a covariate:
y¼mNþXNbNþlNX1cbc1þeN;
4. IflNis not significant, we add the SNP to the credible set,
incrementN, and repeat step 3. IflNis significant, we stop
here;
whereyis the phenotype,Xiis the genotype of SNPi, andlN
is the regression coefficient for thefitted values from the re-gression from step 1. This method tests if the best SNP ex-plains a statistically significant amount of the phenotypic variance more than theNth best SNP. To construct a 95% credible set of causal variants, a set of SNPs with 95% prob-ability to contain the causal variant, a Bonferroni-corrected significance of P
N21 was used. To remove redundant tests, only one SNP was tested of SNPs in complete linkage disequi-librium (LD), all SNPs in complete LD that were removed were subsequently added to the credible set if applicable.
BIMBAM (Servin and Stephens 2007), which uses a Bayesian regression approach to find genetic associations, calculates a Bayes factor for each SNP. This is the likelihood of the SNP being causal divided by the likelihood that no SNP in the region is causal. Maller et al. (2012) showed that, assuming a single causal variant, the posterior probability of association (PPA) can be written as PPAi¼PBFi
jBFj
method is used to compute the credible sets, repeatedly tak-ing the next highest associated SNP until a combined poste-rior probability of association of 95% is reached.
BSLMM (Zhouet al.2013), a mixed-model method,fits SNPs into a mixture of two distributions using a sparsity-in-ducing prior. BSLMM uses a Markov chain Monte Carlo ap-proach, which is used directly, counting the top associated variant in every 10th iteration, to account for any correlation between iterations. Under the assumption of a single casual variant, the SNP with the largest effect in each iteration is the predicted causal variant. By counting the number of times each SNP is predicted to be the causal variant, the 95% cred-ible set is created by iteratively adding SNPs, in order of most number of counts, until 95% of the total number of iterations
is reached
PN
1counti
P
icounti
$0:95. In the case of SNPs in complete
LD, all SNPs were counted at each iteration.
Many recentfine-mapping methods focus on using sum-mary-level data (Morris 2011; Hormozdiariet al.2014; Chen
et al.2015; Benneret al.2016), we attempted to use some of these methods, but FineMap (Benneret al.2016) is unable to handle large effect size traits and CAVIAR (Hormozdiariet al.
2014; Chenet al.2015) also ran into computational problems with the large effect size. However, the CAVIAR model is equivalent to the BIMBAM model, as shown in Chenet al.
(2015), so the comparison is not needed. Other recentfi ne-mapping methods have focused on integrating functional
annotation data to gain extra power (Kichaev et al. 2014; Hormozdiari et al.2016), but these functional annotations are highly correlated with DNA methylation so will not be applicable in this case.
Conditional analysis: To check for multiple independent variants affecting the DNA methylation levels two conditional analyses were performed, a conditional and joint (CoJo) method (Yanget al.2012), and a forward selection.
For the forward selection approach, a multiple linear re-gression can be performed with the top SNP as a covariate,
y¼mþX2cbþX
c
Xclþe;
wherecis the number of SNPs being conditioned on,yis the methylation level,X2cis theN3M2cgenotype matrix of all
SNPs except the conditioned SNPs, theXcare theN31
ge-notype matrices of the SNPs being conditioned on,m,b, andl are regression coefficients, and e is the error term. If the association is no longer significantðP,531028Þwhen con-ditioned on the top SNP, then there is only one independent effect, otherwise there are more than one independent vari-ants affecting the DNA methylation in the QTL. We continue to condition on the top SNP from the previous conditional analysis until all the significant associations are removed.
selection step, using a multiple regression conditioning on the chosen SNP. This is followed by a backward selection step by fitting the chosen SNPs in a joint model, and re-moving any SNPs not significantly associated. The forward and backward selection steps are repeated until no new SNPs are added or removed from the chosen set of SNPs. Between each step the chosen SNPs are checked for multi-collinearity (Yanget al.2012).
Data availability
The LBC methylation data are available at EGA under acces-sion number EGAS00001000910. The LBC1921 and LBC36 genotype data are available on request for relevant research purposes (https://www.lothianbirthcohort.ed.ac.uk/content/ collaboration). The UK10K dataset is available from EGA (acces-sion numbers: EGAS00001000108 and EGAS00001000090). The source code used to run the threefine-mapping methods is available on GitHub (https://github.com/chundruv/
finemapping_GENETICS2019). Details of the simulation re-sults, the discordance between sequence and genotyped data, and the SGPD consortium member list is provided in File S1. Supplemental material available at Figshare:https:// doi.org/10.25386/genetics.7906109.
Results
Comparison offine-mapping approaches
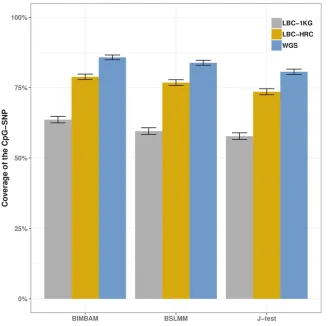
We compare 95% credible sets (the minimum set of SNPs with 95% probability of containing the causal variant) obtained from threefine-mapping approaches using DNA mQTL at a CpG-SNP in the 1166 individuals from the LBC (Dearyet al.
2004, 2007, 2012; Tayloret al.2018). The performance of thefine-mapping methods is measured by the coverage of the CpG-SNP, which is the proportion of replicates for which the CpG-SNP, the putative causal variant, is present in the 95% credible set. Each fine-mapping approach was applied to both whole-genome sequence data and genotype data from Illumina 610-Quad BeadChip arrays imputed to the 1000 Genomes Project Phase 3 (The 1000 Genomes Project Consortiumet al.2015) (LBC-1KG) (n= 2504 from 26 pop-ulations) and the HRC (The Haplotype Reference Consortium 2016) (LBC-HRC) (n= 32,470 Europeans) reference panels (seeMaterials and Methods). Fine-mapping was performed at 1716 DNA methylation sites previously identified to have a
heritability of 0.86, estimated from a sample of twins and their parents (McRae et al.2014), consistent with a major genetic locus underlying their variation (Figure S1).
Under the assumption that the CpG-SNP is causal for the variation in DNA methylation at each site, we measured the performance of the three fine-mapping approaches as the proportion of 95% credible sets of SNPs that included the CpG-SNP (or the method’s coverage), as well as the num-ber of SNPs within each credible set. BIMBAM performed marginally better than both BSLMM and the J-test in terms of coverage of the CpG-SNP, with the trade-off of larger cred-ible sets (Table S1). In the 672 cases where the CpG-SNP was not the most associated SNP (top SNP), the top SNP in the
credible sets had a median distance of 2 kb to the CpG-SNP, with 95% of SNPs being within 34 kb. (Figure S2). While performing well on simulated data (see File S1), all three methods failed to reach the expected 95% coverage of the putatively causal CpG-SNP (Figure 1) using either the whole-genome sequence or imputed datasets.
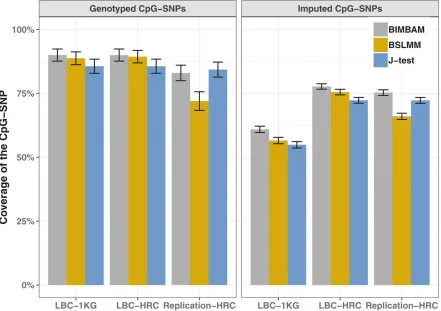
using the 1000 Genomes Project Phase 3 reference, and between 8 and 19% more often using the HRC reference dataset, with this being driven by differences in imputation accuracy (see File S1). The difference between imputedvs.
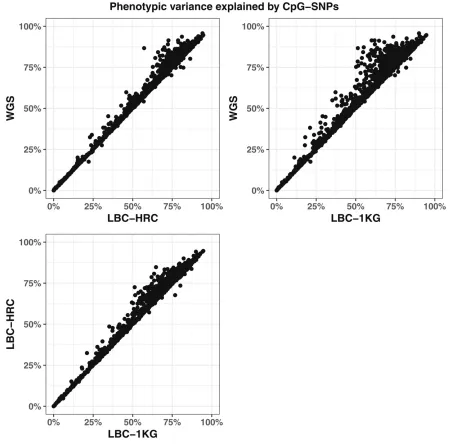
genotyped SNPs and overall coverage of 95% credible sets was replicated in an independent dataset of 1886 individu-als imputed using the HRC reference panel (Figure 2). The effect of imputation accuracy can also be seen in the phe-notypic variance explained by the CpG-SNPs, which is on average higher in the whole-genome sequence dataset than in both the imputed datasets, and the LBC-HRC dataset captures more of the variance than the LBC-1KG dataset (Figure 3).
Multiple causal variants at DNA methylation cis-QTL
The underlying assumption of our comparison of fi ne-map-ping is the presence of a single causal variant underlying the
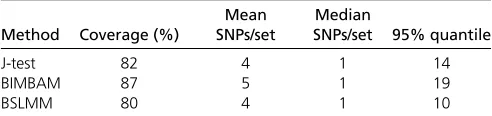
cis-mQTL, with this being implicitly assumed in the construc-tion of the 95% credible set for each of the methods. We performed two analyses to identify mQTL under the infl u-ence of multiple genetic variants: a standard forward selec-tion approach and the CoJo stepwise selecselec-tion model implemented in GCTA-CoJo (Figure S3). Only one inde-pendent signal was detected by both methods for 87% of the mQTL. However, when considering only those mQTL showing a single independent association for both meth-ods, we see that the coverage is still below the expected 95% (Table 1).
For the mQTL with one independent association from the conditional analyses, and where the CpG-SNP was not the top SNP, we estimated LD between the top SNP and CpG-SNP. In all cases, the LD between the top SNP and CpG-SNP pairs had a D’ of close to 1, indicating one of the four possible haplotypes between the top SNP and CpG-SNP is not present in our dataset or is very rare. In contrast, the R2 measure was highly variable in the cases where the CpG-SNP was not included in the 95% credible set, but close to 1 when it was included (Figure S4). The highD’and lowR2values when the CpG-SNP is not included in the 95% credible interval are consistent with an allele frequency difference between the CpG-SNP and top SNP. In fact, for the cases where the CpG-SNP was not included in the credible set, we observed that one allele of the top SNP captured all the methylation disruption of the CpG-SNP
allele as well as several other individuals with low methyl-ation (Figure 4). As such, the top SNP was effectively mask-ing the effect of the CpG-SNP on DNA methylation at these probes.
Discussion
To capture genuine biological complexity while assessing the performance offine-mapping methodology, we examined the use of known genetic variation within DNA methylation CpG sites as a model trait. This identified limitations infi ne-map-ping with imputed sequence data and in statistically separat-ing effects of closely linked variants.
Statistically minimizing the set of potential causal variants underlying the thousands of identified GWAS hits is essential for efficient experimental follow-up. However, we also need to ensure statistically derived sets of potential causal variants actually contain the underlying causal variant. While fi ne-mapping methods implicitly assume all potential causal var-iants are available, GWAS generally use imputed genotypes because of large sample size requirements and the relative cost of genotyping arraysvs.sequencing. We have shown a dramatic reduction in the proportion of credible sets that actually contain the underlying causal variant when using imputed genotype data, particularly when using the 1000 Ge-nomes Project Phase 3 reference panel for imputation. This imputation panel is still widely used, especially for GWAS meta-analysis combining populations with differing ances-try. In comparison, the more extensive HRC reference panel showed a great reduction in imputed genotype error rates, resulting in increased coverage of the causal variant. This highlights the need to continue the generation of large im-putation reference panels across multiple ancestries. The HRC reference panel is 6.5 times larger than the African Genome Resource, which is currently by far the largest non-European imputation reference panel.
Although common CpG-SNPs will have a very large effect on the DNA methylation, we were unable to reach the expected 95% coverage of the putatively causal CpG-SNP in our credible sets even when using whole-genome sequenced genotypes. We detected multiple statistically independent genetic associations in the cisregion surrounding the CpG site for 11% of probes. It is likely that a much higher pro-portion of probes would be identified as having multiple ge-netic effects with a greater sample size. In addition, we identified SNPs that effectively masked the effect of the CpG-SNP; these variants had an effect on the methylation levels, and the methylation disrupting allele of these variants were in high LDD’with the methylation disrupting allele of the CpG-SNP, but at a higher allele frequency, meaning that they masked the effect of the CpG-SNP and explained more of the variance in methylation levels. This is potentially caused by SNPs having a regional effect on DNA methylation; how-ever, arrays do not provide the detailed measures of DNA methylation across a region needed to investigate this further.
Table 1 The coverage of the CpG-SNP and the size of the credible sets for the probes with a single independent association detected from the both conditional analyses (87% of all probes), using the whole-genome sequence dataset
Method Coverage (%)
Mean SNPs/set
Median
SNPs/set 95% quantile
J-test 82 4 1 14
BIMBAM 87 5 1 19
BSLMM 80 4 1 10
The difficulties infine-mapping a known causal variant in a low-level biological trait have implications for the study of higher-order complex traits and disease. For example, Huang
et al.(2017)fine-mapped 18 inflammatory bowel disease loci to apparent single-variant resolution. However, their geno-type data were based on imputation to the 1000 Genomes Project reference panel, which resulted in.36% of the cred-ible sets in our study not containing the causal variant when compared to whole-genome sequencing. The role of imputa-tion error in the accuracy offine-mapping also has implica-tions for rarer causal variants. The imputation accuracy for
rare variants is much lower than common variants (Mittet al.
2017), implyingfine-mapping of rare causal variants will be less accurate than their common counterparts. In addition, fine-mapping approaches that integrate additional epigenetic annotations need to be treated with care. While we could not use such approaches in our study (due to the circular nature of the analysis if applied to mapping DNA mQTL), our results demonstrate that our knowledge of which genetic variants disrupt these epigenetic marks is incomplete. These limita-tions in statisticalfine-mapping need to be recognized when designing functional experiments.
Acknowledgments
We thank Allison Miller for the processing and handling of NZBRI samples. Phenotype collection in the Lothian Birth Cohort 1921 was supported by the UKs Biotechnology and Biological Sciences Research Council (BBSRC), The Royal Society, and The Chief Scientist Office of the Scottish Government. Phenotype collection in the Lothian Birth Cohort 1936 was supported by Age UK (The Disconnected Mind project) and the Medical Research Council (grant MR/ M01311/1). Methylation typing was supported by the Centre for Cognitive Ageing and Cognitive Epidemiology (Pilot Fund award), Age UK, The Wellcome Trust Institu-tional Strategic Support Fund, The University of Edinburgh, and The University of Queensland. This work was conducted in the Centre for Cognitive Ageing and Cognitive Epidemi-ology, which is supported by the Medical Research Council and Biotechnology and Biological Sciences Research Council (grant MR/K026992/1), and which supports I.J.D. This research was supported by Australian National Health and Medical Research Council (NHMRC; grants 1010374 and 1113400) and by the Australian Research Council (ARC; grant DP160102400). P.M.V., N.R.W., and A.F.M. are supported by the NHMRC Fellowship Scheme (grants 1078037, 1078901, and 1083656). The Systems Genomics of Parkinson’s Disease contribution was supported by the ARC (grant DP160102400) and the NHMRC (grants 1078037, 1078901, 1103418, 1107258, 1127440, and 1113400). Support also came from ForeFront, a large col-laborative research group dedicated to the study of neuro-degenerative diseases and funded by the NHMRC (program grant 1132524, Dementia Research Team grant 1095127, NeuroSleep Centre of Research Excellence grant 1060992) and ARC (Centre of Excellence in Cognition and its Disor-ders Memory Program grant CE10001021). Simon Lewis was supported by an NHMRC-ARC Dementia Fellowship (1110414) and Glenda Halliday was supported by an NHMRC Fellowship (1079679). The Queensland Parkin-son’s Project was supported by a grant from the NHMRC (grant 1084560) to George Mellick. The New Zealand Brain Research Institute (NZBRI) cohort was funded by a Univer-sity of Otago research grant, together withfinancial support from the Jim and Mary Carney Charitable Trust (Whangarei, New Zealand).
Literature Cited
Aryee, M. J., A. E. Jaffe, H. Corrada-Bravo, C. Ladd-Acosta, A. P. Feinberget al., 2014 Minfi: aflexible and comprehensive bio-conductor package for the analysis of infinium dna methylation microarrays. Bioinformatics 30: 1363–1369. https://doi.org/ 10.1093/bioinformatics/btu049
Bartlett, F. C., 1934 The Scottish council for research in educa-tion: the intelligence of Scottish children: a national survey of an age-group. Eugen. Rev. 26: 65–66.
Benner, C., C. C. Spencer, A. S. Havulinna, V. Salomaa, S. Ripatti et al., 2016 Finemap: efficient variable selection using
sum-mary data from genome-wide association studies. Bioinfor-matics 32: 1493–1501.https://doi.org/10.1093/bioinformatics/ btw018
Brown, A. A., A. Vinuela, O. Delaneau, T. D. Spector, K. S. Small et al., 2017 Predicting causal variants affecting expression by using whole-genome sequencing and rna-seq from multiple hu-man tissues. Nat. Genet. 49: 1747–1751. https://doi.org/ 10.1038/ng.3979
Chang, C. C., C. C. Chow, L. C. Tellier, S. Vattikuti, S. M. Purcell et al., 2015 Second-generation plink: rising to the challenge of larger and richer datasets. Gigascience 4: 7. https://doi.org/ 10.1186/s13742-015-0047-8
Chen, W., B. R. Larrabee, I. G. Ovsyannikova, R. B. Kennedy, I. H. Haralambievaet al., 2015 Fine mapping causal variants with an approximate bayesian method using marginal test statistics. Genetics 200: 719–736. https://doi.org/10.1534/genetics. 115.176107
Chen, X., X. Chen, Y. Xu, W. Yang, N. Wuet al., 2016 Association of six cpg-snps in the inflammation-related genes with coronary heart disease. Hum. Genomics 10: 21.https://doi.org/10.1186/ s40246-016-0067-1
Davidson, R., and J. G. MacKinnon, 1981 Several tests for model specification in the presence of alternative hypotheses. Econo-metrica 49: 781–793.https://doi.org/10.2307/1911522 Dayeh, T. A., A. H. Olsson, P. Volkov, P. Almgren, T. Rönnet al.,
2013 Identification of cpg-snps associated with type 2 diabetes and differential dna methylation in human pancreatic islets. Diabetologia 56: 1036–1046. https://doi.org/10.1007/s00125-012-2815-7
Deary, I., A. Gow, M. Taylor, J. Corley, C. Brettet al., 2007 The Lothian Birth Cohort 1936: a study to examine influences on cognitive ageing from age 11 to age 70 and beyond. BMC Ger-iatr. 7: 28.https://doi.org/10.1186/1471-2318-7-28
Deary, I. J., M. C. Whiteman, J. M. Starr, L. J. Whalley, and H. C. Fox, 2004 The impact of childhood intelligence on later life: following up the scottish mental surveys of 1932 and 1947. J. Pers. Soc. Psychol. 86: 130–147. https://doi.org/10.1037/ 0022-3514.86.1.130
Deary, I. J., A. J. Gow, A. Pattie, and J. M. Starr, 2012 Cohort profile: the lothian birth cohorts of 1921 and 1936. Int. J. Epidemiol. 41: 1576–1584. https://doi.org/10.1093/ije/ dyr197
DePristo, M. A., E. Banks, R. Poplin, K. V. Garimella, J. R. Maguire et al., 2011 A framework for variation discovery and genotyp-ing usgenotyp-ing next-generation dna sequencgenotyp-ing data. Nat. Genet. 43: 491–498.https://doi.org/10.1038/ng.806
Durbin, R., 2014 Efficient haplotype matching and storage using the positional burrows-wheeler transform (pbwt). Bioinfor-matics 30: 1266–1272. https://doi.org/10.1093/bioinformatics/ btu014
Ensor, R. C. K., 1950 The trend of Scottish intelligence: a compar-ison of the 1947 and 1932 surveys of the intelligence of eleven-year-old pupils. Eugen. Rev. 41: 196–197.
Fang, F., E. Hodges, A. Molaro, M. Dean, G. J. Hannon et al., 2012 Genomic landscape of human allele-specific dna methyl-ation. Proc. Natl. Acad. Sci. USA 109: 7332–7337. https:// doi.org/10.1073/pnas.1201310109
Hellman, A., and A. Chess, 2010 Extensive sequence-influenced DNA methylation polymorphism in the human genome. Epige-netics Chromatin 3: 11. https://doi.org/10.1186/1756-8935-3-11
Hormozdiari, F., E. Kostem, E. Y. Kang, B. Pasaniuc, and E. Eskin, 2014 Identifying causal variants at loci with multiple signals of association. Genetics 198: 497–508. https://doi.org/10.1534/ genetics.114.167908
target genes. Am. J. Hum. Genet. 99: 1245–1260. https:// doi.org/10.1016/j.ajhg.2016.10.003
Huang, H., M. Fang, L. Jostins, M. Umi´cevi´c Mirkov, G. Boucher et al., 2017 Fine-mapping inflammatory bowel disease loci to single-variant resolution. Nature 547: 173–178. https:// doi.org/10.1038/nature22969
Kichaev, G., W. Y. Yang, S. Lindstrom, F. Hormozdiari, E. Eskin et al., 2014 Integrating functional data to prioritize causal var-iants in statistical fine-mapping studies. PLoS Genet. 10: e1004722.https://doi.org/10.1371/journal.pgen.1004722 Li, H., and R. Durbin, 2009 Fast and accurate short read
align-ment with burrows-wheeler transform. Bioinformatics 25: 1754–1760.https://doi.org/10.1093/bioinformatics/btp324 Loh, P. R., P. Danecek, P. F. Palamara, C. Fuchsberger, A. Y. Reshef
et al., 2016 Reference-based phasing using the haplotype ref-erence consortium panel. Nat. Genet. 48: 1443–1448.https:// doi.org/10.1038/ng.3679
Maller, J. B., G. McVean, J. Byrnes, D. Vukcevic, K. Palin et al., 2012 Bayesian refinement of association signals for 14 loci in 3 common diseases. Nat. Genet. 44: 1294–1301. https:// doi.org/10.1038/ng.2435
McLaren, W., L. Gil, S. E. Hunt, H. S. Riat, G. R. Ritchie et al., 2016 The ensembl variant effect predictor. Genome Biol. 17: 122.https://doi.org/10.1186/s13059-016-0974-4
McRae, A., J. Powell, A. Henders, L. Bowdler, G. Hemani et al., 2014 Contribution of genetic variation to transgenerational inheritance of DNA methylation. Genome Biol. 15: R73.https:// doi.org/10.1186/gb-2014-15-5-r73
McRae, A. F., R. E. Marioni, S. Shah, J. Yang, J. E. Powell et al., 2018 Identification of 55,000 replicated dna methylation qtl. Sci Rep 8: 17605.
Meaburn, E. L., L. C. Schalkwyk, and J. Mill, 2010 Allele-specific methylation in the human genome: implications for genetic studies of complex disease. Epigenetics 5: 578–582. https:// doi.org/10.4161/epi.5.7.12960
Min, J. L., G. Hemani, G. Davey Smith, C. Relton, and M. Suder-man, 2018 Meffil: efficient normalization and analysis of very large dna methylation datasets. Bioinformatics 34: 3983–3989. https://doi.org/10.1093/bioinformatics/bty476
Mitt, M., M. Kals, K. Parn, S. B. Gabriel, E. S. Lander et al., 2017 Improved imputation accuracy of rare and low-frequency variants using population-specific high-coverage WGS-based imputation reference panel. Eur. J. Hum. Genet. 25: 869–876.https://doi.org/10.1038/ejhg.2017.51
Morris, A., 2011 Transethnic meta-analysis of genomewide asso-ciation studies. Genet. Epidemiol. 35: 809–822.https://doi.org/ 10.1002/gepi.20630
Servin, B., and M. Stephens, 2007 Imputation-based analysis of association studies: candidate regions and quantitative traits.
PLoS Genet. 3: e114. https://doi.org/10.1371/journal.p-gen.0030114
Shah, S., A. F. McRae, R. E. Marioni, S. E. Harris, J. Gibsonet al., 2014 Genetic and environmental exposures constrain epige-netic drift over the human life course. Genome Res. 24: 1725– 1733.https://doi.org/10.1101/gr.176933.114
Shoemaker, R., J. Deng, W. Wang, and K. Zhang, 2010 Allele-specific methylation is prevalent and is contributed by cpg-snps in the human genome. Genome Res. 20: 883–889. https:// doi.org/10.1101/gr.104695.109
Spain, S. L., and J. C. Barrett, 2015 Strategies for fine-mapping complex traits. Hum. Mol. Genet. 24: R111–R119. https:// doi.org/10.1093/hmg/ddv260
Taylor, A. M., A. Pattie, and I. J. Deary, 2018 Cohort profile update: the lothian birth cohorts of 1921 and 1936. Int. J. Epidemiol. 47: 1042–1042r.https://doi.org/10.1093/ije/dyy022
The 1000 Genomes Project Consortium, A. Auton, L. D. Brooks, R. M. Durbin, E. P. Garrison et al., 2015 A global reference for human genetic variation. Nature 526: 68–74.https://doi.org/ 10.1038/nature15393
The Haplotype Reference Consortium, 2016 A reference panel of 64,976 haplotypes for genotype imputation. Nat. Genet. 48: 1279–1283.https://doi.org/10.1038/ng.3643
UK10K Consortium, K. Walter, J. L. Min, J. Huang, L. Crookset al., 2015 The uk10k project identifies rare variants in health and disease. Nature 526: 82–90. https://doi.org/10.1038/ nature14962
Yang, J., S. Lee, M. Goddard, and P. Visscher, 2011 Gcta: a tool for genome-wide complex trait analysis. Am. J. Hum. Genet. 88: 76–82.https://doi.org/10.1016/j.ajhg.2010.11.011
Yang, J., T. Ferreira, A. P. Morris, S. E. Medland Genetic Investiga-tion of ANthropometric Traits (GIANT) Consortiumet al., 2012 Conditional and joint multiple-snp analysis of gwas sum-mary statistics identifies additional variants influencing complex traits. Nature Genet. 44: 369–375, S1–3. https://doi.org/ 10.1038/ng.2213
Zhi, D., S. Aslibekyan, M. Irvin, S. Claas, I. Borecki et al., 2013 Snps located at cpg sites modulate genome-epigenome interaction. Epigenetics 8: 802–806. https://doi.org/10.4161/ epi.25501
Zhou, D., Z. Li, D. Yu, L. Wan, Y. Zhuet al., 2015 Polymorphisms involving gain or loss of cpg sites are significantly enriched in trait-associated snps. Oncotarget 6: 39995–40004. https:// doi.org/10.18632/oncotarget.5650
Zhou, X., P. Carbonetto, and M. Stephens, 2013 Polygenic mod-eling with bayesian sparse linear mixed models. PLoS Genet. 9: e1003264.https://doi.org/10.1371/journal.pgen.1003264