Dept. of EEE, Sri Krishna College of Engineering & Technology, Coimbatore 641 008, Tamil Nadu, India
Energy Meter Using Gsm Technology
K.Anil Kumar , Ch.Sireesha, K.Nagendra Babu
Assistant Professor, Dept of ECE, CIET, LAM, India
Department of ECE, CIET, India
Department of ECE, CIET, India
ABSTRACT: The paper discusses the design and testing of a prototype wireless energy meter with the help of widely spread GSM network. The energy consumed by a load of 400W, 600W and 800W was calculated by the energy meter and send through the mobile unit via short messageing services (SMS) to the remote mobile unit of an elecrticity distribution company using existing GSM technology. The measurements were compared with the conventional energy meter and found promising with good accuracy. The necessary circuits for displaying the consumed energy and interfacing were also done at the transmitter side.
KEYWORDS: Energy meter, GSM technology, automatic meter reading, automatic polling mechanism
I.INTRODUCTION
In this modern era of technology the conventional systems used in every walks of the life have been replaced by the new once. The changing technology has replaced the electro-mechanical energy meters with the digital wireless energy meters. So, that the energy distribution personals could access these meters form the remote location with the help of the vastly deployed GSM Services. This will definitely offer a great convenience to the meter reading task and also speed up the process of billing with full accuracy, as it reduces the human reading errors. Also, it permits for automated billing process. Hence, an effective as wel as efficient energy management could be done for a large number of distributed subscribers. The centralized data collection system could collect the energy consumption readings from the energy meters wirelessly using automatic meter reading and the automatic polling mechanism. Thus human intervention could be reduced to improve the energy management.
Advancements in the communication technology has to be used to solve the common problems in the human life. Seeing to the limitations and social aspects of building new power generating stations, it has become mandatory to plan and use efficiently the existing ones. The digital wireless energy meter using GSM Technology [1], that the author have designed and successfully implemented, is superior to its electro-mechanical predesessors in terms of accuracy, billing, temper –detection capabilities, flexibility, manufacturability, reliability, feature –set and cost.
Automatic meter reading helps to the consumer, to the energy generating company, to the energy distrubution company by giving access to the latest and accurate information from the metering devices. This in-turn saves time, manpower and helps for an efficient energy management as wel as energy tracking. As the network of mobile is getting rapidly and widely spread to each and every point with the reduced cost, the author have used it for effective as wel as
efficient energy management.The system have been designed to meet objectives: viz.,
Basic functionalities of conventional meters
Capability to store the readings over a period of time Various power factors (1, 0.5 lead, 0.5 lag)
Dept. of EEE, Sri Krishna College of Engineering & Technology, Coimbatore 641 008, Tamil Nadu, India
II. THE SYSTEM DESIGN
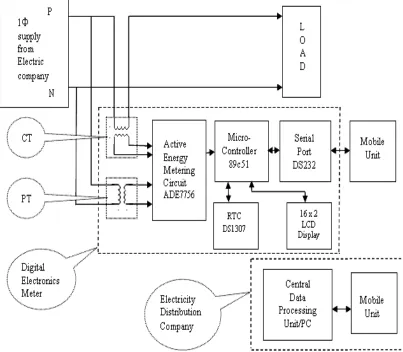
The block diagram schematic of the system is as shown in the Fig. 1. It consists of three main distinctive stages. The first stage consists of the interface between active energy metering circuit and microcontroller. The second stage comprises of interface between liquid crystal display (LCD), real time clock (RTC) with microcontroller. The third stage consists of interfacing between digital wireless energy meter and mobile unit or module.
2.1 Functional description of the blocks
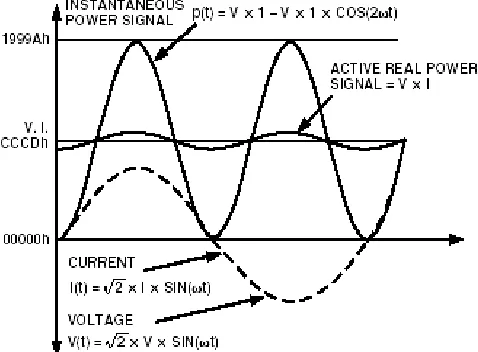
The digital wireless energy meter has two primary input sensing circuits, one for current sensing and the second for voltage sensing. The active energy metering circuit senses the current and voltage to calculate the energy consumed. The electrical power is the product of the voltage and current waveforms. The resulting waveform is called the instantanteneous power signal and it is equal to the rate of energy flow at every instant of time. The active power is equal to the dc component of the instantanteneous power signal given by equation (1) and is used to calculate active power in the ADE7756.
(1)
)
2
cos(
)
(
)
(
)
(
)
(
t
VI
VI
t
P
t
I
t
V
t
P
The DC component of the instantanteneous power signal is extracted by low pass filter to obtain the active power information. The process is graphically illustrated in Fig. 2.
2.1.1 Energy Calculation
The consumed energy ‘E’ of any given load during a time interval [3] t (=t2 – t1) is given by equation (2)
(2)
2 1 t
tPdt
E
The ADE7756 achieves the integration of the
active power signal by continuously accumulating the active power signal. While calculating the energy, this integration removes the sinusoidal components present, if any, that may be in the active power signal. The microcontoller processes, stores the energy consumption and also controls all the units for synchronous operation. It initiates all the processes like receiving the input data and sending the data through the GSM link to the dedicated mobile of the system.
The energy consumption is indicated by 16 x 2 LCD display; which is capabale of displaying two lines, each of 16 characters. The RTC DS1307 used gives the liveness to the Energy meter for sending the data to the electricity distribution company. Also it contains calender alongwith clock plus 56 bytes of nonvolatile static RAM (SRAM). The DS1307 address and data are transferred serially via a 2 wire bi-directional bus with the microcontroller.
Dept. of EEE, Sri Krishna College of Engineering & Technology, Coimbatore 641 008, Tamil Nadu, India
Fig. 1: Block Diagram of the system
2.1.2 Design of the hardware
The hardware for this wireless energy meter is designed and developed and involves A) Design of analog section
Power meter using input sensors potential transformer (PT) and current transformers (CT)
B) Design of digital section
Design of active energy metering circuit usingADE7756 Interfacing of RTC DS 1307 with microcontroller
Interfacing of LCD display JHD 162A with microcontroller Interfacing of DS232 with microcontroller
Dept. of EEE, Sri Krishna College of Engineering & Technology, Coimbatore 641 008, Tamil Nadu, India
2.2 Design considerations for input sensors
This energy meter is designed for single-phase power supply and the maximum current value is 10 A. The high magniude current and voltage signals of the mains supply must be brought down to lower level for easy process.This is done by using sensors/transducers called PT and CT, which are being used as sensors.
Fig. 2: Active power calculation
A) Design of potential transformer(PT)
The specifications for PT used in this meter are i) Maximum primary voltage – 250 Vrms, ii) Corresponding secondary voltage – 9 Vrms.
The potential transformer is connected in parallel of the load so as to sense the potential. This high potential is steped down to 9V using transformer.
B) Design of current transformer (CT)
The specifications for MS steel core CT used in this meter are i) Maximum primary current – 5 A (rms) ii) Corresponding secondary current – 50 mA.
The output current of CT is converted to the corresponding proportionate voltage for the purpose of measusrment as shown in the Fig. 3. By connecting a 200 , 2W replica resistance across secondary terminals of CT (5A: 50mA) will create a maximum voltage drop of 50mA x 200 = 10 V rms at the secondary at maximum rated loading. The current transformer converts 5A current to 50 mA and 9V.
C) Design
Transformer rating = 9V. Current drawn = 50 mA.
Therefore, the resistance value required = 9/50mA= 180.
Dept. of EEE, Sri Krishna College of Engineering & Technology, Coimbatore 641 008, Tamil Nadu, India
2.3 Design of active energy metering circuit
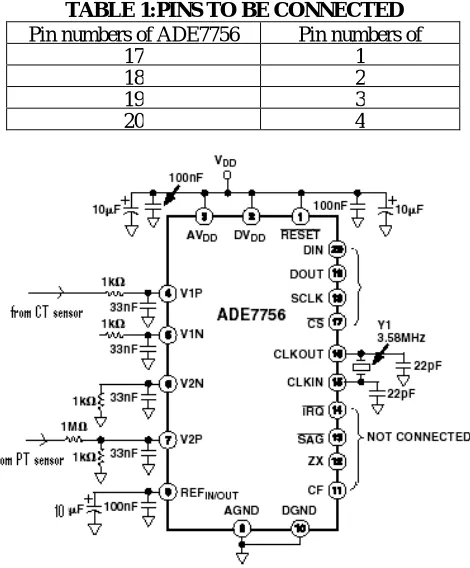
The ADE7756 is available in 20-lead dual in line (DIP) package. It is a high-accuracy electrical power measurement IC with a serial interface and pulse output. It incorporates two second order sigma-delta analog to digital convertors (ADC), reference circuitry, temperature sensor and all the signal processing required to perform active power and energy measurement. The circuit arrangement is shown in
Fig. 3: Circuit for Conversion of current to voltage
The instanteneous power is given by equation (1). The average power over an integral number of cycles (n) is given by equation (3).
(3)
)
(
)
1
(
0
nT
VI
dt
t
p
nT
P
where, T is the line cycle period and P is referred to as the active or real power. This active power is equal to the DC component of the instantaneous power signal in equation (1). This DC component is extracted by low pass filter (LPF) to obtain the active power information. This signal processing chain of the active power calculation in ADE7756 is as shown in the Fig. 5.
Due to instanteneous power signal some ripples are present in the active power signal.This ripple is sinusoidal and has a frequency equal to twice the line frequency. Since the ripple is sinusoidal in nature, it will be removed when the active power signal is integrated to calculate energy. The ADE7756 achieves the integration of the active power signal by continuous accumulation of the active power signal.
2.4 Energy meter display
The energy meter displays the energy consumed in KWh unit. All ADE7756 functionality is accessible via several on-chip registers.The contents of these registers could be updated or read using the on-on-chip serial interface. Each register is accessed by first writing to the communications register and then transfering the register data.
2.5 Design considerations of degital section
The digital card consists of the 8 bit microcontroller 89c51, interfacing of ADE7756, RTC DS1307 and LCD display JHD 162A with microcontroller.
Dept. of EEE, Sri Krishna College of Engineering & Technology, Coimbatore 641 008, Tamil Nadu, India
2.5.1 Interfacing ADE7756 with microcontoller
TABLE 1:PINS TO BE CONNECTED
Pin numbers of ADE7756 Pin numbers of
17 1
18 2
19 3
20 4
Fig. 4: Circuit diagram for calculating energy
Fig. 5: Signal processing chain of the active power
2.5.2 Crystal Interfacing
Dept. of EEE, Sri Krishna College of Engineering & Technology, Coimbatore 641 008, Tamil Nadu, India
2.5.3 Reset circuitry
The reset circuitary (RC) (differentiator circuit) is used as power ON reset circuitry and connected at pin 9 of microcontroller. This reset is active high and should be hold high for 24 clock oscillator period. Thumb rule for selection of capacitor is in the range- 1f to 10 f and for resister in the range -1K to 10 K. The author have selected 5.6 K and 10 f.
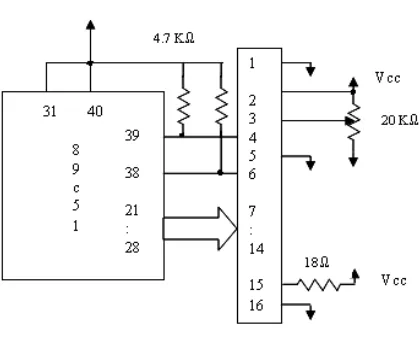
2.5.4 LCD module interface
The LCD module of Orion JHD 162A is used in the Energy Meter. The interfacing details with the microcontroller is shown in Fig. 6.
Fig. 6: LCD Interfacing
2.5.5 Real time clock interface
The DS1307 is serial real time clock with a low-power, full BCD clock/calender plus 56 bytes of non-volatile SRAM; connected directly to one of the I/O ports on microcontroller. The interfacing of RTC with microcontroller is as shown in Fig. 7.
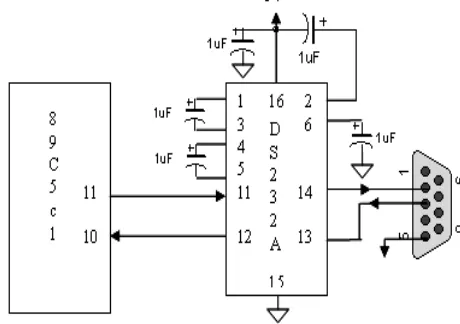
2.5.6 Serial communication
The GSM mobile/module could be interfaced to microcontroller through serial port and RS232. DS232A is a dual RS-232 driver/receiver pair which generates RS -232 voltage levels from a single +5 volt power supply. Interfacing of mobile with microcontroller using DS232A is a shown in Fig. 8. The serial port is operating in a full duplex mode. The receiver and transmitter register are both accessed at serial buffer (SBUF). The serial port supports four modes; viz,
a) Mode 0: shift resister
b) Mode 1: 8 bit universal asynchronous receive transmit (UART) c) Mode 2: 9 bit UART with fixed baud rate
d) Mode 3: 9 bit UART with variable baud rate
2.5.6.1 Calculation of Baud rate
In Mode 1, baud rate is be obtained by,
}]
(4)
)
256
(
12
{
)
32
2
[(
1
TH
f
rate
Baud
oscSMOD
Dept. of EEE, Sri Krishna College of Engineering & Technology, Coimbatore 641 008, Tamil Nadu, India
Fig. 7: Inerfacing of RTC 1307 with microcontroller
2.5.6.2 Transmit and receive routines of the energy meter
A)Transmit routine
TI flag should be checked before data is passed on to the serial buffer. TI bit or flag is in SCON register. TI = 0 {Transmitter busy}; TI = 1 {Transmitter free}
STEPS:
i)Load data
ii)Is transmitter ready?
iii)If yes Go to steps 2. If not, then move data to SBUF. B)Receive routine
RI flag should be checked before receiving data. RI bit or flag is in serial port control (SCON) register. STEPS:
i) Data received ? ii) JZ No_RCV
iii) If yes-read the data. If not, then go back.
2.5.7 Interfacing GSM mobile/module with energy meter
Dept. of EEE, Sri Krishna College of Engineering & Technology, Coimbatore 641 008, Tamil Nadu, India
The mobile/module should be capable of operating in both the protocol data unit (PDU) and the text mode. The text mode is used for this energy meter SMS operations. The attention (AT) commands are used for the purpose of communication with the mobile. It is necessary to use a mobile/module which is GSM AT compliant. The mobile/module could be controlled in different ways by the microcontroller with the help of AT commands. Some simple AT commands for doing the SMS are,
AT+CMGR - Read message AT+CMGS - Send message
Text mode SMS are also available on GSM module.
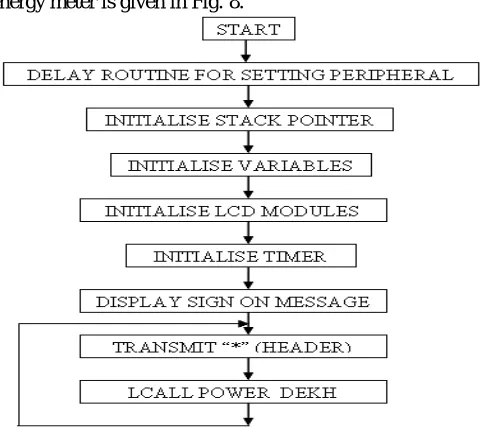
2.5.8 Main routine
The main routine of the energy meter is given in Fig. 8.
Fig. 8: Flowchart for main routine
3. OBSERVATIONS
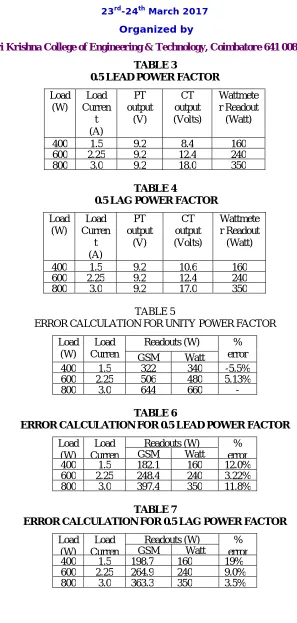
The energy meter circuit voltages measured for the loads of 400W, 600W and 800W for unity power factor, 0.5 lead and 0.5 lag are presented in table 2 through 4. Similarly, their percentage error calculated for the above loads are given in table 5 through 7.
TABLE 2
UNITY POWER FACTOR
Load (W)
Load Curren
t (A)
PT output
(V)
CT output (Volts)
Wattmete r Readout
(Watt)
Dept. of EEE, Sri Krishna College of Engineering & Technology, Coimbatore 641 008, Tamil Nadu, India
TABLE 3
0.5 LEAD POWER FACTOR
Load (W) Load Curren t (A) PT output (V) CT output (Volts) Wattmete r Readout (Watt)
400 1.5 9.2 8.4 160 600 2.25 9.2 12.4 240 800 3.0 9.2 18.0 350
TABLE 4
0.5 LAG POWER FACTOR
Load (W) Load Curren t (A) PT output (V) CT output (Volts) Wattmete r Readout (Watt)
400 1.5 9.2 10.6 160 600 2.25 9.2 12.4 240 800 3.0 9.2 17.0 350
TABLE 5
ERROR CALCULATION FOR UNITY POWER FACTOR
Load (W)
Load Curren
t
Readouts (W) % error GSM Watt
400 1.5 322 340 -5.5% 600 2.25 506 480 5.13% 800 3.0 644 660
-TABLE 6
ERROR CALCULATION FOR 0.5 LEAD POWER FACTOR
Load (W)
Load Curren
Readouts (W) % error GSM Watt
400 1.5 182.1 160 12.0% 600 2.25 248.4 240 3.22% 800 3.0 397.4 350 11.8%
TABLE 7
ERROR CALCULATION FOR 0.5 LAG POWER FACTOR
Load (W)
Load Curren
Readouts (W) % error GSM Watt
Dept. of EEE, Sri Krishna College of Engineering & Technology, Coimbatore 641 008, Tamil Nadu, India
IV. APPLICATIONS AT A GLANCE
1) To monitor the energy usage in different departments of factory. This will allow us to monitor, such as the department which is using maximum power and how it could be reduced.
2) To monitor total energy usage of a small scale industry, office or residential,
3) To monitor power consumption in hazardous environment as it is difficult for the human personal to reach out these locations.
4) To monitor the power utilization in remote areas. The report or billing could be sent through SMS for the speedy access to the consumers.
V. FUTURE MODIFICATIONS
1) The system could be modified for three phase supply with the use of three current transformers and three potential transformers to calculate the total consumed energy.
2) The system also could be modified to monitor power factor, maximum demand of power in the company and its future need.
3) The system indication for crossing the upper and lower preset limit of power factor and maximum KVA demand could be made. This will help to switch ON or switch OFF necessary capacitor banks/inductive loads to correct power factor and to switch ON or switch OFF some of the loads for load shedding.
4) The system could also be modified to detect any intentional or unintentional tampering such as wrong connections, wrong phase sequence, lowering the speed etc. by the consumer.
5) The concept of prepaid energy services similar to the mobile services could be effectively implemented, where, the user has to purchase energy in advance. The users could be provided smart cards such as used in mobile, where units of consumption could be filled from anywhere.
6) The disconnection or reconnection could be done by the operator remotely from the office of the distribution company in case the client fails to pay the bills.
VI. CONCLUSION
The design and testing of the wireless energy meter using GSM technology has been carried out. Necessary interfacing for the prototype model was done. The author has carried out the work with the Sony Ericsson and Nokia handsets as transmitting and receiving ends respectively. The energy consumed by various loads connected across the energy meter was sent through the SMS to the receiver mobile. The same was physically compared with the standard energy meter readings simultaneously and found that the readings of GSM based energy meter offers less error. Therefore, it is concluded that, the designed system is effective and accurate.
REFERENCES
[1] Joschen Schiller, “Mobile communication,” Pearson Education (Singapore), 2004, pp 1-67, 303-346, 356-399. [2] Bhupendre Singh Chhabra, “Microcontroller and its applications”, Dhanpat Rai and Co. Ltd., 1999, pp 1-88.
[3] P. A. V. Loss, et al, “A single phase microcontroller based energy meter,” presented at IEEE Instrumentation and Measuremnt Technology Conference, St. Paul, Minessota, USA, May 18-21, 1998, pp.797-800.
[4] B. S. Koay, et al, "Design and Implementation of Bluetooth Energy Meter," in Proc. of the Intl. Conf. ICICS-PCM 2003, Singapore, pp. 1474-1477, June 1993.