ABSTRACT
CABRERA, RAFAEL ARISTIDES. Improving Early Postnatal Piglet Health, Growth and Development: Effects of Supplemental Milk Replacer, IgG, Glutamine and Glutamic Acid. (Under the direction of Dr. Jack Odle and Dr. Adam J. Moeser.)
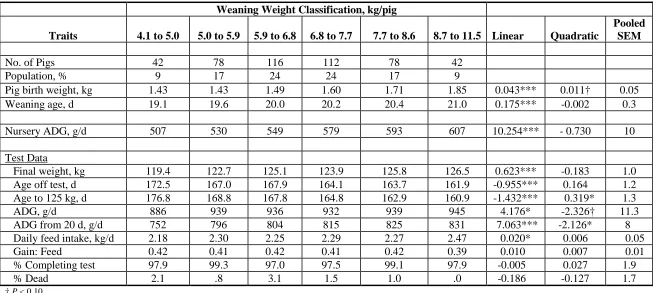
The immunity acquired by neonatal piglets during the suckling period is critical for their protection against diseases beyond the colostrum period. The influence of maternal age on the immune competence of her progeny is known to be important but has been more extensively studied in dairy cattle than pigs. Moreover, how the piglets’ long-term growth and viability beyond the colostrum period are influenced by the amount of time they spend nursing their mother after removing the effect of birth weight has never been studied. A total of 1,034 pigs produced by breeding PIC sows to 2 different PIC terminal sires were used to create 3 distinct weaning weight populations so that post-weaning growth to 125 kg could be studied: Sow reared (SR) (N = 367) for 20 d, sow reared for 14 d (14W) (N = 330) and sow reared for 2 d (2W) (N = 337). We found that there was a linear relationship (P < 0.05) between weaning weight and ADG in the post-nursery phase of growth. Two major conclusions were drawn from this experiment: 1) a weaning weight of less than 5.0 kg weaning weight imposes the greatest marginal loss in production output for a 20-d weaning, and that (2) lactation length positively influences long-term growth, composition of growth and viability of the progeny.
colostrum IgG concentration and birth order can account for 10% of the variation of pig IgG concentration and that piglets with less than 1,000 mg/dl IgG serum concentration and birth weight of 0.9 kg at birth had low survival rate when compared to their heavier siblings. Piglet IgG concentration and birth weight had the greatest effects (57% and 64% respectively) of any of the variables measured on % survival at weaning.
In experiment thee, we determined the effect of time and feeding state on IgG absorption, intestinal morphology, and expression of IgG receptors in the first 24 h post-birth. Twenty newborn pigs were fitted with umbilical arterial catheters and orally-gavaged with 32 ml defatted colostrum per kg of body weight either at birth (0 h) or at 12 h post-birth under either fed (milk replacer) or fasted (saline solution) conditions (n = 5/group). A fifth reference group (n=5), was euthanized at birth. There was no interaction between the time (age) of colostrum gavage (0 vs. 12 h) and nutritional state (fed vs. fasted). Serum IgG increased progressively with time, reaching peak concentrations at 8 h post-gavage. Piglets given colostrum at 0 h had higher (P < 0.05) overall IgG absorption and higher (P < 0.05) villi height than those gavaged at 12 h post birth. Abundance of FcRn transcript was lower (P = 0.006) in pigs euthanized at birth compared with those gavaged at 0 h and killed at 12 h of age.
Improving Early Postnatal Piglet Health, Growth and Development: Effects of Supplemental Milk Replacer, IgG, Glutamine and Glutamic Acid
by
Rafael Aristides Cabrera
A dissertation submitted to the Graduate Faculty of North Carolina State University
in partial fulfillment of the requirements for the degree of
Doctor of Philosophy
Animal Science & Poultry Science
Raleigh, North Carolina 2011
APPROVED BY:
_______________________________ ______________________________
Dr. Jack Odle Dr. Adam J. Moeser
Co-Chair of Advisory Committee Co-Chair of Advisory Committee
DEDICATION I want to dedicate this work to four persons in my life:
To my mother Argentina Dolores Rosario. She has always showed the greatest
determination to raise her family together. She changed hospital beds walking 10 miles every day in the heat of the summer in the Dominican Republic. She raised all of us with dignity and never gave up. From her I learned that we must do that we think is impossible. I will always love you mom.
To my wife Maria Dolores Cabrera. This academic work that I am completing-- I would have not been able to do it without your help. You have always been supportive and aware of my intention to pursue my dreams. You have made those dreams yours without asking anything in return. You are the true image of what a partner in a marriage should be. You taught me the things that I would have never imagined to learn from a partner. If I am a different and better person today it is because of you. I have never loved anyone as I love you. You will always be the “Love of My Life”.
To my oldest son Camilo Rafael Cabrera. You are and have become everything that a Dad can ask for from his Son. I wish you all the best in the years to come.
Last but not least my youngest son Gabriel Rafael Cabrera. Since you were little you have had the determination and capacity to be anything that you want to be. You are a true copy of me.
BIOGRAPHY
ACKNOWLEDGMENTS
I would like to thank my two co-advisors Dr. Adam J. Moeser and Dr. Jack Odle. Dr. Moeser is an inspiration to me with his level of dedication to his research program. He has always been available to answer any questions that I have had and willing to share his experience. Dr. Odle has been everything that a graduate student expects from an advisor: knowledgeable, caring, helpful and always available. Not once did he decline a request to meet with me. I consider Dr. Odle my personal friend and a mentor.
Thanks also to my committee members Dr. Chad Stahl, Dr. Xi Lin and Dr. Ronald Nimmo. Dr. Stahl’s office has always being open to me to discuss my research projects and always giving me constructive criticism. Dr. Lin has always been involved on all my research projects providing a helping hand. He is very bit practical but yet extremely scientific. Dr. Nimmo has been my boss, friend and colleague for many years. In the area of corporate nutrition, my respect to him is second to none.
consecutive days and I was introduced to the famous drink Red Bull. I also want to thank my two boys Camilo and Gabriel Cabrera. Camilo was instrumental with the blood work and Gabriel helped weighing pigs at weaning. Audrey Taro helped me tremendously with the RT-PCR analysis and Dr. Melissa Ashwell with the interpretation of the data generated in experiment # 3. I want to thank Dr. James Usry from Ajinomoto Heartland Lysine for providing all the financial assistance for experiment # 4. Both Wilmer Pacheco and Indira Torres offered unconditional help during this experiment. They helped me at the research farm executing the experiment and lab work. I also want to thank Lauren Lanier who decided to gain some field research experience dedicating the whole summer to this project. I want to thank Dr. Michael Dysktra, Research Professor and Director of LAELOM (Laboratory for Advanced Electron and Light Optical Methods) for his valuable and unconditional help during my Scanning Electron Microscopy (SEM) training.
I want to thank Dr. Eric VanHeuten, Dr. Jerry Spears, Dr. Joan Eisseman, Dr. Anthony Blikslager, Dr. Sheila Jacobi, and Dr. Sung Woo Kim, Dr. Kara Stewart, Dr. Billy Flowers, and Dr. Peter Ferket always being available when I needed to discuss my ideas with them. I am honored to be associated with such talented group of professionals.
I also want to thank Mrs. Marian Correll at the graduate student office. Marian has always been cordial and extremely helpful to me. She is the example of someone who truly enjoys her work.
TABLE OF CONTENTS
LIST OF TABLES ... xi
LIST OF FIGURES ... xiii
CHAPTER 1 ...1
LITERATURE REVIEW ...1
PRODUCTION OF SOW COLOSTRUM AND MILK ...1
COMPOSITION OF SOW MILK ...4
PREWEAN MORTALITY IN NEONATAL PIGLETS AND TRANSFER OF PASSIVE IMMUNITY ...7
THE ROLE OF THE MHC CLASS I-RELATED PORCINE NEONATAL Fc RECEPTOR IN THE UPTAKE AND TRANSPORT OF IMMUNOGLOBULIN G ...11
INTESTINAL MACROMOLECULAR TRANSMISSION AND CLOSURE IN NEONATAL PIGS ...17
SYNTHESIS OF GLUTAMINE AND ITS ROLE IN METABOLISM AND PHYSIOLOGY ...21
FORWARD REFLECTIONS ON THESIS RESEARCH WITH PRACTICAL IMPLICATIONS ...35
LITERATURE CITED ...38
CHAPTER 2 ...52
IMPACT OF LACTATION LENGTH AND PIGLET WEANING WEIGHT ON LONG-TERM GROWTH AND VIABILITY OF THE PROGENY ...52
ABSTRACT ...53
MATERIALS AND METHODS ...55
RESULTS ...61
DISCUSSION ...63
LITERATURE CITED ...82
CHAPTER 3 ...86
BIRTH ORDER, BIRTH WEIGHT, SOW COLOSTRUM IgG AND PIGLET SERUM IgG CONCENTRATION AND THEIR EFFECTS ON NEONATAL SURVIVAL ...86
ABSTRACT ...87
INTRODUCTION...88
MATERIALS AND METHODS ...89
RESULTS ...92
DISCUSSION ...93
CONCLUSION ...100
LITERATURE CITED ...110
MATERIALS AND METHODS ...120
RESULTS ...126
DISCUSSION ...127
CONCLUSIONS ...132
LITERATURE CITED ...142
CHAPTER 5 ...149
EFFECTS OF CREEP FEEDING AND SUPPLEMENTAL GLUTAMINE OR GLUTAMINE PLUS GLUTAMATE (AMINOGUT) ON PRE- AND POST-WEANING GROWTH PERFORMANCE AND INTESTINAL HEALTH OF YOUNG PIGLETS. ...149
ABSTRACT ...150
INTRODUCTION...151
MATERIALS AND METHODS ...156
RESULTS ...160
DISCUSSION ...162
CONCLUSION ...172
LITERATURE CITED ...187
CHAPTER 6 ...198
CONCLUDING THOUGHTS ...198
LIST OF TABLES CHAPTER 1
Table 1. Composition of sow milk throughout lactation (adapted from Klobasa
et al., 1987) ...4 Table 2. Effects of active components on immunoglobulins contents in porcine colostrums (adapted from Farmer and Quesnel, 2008) ...6
Table 3. Concentrations (μg/L) of growth factors in sow’s colostrum and milk
(adapted from Odle et al., 1996) ...7 Table 4. Transmission of Maternal Antibody (adapted from Redman, 1979) ...9 Table 5. Concentration (mg/ml) of IgG, IgM and IgA in sows’ whey during
lactation (adapted from Klobasa et al., 1987) ...10
CHAPTER 2
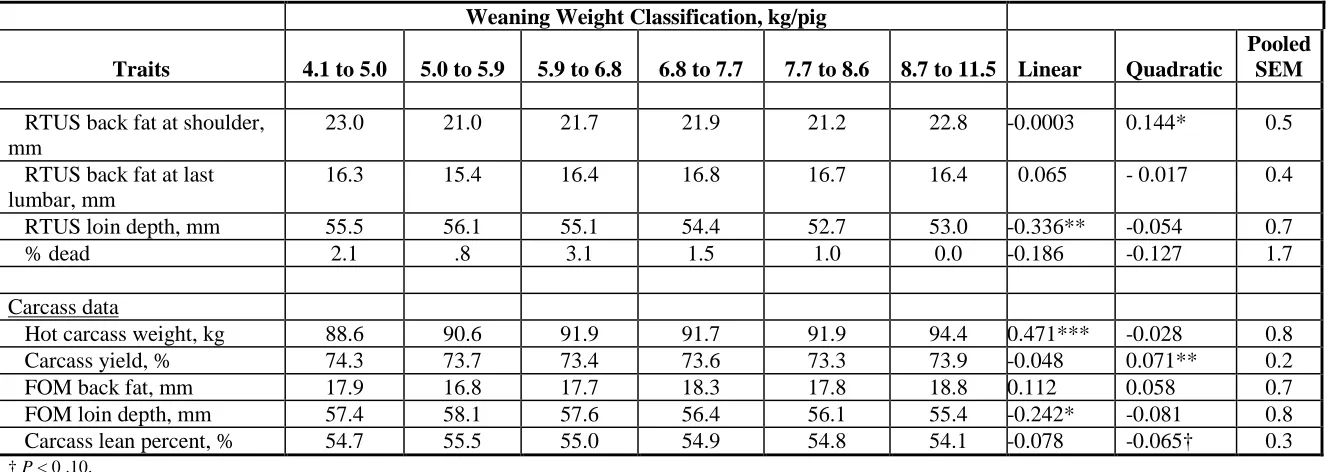
Table 8. Least square means of real-time ultrasound (RTUS) and fat-o-meter (FOM) measures on whole-body and carcass data for pigs that were sow reared (SR), wean at 14 d of age (14W) and wean at 2 d of age (2W) ...79 Table 9. Least square means for the combined data of SR and 14W groups of pigs for nursery and finishing phases of growth...80 Table 10. Least square means for the combined data of SR and 14W groups for real-time ultrasound (RTUS), fat-o-meter (FOM) and carcass measures of pigs ...81
CHAPTER 4
Table 1: Real-time polymerase chain reactions (PCR) Primers. ...141
CHAPTER 5
Table 1. Ingredients and Nutrients Composition of the Nursery Diets (Phase 1, 2 and 3) ...173 Table 2. Pre-weaning Performance of No-Creep, Creep, Glutamine and AminoGut Treatments...174 Table 3. Pig Performance from week 1 to week 3 Post-weaning ...175 Table 4. Pig Performance from week 3 to week 6 post-weaning1 ...176 CFCCDGN
LIST OF FIGURES CHAPTER 1
Figure 1. FcRn Structure (adapted from Raghavan and Bjorkman, 1996) ...16 Figure 2. Pathways of glutamine synthesis in pigs. (adapted from Li et al., 2009b) ...22 Figure 3. Possible mechanisms responsible for the beneficial effect of glutamine in intestinal barrier function and growth (adapted from Wu, 2007) ...24 Figure 4. Specificity of Glutamine effect on ODC activity.
(adapted from Hosam et al., 1991)...25 Figure 5. Thymidine incorporation assay of IEC-6 cells preincubated with different concentrations of glutamine. (adapted from Rhoads et al., 1997) . ...27 Figure 6. Illustration of the mechanisms of Na+ absorption across intestinal epithelial cells. GLUT2 = Glucose transporter 2. ORS = Oral Rehydration Solution
(adapted from Moeser, 2006) ...28 Figure 7. Water (top) and sodium (bottom) net fluxes over cm jejunum in six healthy humans studied during baseline and PGE1-induced hypersecretion. Negative values denote net secretion into jejunal lumen; positive values denote net absorption from lumen (adapted from Coeffier et al., 2005). Bars represent means ± SE ...30 Figure 8. Area under the Curve (AUC) Glutamine concentration. *= significantly different than T2. (adapted from Hoffman et al., 2010) ...34
Figure 9. Δ Time to exhaustion. * = significantly different from ΔT2.
(adapted from Hoffman et al., 2010) ...35
CHAPTER 3
Figure 4. Effect of sow parity on pig IgG concentration ...104
Figure 5. Effect of pig IgG concentration on pig serum protein concentration ...105
Figure 6. Effect of pig IgG concentration on % of survival at weaning ...106
Figure 7. Effect of pig birth weight on % of survival at weaning ...107
Figure 8. Effect of pig birth weight on pig final market weight ...108
Figure 9. Radial Immuno Diffusion (RID) Technique ...109
CHAPTER 4 Figure 1. Insertion of the Single Lumen 3.5 French Catheter into the Pig’s Portal Vein ...133
Figure 2. Quality of RNA from Pigs’ Jejunum as Evaluated by 1.2% Agarose Gel Electrophoresis ...134
Figure 3. Micrograph of the Measurement of Villi Height, Width and Crypt Depth in a 1-Day-Old Piglet Jejunum ...135
Figure 4. Time Course of IgG Absorption in Fed and Fasted Pigs Gavaged with Colostrum ...136
Figure 5. Changes in Sow Colostral IgG and Pig Serum IgG (mg/ml) Content in Swine as Function of Time ...137
Figure 6. Efficiency (%) of IgG Transported by Piglets Gavaged with Colostrum at 0 h and 12 h of Age ...138
Figure 7. Intestinal Morphology (Microns) of 12-h and 24-h old ...139
Figure 8. Changes in gene expression for FcRn for pigs at 0 (birth), 12 and 24 h of Age ...140
Figure 1. Scanning Electron Microscopy (SEM) of jejunum of pigs No Creep
Control Diet (NC-CD) treatment ...178 Figure 2. Scanning electron microscopy (SEM) of jejunum of pigs No Creep
Glutamine (NC-GLN) treatment ...179 Figure 3. Scanning electron microscopy (SEM) of jejunum of pigs No Creep
AminoGut (NC-AG) treatment ...180 Figure 4. Scanning electron microscopy (SEM) of jejunum of pigs Creep Fed
Control Diet-Control Diet (CFCD-CD) treatment ...181 Figure 5. Scanning electron microscopy (SEM) of jejunum of pigs Creep Fed
Control Diet-Glutamine (CFCD –GLN) treatment ...182 Figure 6. Scanning electron microscopy (SEM) of jejunum of pigs Creep Fed
Control Diet-AminoGut (CFCD-AG) treatment ...183 Figure 7. Scanning electron microscopy (SEM) of Jejunum of pigs Creep Fed
Glutamine-Glutamine (CFGLN-GLN) treatment ...184 Figure 8. Scanning electron microscopy (SEM) of Jejunum of pigs Creep Fed
CHAPTER 1 LITERATURE REVIEW PRODUCTION OF SOW COLOSTRUM AND MILK
The importance of the maternal influence of the sow on the nutrition and immunity of her progeny cannot be emphasized enough. After parturition and during the suckling period, the sow provides the main nutrient source for the suckling piglets therefore understanding the quantity and quality of this nutrient source becomes extremely relevant for the survival of the neonatal piglets. In the last decade more research has been concentrated on early weaning and rearing of piglets by artificial means. The knowledge generated by these practices has allowed us to use the pig as model to study human nutrition and immunology (Reeds and Odle, 1996). Like many farm animals, the pig is born with low energy reserves (Mellor and Cockburn, 1986) and without immune protection (Gaskins, 1998). Colostrum provides these two
components as well as other important growth factors such as EGF, IGF-I, IGF-II and Insulin (Odle et al., 1996). Colostrum also plays an important role in the development of the
gastrointestinal tract of the piglet (Xu et al., 2002).
associated with increased production per gland. Milk production from individual glands may also be influenced by suckling frequency. The typical suckling frequency interval varies from 30 to 70 min for individual sow during the first week of lactation (Jensen et al., 1991).
The production of colostrum is quite variable among sows and the factors affecting this variability are not well known (Farmer and Quesnel, 2009). Colostrum secretion occurs during the key transition period from the anabolic metabolism of gestation to the catabolic metabolism of lactation (Bauman and Curie, 1980). Sow colostrum production has been estimated to vary from 2.5 to 5 kg over 24 h for a litter of 8 to 12 piglets. This roughly accounts for 360 g/pig/d intake of colostrum. This calculation is consistent with the results published by Devillers (2004) wherein colostrum intake of sow-reared piglets ranged from 212 to 373 g/kg of birth weight. However colostrum intake of bottle-fed piglets during the first 24 h after birth had a voluntary intake exceeding 450 g/kg of birth weight (Harrell et al. 1993). The amount of colostrum available per piglet decreases by 22 to 42 g per each additional piglet born (Devillers et al., 2007). The mean efficiency of conversion of milk to gain has been found to be 4.5 g of milk per 1 g of pig gain (Lewis et al., 1978).
(123.9 kg vs. 123.5 kg respectively). This is probably due to compromise health and/or digestive upset. Unlike other studies (Mahan, 1993; Mahan and Lepine, 1991) where pigs with different birth weights are tracked until slaughter, this is was an impressive finding since we removed the birth effect among the treatments. This study also has a profound implication in terms of the characteristics of the composition of the sow’s milk vs. commercial milk replacers. Sow’s milk has proven to have benefits beyond the colostrum period.
Spencer and others (2003) observed greater growth rate when they early weaned pigs at d 14 and fed milk replacer. They observed growth of 681 g/d from d 14 until d 19. Milk replacer was the only source of nutrients and the room temperature was kept at 30 C. They did not follow the grow-finish period performance in those milk-fed pigs.
Devillers et al., (2007) reported no effects of age, BW or duration of parturition on colostrum yield. However they reported that there was a tendency for greater production of colostrum for second and third parity sows when compared to primiparous or older sows. Mahan (1998) also reported a linear decrease in colostral fat content as parity advanced with the largest decline occurring in parity 1 to parity 2.
only have a small detrimental effect on colostrum production because of the sow’s body size and large energy reserves.
COMPOSITION OF SOW MILK
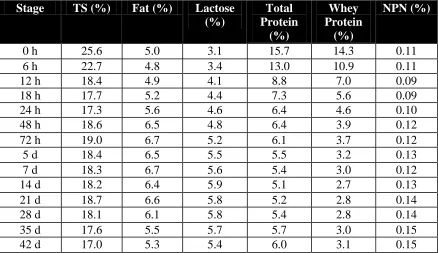
The production of milk by the sow starts during the final h of gestation with the production of colostrum (highly pigmented and viscous colostral secretion in the mammary gland). The most comprehensive study conducted to determine the true composition of sow milk during lactation has been conducted by Klobasa and co-workers (1987). They studied the amounts of total solids (TS), fat, lactose, total protein, and total whey protein, their
interrelationships and the changes in these interrelationships throughout lactation in 25 German Landrace sows (Table 1).
Table 1. Composition of sow milk throughout lactation (adapted from Klobasa et al., 1987). Stage TS (%) Fat (%) Lactose
(%) Total Protein (%) Whey Protein (%) NPN (%)
0 h 25.6 5.0 3.1 15.7 14.3 0.11
6 h 22.7 4.8 3.4 13.0 10.9 0.11
12 h 18.4 4.9 4.1 8.8 7.0 0.09
18 h 17.7 5.2 4.4 7.3 5.6 0.09
24 h 17.3 5.6 4.6 6.4 4.6 0.10
48 h 18.6 6.5 4.8 6.4 3.9 0.12
72 h 19.0 6.7 5.2 6.1 3.7 0.12
5 d 18.4 6.5 5.5 5.5 3.2 0.13
7 d 18.3 6.7 5.6 5.4 3.0 0.12
In this study all sows farrowed within 4 d and they found that in the first 6 h of lactation colostrum total solids (TS) and protein contents were higher, while fat and lactose contents were lower than in mature milk. Decreased total protein decreased whey protein contents and increased fat and lactose content with unchanged TS levels, indicate transition from colostrum to mature milk. The high protein content is largely due to immunoglobulin. No influence of parity and litter size on milk composition was observed in this study.
These results are very consistent with those reported by Mateo et al., 2004. They found in twelve multiparous sows (Landrace x Yorshire x Duroc) that Total Milk Solids (TMS) decreased from 26.7% on d 0 to 23.1% on d 3. The TMS further decreased to 19.3% on d 7 but then remained constant at 18.2%, 18.8% and 19.2% on d 14, 21 and 28, respectively. The concentration of CP decreased from 16.6% in colostrum to 7.7%, 6.2%, 5.5%, 5.7% and 6.3% in milk collected on d 3, 7, 14, 21 and 28, respectively. They also found (not measured by Klobasa and others, 1987) that in colostrum 5’UMP represented 98% of all 5’monophosphate nucleotides, and in milk, 5’UMP accounted for 86 to 90% of all nucleotides, regardless of the day of lactation. This indicates that TMS and CP values for sow’s milk has remained virtually the same in the last 15 years regardless the changes observed in genetics, housing systems, level of productivity and diet formulation.
content (Mahan, 1998). However the increase of dietary lysine intake (8.0 g/kg instead of 6.0 g/kg) in late gestation increased total solid and protein contents in colostrum in sows (Heo et al., 2008; Yang et al., 2008). Bland and others (2001) and Pinelli-Saavedra and co-workers (2008) have increased dietary vitamin concentration during gestation and saw an increased of vitamin concentrations in porcine colostrum. A more complete of summary of the immune-modulating effects of active components on immunoglobulin concentrations in porcine colostrum is presented in Table 2.
Table 2. Effects of active components on immunoglobulin contents of porcine colostrum (adapted from Farmer and Quesnel, 2008).
Treatment Duration1 Effect Reference
Conjugated Linoleic Acid 8 d ↑IgG Bontempo et al., 2004 Phytogenic Feed Additive
(Essential Oils)
1 wk ↑IgG Wang et al., 2008
Plant Extract 1 wk ↓IgG, IgA Ilsley et al., 2003 Mannan Oligosaccharides 2 wk ↑IgM, = IgG, IgA Newman and Newman,
2001
Mannan Oligosaccharides 3 wk ↑IgG, IgA, IgM O’Quinn et al., 2001
1
stable and have no problem reaching the small intestine intact avoiding degradation by gastric secretion (Odle et al., 1996).
Table 3. Concentrations (µg/L) of growth factors in sow’s colostrum and milk (Adapted from Odle et al., 1996).
Growth Factors Colostrum Mature Milk Reference Epidermal Growth Factor (EGF) 1,500 ± 525 160 to 240 Jaeger et al., 1987 Insulin-like Growth Factor (IGF-I) 39 ± 22 11.4 ± 1.4 Donovan et al., 1994 Insulin-like Growth Factor (IGF-II) 82.3 ± 57.5 16.8 ± 5.6 Donovan et al., 1994 Insulin 12.3 ± 3.3 1.6 to 3.3 Jaeger et al., 1987
PREWEAN MORTALITY IN NEONATAL PIGLETS AND TRANSFER OF PASSIVE IMMUNITY
Despite increased improvements in management practices, the mortality of newborn piglets remains unacceptably high at 15% (USDA, 2007). Large swine integrators with more than 100,000 sows will have even higher mortality. This high mortality results from a
combination of both improved sow genotype and consequently yielding larger litter size and reduction in labor in order to reduce production costs. Crushing by the dam accounts for more than 40% of piglet’s death, while starvation and digestive upset account for more than 30% (USDA, 2007).
will not synthesize antibodies on its own because it receives ample circulating antibodies from the dam. The average half-life of these antibodies (i.e. IgG is 9.5 d) is between 1 to 2 weeks. After that the neonate will start making antibodies when exposed to antigens. When an antigen first appears, it is recognized by Antigen Presenting Cells (APC) such as dendritic cells which in turn present the antigen to T-cells (thymus derived cells) and from those cells the message finally arrives to the B-cells (bone-marrow derived cells). The stimulated B-cells then undergo mitosis and blast formation. The blast cells are the cells which actively produce and secrete antibodies. The whole process from when antigens are presented until antibodies are formed is between 3 to 4 days (Stormont, 1972).
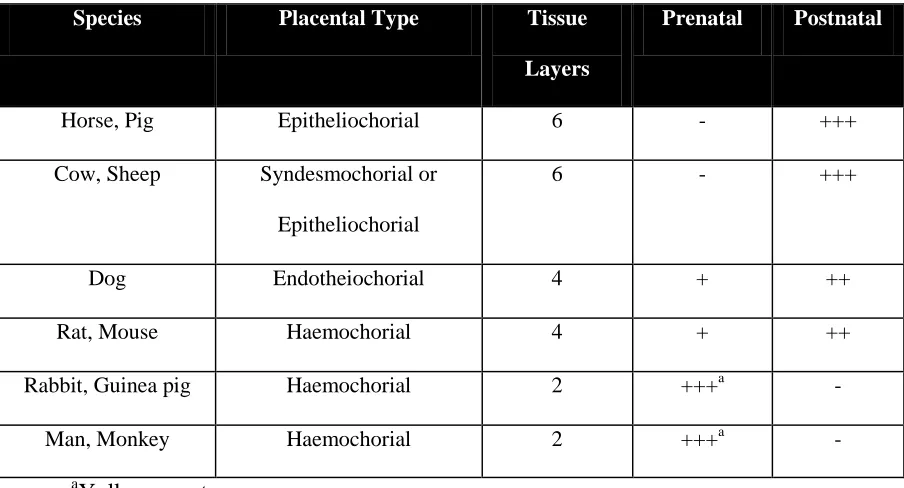
In calves, IgG molecules are not present in the blood-stream of newborn because they cannot cross the placenta during pregnancy. In a study conducted by the USDA (1993), blood samples of 2,177 calves were collected between 24 to 48 h of age and it was determined that IgG represented nearly 90% of all the immunoglobulins transferred to calves in colostrum. The report also noted that the level of IgG that provides adequate protection is around 1,000 mg/dl. This is consistent with the results we reported in chapter 3. IgG molecules cannot cross the placenta in pigs during pregnancy and therefore accounts for the lack of IgG in the
Table 4. Transmission of Maternal Antibody (adapted from Redman, 1979).
Species Placental Type Tissue
Layers
Prenatal Postnatal
Horse, Pig Epitheliochorial 6 - +++
Cow, Sheep Syndesmochorial or Epitheliochorial
6 - +++
Dog Endotheiochorial 4 + ++
Rat, Mouse Haemochorial 4 + ++
Rabbit, Guinea pig Haemochorial 2 +++a -
Man, Monkey Haemochorial 2 +++a -
a
Yolk sac route.
Sow colostrum’s multi-faceted immunological value for the suckling piglet has been extensively studied (Speer et al., 1959; Payen and Marsh, 1962; Leece and Morgan, 1962; Hardy, 1965; Butler, 1979; Werhahn et al., 1981; Klobasa et al., 1981, 1986). The
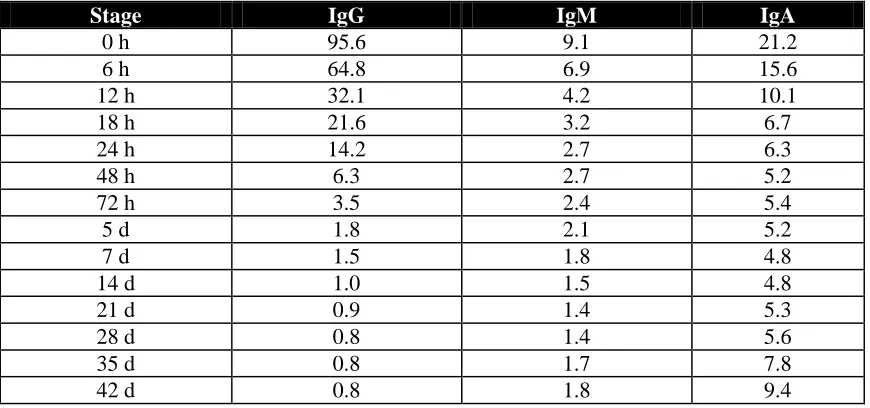
immunoglobulins of porcine colostrum provide the major antimicrobial protection against microbial infections and confer a passive immunity to the newborn calf until its own immune system matures. IgG constitutes the predominant (see Table 5) colostral Ig in porcine
Table 5. Concentration (mg/ml) of IgG, IgM and IgA in sows’ whey during lactation (Adapted from Klobasa et al., 1987).
Stage IgG IgM IgA
0 h 95.6 9.1 21.2
6 h 64.8 6.9 15.6
12 h 32.1 4.2 10.1
18 h 21.6 3.2 6.7
24 h 14.2 2.7 6.3
48 h 6.3 2.7 5.2
72 h 3.5 2.4 5.4
5 d 1.8 2.1 5.2
7 d 1.5 1.8 4.8
14 d 1.0 1.5 4.8
21 d 0.9 1.4 5.3
28 d 0.8 1.4 5.6
35 d 0.8 1.7 7.8
42 d 0.8 1.8 9.4
Others researchers (Porter, 1969; Curtis and Bourne, 1971) have reported values of 80% IgG, 15% IgA and 5% IgM of the total immunoglobulins present in porcine colostrum. Of the total protein content in porcine colostrum, 60 to 70% is comprised by immunoglobulins (Svendsen et al., 1971). IgG half life has been reported to be 9.7 days (Frenyo et al., 1981), 10 days (Klobasa et al., 1981) and 14 days (Curtis and Bourne, 1973). After 10 days of age, piglets are capable of producing their immunoglobulins and most of the immunoglobulins produced are of the IgM class with lesser quantities of IgA produced (Allen and Porter, 1973).
were given various quantities of purified swine IgG during the first day of life. Finally, 41 naturally reared piglets that failed to survive in their natural environment were recorded. In group A, peak serum immunoglobulin levels were reached 12 h after beginning of suckling. Absorption of immunoglobulins was directly related to the length of time the piglets were removed from the sow, the decrease being caused by the decrease of immunoglobulin levels in colostrum. In piglets deprived of colostrum, only IgM was present in serum at birth but all thee isotopes were present by one week. Administration of 3.5 g of swine IgG had the same effect on synthesis of all thee isotypes as was observed in the naturally reared animals. Nearly all of the 41 piglets in the group which failed to survive were shown to have absorbed only 10 to 50% as much immunoglobulins as their age-matched surviving controls in the first 12 h after suckling.
THE ROLE OF THE MHC CLASS I-RELATED PORCINE NEONATAL Fc RECEPTOR IN THE UPTAKE AND TRANSPORT OF IMMUNOGLOBULIN G
Immunoglobulins (Ig) are composed of two heavy and two light chains each of which contains an NH2-terminal antigen-binding variable domain and a COOH-terminal constant
super family by virtue of containing constant or C1- set domains. It is called “neonatal” because its expression can be found in the first few days post-birth and declines with age.
Fridman (1989) has described FcR for all Ig classes in mice and humans: IgG (FcᵞR),
IgE (Fc€R), IgA (FcαR), IgM (FcµR) and IgD (FcδR) and also reported that these receptors
are found on all cell types of the immune system. These types of FcR react with IgG.
FcᵞRI is a high-affinity receptor binding IgG monomers whereas FcᵞRII and FcᵞRIII
are low affinity receptors (Fridman, 1991). Two receptors involved in transepithelial transport of Ig have been characterized by the cloning of their respective cDNA’s. Mostov and co-workers (1984) reported that the poly-Ig receptor (poly-Ig-R) mediates transcellular transport of polymeric IgA and IgM into external secretions. This receptor is composed of five Ig-like external domains and a TM region followed by a short IC tail. FcᵞR mediates the transport of maternal IgG intact across cellular barriers between mother and offspring, avoiding
degradation during transport (Simister and Mostov, 1989; McCarthy et al., 2000). This transport is located at the duodenum and jejunum level where enterocytes express a surface membrane receptor (Borvak et al., 1998) able to bind the Fc portion of the IgG molecule and to facilitate transcytosis of these immunoglobulins (Van de Perre, 2003).
FcᵞR and FcRn (neonatal Fc receptor) proteins are specific for IgG. FcRn is a type I
This high affinity ensures that FcRn can efficiently transport IgG. A striking difference between FcRn and the others FcRs is that FcRn is a heterodimer. Its light chain is β2 (Simister
and Rees, 1985) microglobulin which is the same light chain that is associated with class I major histocompatability complex (MHC) molecules (Figure 1a). The heavy chains of both FcRn and class I MHC molecules consist of thee extracellular domains, α1, α2, and α3 (Simister and Mostov, 1989a; Bjorkman and Parham, 1990), followed by a transmembrane region and a short cytoplasmic sequence. Simister and Mostov (1989a) reported that although the extracellular region of FcRn and class I MHC molecules exhibits low but significant sequence similarity (22-30% identity for the α1 and α2 domains; 35-37% for the α3 domain), the transmembrane and cytoplasmic regions of the two types of proteins show no detectable sequence similarity. MHC class I molecules have no reported function as Ig receptors, instead they bind and present short peptides to T cells (Townsend and Bodmer, 1989). Burmeiser and co-workers (1994a) reported: a) the crystal structure of rat FcRn confirmed that the overall fold is very similar to that of class I MHC molecules, such that the α1 and α2 domains form a platform of eight anti-parallel β-strands topped by two long α-helices and the α3 and β2m domains are β-sandwich structures similar to antibody or C1-set domains (figure 1a) and b) a
dimer of FcRn heterodimers mediated by contacts between α3 and β2m domains was observed
µM concentrations and therefore it was assumed that the high protein concentrations required for crystallization could induce formation of the FcRn dimer in the absence of IgG.
INTESTINAL MACROMOLECULAR TRANSMISSION AND CLOSURE IN NEONATAL PIGS
The prenatal pig intestine is similar to the neonatal pig intestine in that colostrum stimulates both the macromolecule absorption and the cessation of macromolecule uptake (intestinal closure) (Sangild et al., 1999).
Neonatal mortality is very high in farm animals (approximately 10%) and disease resistance is greatly influenced by an adequate passive immunization just after birth. In piglets, foals, calves and lambs, the intestinal absorption of immunoglobulins from their mother's colostrum occurs mainly by a non-specific endocytosis of macromolecules, but the details of the absorption process, and the mechanisms regulating its cessation after 1-2 days of colostrum exposure, remain poorly understood (Sangild (2003). In both normal and
'compromised' (premature, growth-retarded, hypoxic, lethargic) newborn farm animals, the intestinal capacity to absorb macromolecules is influenced by both diet- and animal-related factors. Thus, macromolecule uptake is severely reduced in response to premature birth and when macromolecules are to be absorbed from diets other than species-specific colostrum. On the other hand, fetal growth retardation, in vitro embryo production, or stressful birth
processes are unlikely to reduce the ability of the intestine to absorb immunoglobulins from colostrum. More knowledge about the diet- and animal-related factors affecting intestinal immunoglobulin uptake will improve the clinical care of 'compromised' newborn farm animals.
protection via the absorption of immunoglobulin G (IgG). Jensen and co-workers (2001) investigated the intestinal growth, IgG absorptive capacity and enzyme activities in newborn pigs in response to different diets. Newborn piglets were bottle-fed porcine colostrum (PC), bovine colostrum (BC), porcine plasma (PP), porcine milk (PM), bovine colostrum containing porcine plasma (BCP) or a milk replacer (MR) every 3 h (15 mL/kg) for up to 2 d. Bovine serum albumin (BSA) was added to the diets as a macromolecule marker. The percentage of absorbed BSA just after birth was highest for piglets fed the PC diet (30-50%), lower for those fed the BC and BCP diets (23-30%) and lowest for the PP, PM and MR diet-fed piglets (7-20%, P < 0.05 relative to those fed colostrum). Porcine IgG was absorbed more efficiently than bovine IgG. Intestinal closure occurred earlier in MR and BCP piglets (within 12 h after birth) than in PC pigs. At 2 d of age, intestinal mucosal weight (+120% increase from birth) and villus morphology were similar in the PC, BCP and MR groups. All 3 groups also had increased aminopeptidase A activity compared with values at birth (+100% increase).
Compared with PC pigs, the BCP group had higher sucrase and maltase activities (+50% and +200%, respectively) and lower aminopeptidase N activity (-50%, P < 0.05). Similarly, MR pigs showed elevated sucrase activity (+40%) and lowered maltase, lactase and
Rundell and Lecce (1971) reported that intestinal cell epithelial cell turnover and closure are unrelated in species other than the rat. They concluded that the turnover time of porcine intestinal epithelium to be about five days and that intestinal closure (uptake and transport) occurred before the initial cell population was replaced. Others have reported the process of incorporation of IgG into the neonatal’s circulation stops when the enterocytes are unable to discard the absorbed IgG though the lateral membranes. Moon (1971) supported Rundell and Lecce’s (1971) conclusion that closure in piglets results from changes in the properties of intestinal epithelium in situ rather from a replacement of cells. It is possible that the intestinal epithelial cells of the neonatal pig retain their capacity to uptake macromolecules throughout their lifespan but unlike the rat, they lose their ability to transport macromolecules to the circulation some time before they are shed from the villi.
Various factors have been determined to have an impact on intestinal closure in neonatal piglets.
1. Starvation: piglets feed either porcine or bovine colostrum lost their capacity to uptake and transport macromolecules within 12 to 36 h post-partum while starved piglets retained their capacity for up to 106 h (Lecce et al., 1973).
3. Iron: Bokhout and Stok (1980) administered dextran coupled iron to neonatal piglets immediately after birth and prior to nursing and they found a reduction of IgG uptake from colostral milk.
4. Carbohydrates: Broughton and Lecce (1970) found that glucose induced intense pinocytotic activity in the intestinal epithelial cells of the jejunum just like colostrum had. They conducted a study comparing the effects on macromolecular uptake of 125 I-PVP by feeding either a 5% glucose/electrolyte solution or a commercial milk
replacer for the first 24 to 48 h post-partum and prior to colostrum administration to macromolecular uptake in piglets fed colostrum from birth. They determined that piglets fed colostrum from birth absorbed 50% of their test dose within six h post-partum and there was a rapid increase in serum IgG levels. Piglets that received the glucose/electrolyte solution absorbed 40% of their test dose administered 24 h or 36 h post-partum and had similar serum IgG levels to the colostrum fed piglets. However the piglets fed a milk replacer absorbed only 10% of their test dose and essentially no IgG levels.
immunoreactive insulin concentration. They speculated that insulin may be involved in closure by initiating the synthesis of membrane structural proteins in the
enterocytes.
SYNTHESIS OF GLUTAMINE AND ITS ROLE IN METABOLISM AND PHYSIOLOGY
Glutamine is one of the 20 amino acids encoded by the standard genetic code. Its side chain is an amide formed by replacing the side-chain hydroxyl of glutamic acid with an amine functional group. It can therefore be considered the amide of glutamic acid. Its codons are CAA and CAG. In human blood and pig plasma, glutamine is the most abundant free amino acid with a concentration of about 500-900 µmol/l and 500-600 µmol/l respectively. Herbert (1966) reported that the tissue concentrations of most amino acids are of the same order as the plasma concentration with five exceptions (glutamate, glutamine, aspartate, alanine and glycine) in the case of rat tissues. The tissue concentrations of these five exceptional amino acids can be 10 to 50 times higher than the plasma concentration. Another significant observation is that is the most abundant AA in sow’s milk and second most abundant AA in milk proteins (Wu and Knabe, 1994; Haynes et al., 2009). Li et al. (2009b) reported that glutamine is synthesized from branched-chain AA (BCAA) and glucose-derived α
Figure 2. Pathways of glutamine synthesis in pigs. Enzymes that catalyze the indicated reactions are: 1) BCAA transaminase; 2) branched-chain α-ketoacid dehydrogenase; 3) glutamine synthetase; 4) glutamate-oxaloacetate transaminase; 5) glutamate-pyruvate transaminase; 6) asparagine synthetase; 7) glucose metabolism via glycolysis and the Krebs cycle; 8) protein synthesis. (Li et al., 2009b).
Skeletal muscle is the major site of de novo synthesis of glutamine in animals whereas in the intestine of neonatal and adult pigs, the synthesis is negligible (Haynes et al., 2009; Li et al., 2009a). The two major sites of extensive glutamine usage are the enterocytes of the small intestine (Wu et al., 1995) and bacteria present in the lumen of the intestine (Dai et al., 2010). The small intestine is not only responsible for terminal digestion and absorption of
providing ATP for intracellular protein turnover, nutrient transport though the plasma membrane, cell growth and migration, as well as the maintenance of cell integrity (Curthoys and Watford, 1995). Results reported by Windmueller and Spaeth (1980) in adult rat small intestine, CO2, lactate, alanine and glucose account for 56-64, 16-20, 4-8 and 2-10% of the
total catabolized carbons of luminal glutamine, glutamate and aspartate, respectively. These results indicate that amino acids, rather than glucose, are the major fuel for the small intestinal mucosa.
The other major known functions of Glutamine are:
1. Precursor for the synthesis of purine and pyrimidine which are essential for intraepithelial lymphocytes, embryonic cells and trophoblasts (Curi et al., 2005). 2. Precursor for the synthesis of arginine (Wu et al., 1995).
3. Increases the expression of genes (ornithine decarboxylase, heat-shock proteins, and nitric oxide synthase) that regulate nutrient metabolism, antioxidative response, and cell survival (Curi et al., 2005; Haynes et al., 2009).
4. Precursor of ornithine though the stimulation of ornithine decarboxylase (ODC), the rate limiting enzyme in polyamine synthesis which is required for intestinal cell proliferation and repair.
5. Enhances the activity of the mammalian target of rapamycin (mTOR), a protein kinase that regulates intracellular protein synthesis.
7. Precursor for the synthesis of N-acetylglucosamine-6-phosphate, a common substrate for the synthesis of glycoproteins such as mucins that are particularly rich in intestinal mucosal cells and glutathione, the most abundant small-molecular-weight antioxidant in cells (Reeds and Burrin, 2001). (Figure 3).
Figure 3. Possible mechanisms responsible for the beneficial effect of glutamine in intestinal barrier function and growth (adapted from Wu, 2007).
Hosam et al. (1991) studied the effect of L-glutamine, the principal intestinal fuel, on proliferation of a porcine jejunal cell line, IPEC-J2. They found that in cells synchronized by serum deprivation for 4 h, glutamine stimulated ornithine decarboxylase (ODC) in a dose- and time-dependent manner, with maximal effects at 10mM in 3 h (P < 0.01). Similar effects were seen for the structurally related amino acid L-asparagine and serum. The glutamine
β
Rhoads and others (1997) found that ambient glutamine concentration regulates proliferative rate of rat IEC-6 cells whereas additional glutamine provides a mitogenic trigger. They altered glutamine concentration within the physiological range immediately after cells were plated, allowed cells to attach overnight and subsequently measured 3H thymidine incorporation for 24 h. Four levels of glutamine were chosen: 0 mM, 0.7 mM to mimic levels in plasma, 2.5 mM to mimic levels in standard tissue culture media and 3.5 mM to mimic maximum levels in porcine colostrum and levels in the intestinal mucosa. Figure 5 indicates that when the ambient concentration of glutamine was 0.7 mM, steady-state thymidine
incorporation was maximal (15-fold the rate in media without glutamine; P < 0.001). After the overnight incubation in media with the four different glutamine concentrations, the
Figure 5. Thymidine incorporation assay of IEC-6 cells preincubated with different
concentrations of glutamine. IEC-6 cells were preincubated overnight in glutamine at 0, 0.7, 2.5 or 10 mM. Glutamine (2.5 mM) was added with 3H thymidine 24 h later and radiolabel incorporation was determined. (Rhoads et al., 1997).
epithelium. TGE-infected porcine intestine has markedly reduced brush-border enzymatic activities and impaired Na+ and CL- absorption.
Figure 6. Illustration of the mechanisms of Na+ absorption across intestinal epithelial cells. GLUT2 = Glucose transporter 2. ORS = Oral Rehydration Solution (Moeser, 2006).
Coeffier et al. (2005) studied the effect of glutamine on jejunal absorption during hypersecretion in six healthy individuals assessed with a triple-lumen tube either at baseline or during PGE1-induced hypersecretion (0.1 µg.kg-1.min-1) in random order. Isosmolar solutions
solution (P < 0.05). PGE1-induced hypersecretion was reduced (P < 0.05) by solutions of
alanine-glucose, glutamine-glucose and glutamine 90 mM and reversed to absorption by alanine-glucose and glutamine-glucose (Figure 7). They concluded that glutamine stimulates water and electrolyte absorption in human jejunum, even during experimental hypersecretion. These results support considering the use of glutamine-containing solutions for the
Figure 7. Water (top) and sodium (bottom) net fluxes in six healthy humans studied during baseline and PGE1-induced hypersecretion. Negative values denote net secretion into jejunal
These results are in agreement with those found by Hoffman and others (2010). They studied the effect of acute L-alanyl-L-glutamine (AG; SustamineTM) ingestion on performance changes and markers fluid regulation, immune, inflammatory, oxidative stress, and recovery in response to exhaustive endurance exercise, during and in the absence of dehydration. Ten physically active males (20.8± 0.6 yr, 77.4 ± 10.5 kg and 12.3 ± 4.6% body fat) participated in the study. In the first visit (T1), blood was withdrawn and performed maximal exercise as a baseline (BL). In the next 4 trials, they were rehydrated to -2.5% of their baseline body mass. For T2, subjects achieved their goal weight and were not rehydrated. During T3-T5, subjects reached their goal weight and then rehydrated to 1.5% of their baseline body mass by drinking either water (T3) or two different doses (T4 and T5) of the AG supplement (0.05 g.kg-1 and 0.2 g.kg-1, respectively). They were then asked to exercise until they elicit 75% of their VO2
max. During T2-T5 blood draws occurred once goal body mass was achieved (DHY), immediately prior to the exercise stress (RHY), and immediately following the exercise protocol (IP). Blood samples were analyzed for glutamine, potassium, sodium, aldosterone, arginine vasopressin (AVP), C-reactive protein (CRP), interleukin-6 (IL-6), malondialdehyde (MDA), testosterone, cortisol, ACHT, growth hormone and creatine kinase. Results showed significantly greater glutamine concentrations for T5 than T2-T4 at RHY and IP (Figure 8). When they examined performance changes (difference between T2-T5 and T-1), significantly greater times to exhaustion occurred during T4 and T5 compared to T2 (Figure 9), they
Figure 9. Δ Time to exhaustion. * = significantly different from ΔT2. T2 = not rehydrated, T3 = rehydrated with drinking water, T4 = rehydrated with a solution of L-alanyl-L-glutamine (AG; SustamineTM) at 0.05 g.kg-1 and T5 = rehydrated with a solution of L-alanyl-L-glutamine (AG; SustamineTM) at 0.2 g.kg-1. (Hoffman et al., 2010).
FORWARD REFLECTIONS ON THESIS RESEARCH WITH PRACTICAL IMPLICATIONS
The study of the impact of lactation length and weaning weight on long-term growth and viability of the progeny without adjusting for the birth weight effect has never been studied and is the subject of thesis chapter 2. It is of extreme importance for
breeding stock companies to determine the value of 1 kg of body weight extra at weaning. This will allow them to make an informed decision in terms of how much selection
confounded with subsequent growth performance. Understanding the effect of the time pigs spend with the sow on subsequent health and growth will allow swine professionals to determine the most efficient weaning age of the progeny. This understanding has significant financial implications.
Due to the increased litter size of modern maternal genotypes, it is more crucial than ever to understand the importance of managing sow colostrum and/or colostrum replacement products to maximize piglet’s health and consequently survival during the suckling period and beyond (the subject of thesis chapters 3 & 4). Colostrum itself plays primary role in the
induction of intestinal closure. The formation of colostrum in the sow begins about one month prepartum with an intensive transfer of immunoglobulins from the serum to the udder
(Jonsson, 1973). This process virtually ceases after parturition resulting in a sharp decrease of the IgG concentration in the colostrum (Frenyo et al., 1981; Klobasa et al., 1986). Blecha and co-workers (1998) indicated that the IgG concentration of colostrum is highest during the birth process and decreases during the first day of lactation. These authors also confirmed that IgG absorption by the piglet starts declining 24 h postpartum. Accordingly, if there is an interest in supplementing a colostrum replacement product, it must be provided immediately after birth.
indicate that strong consideration must be given to Gln and glutamate as a nutritionally essential amino acid for post-weaning pig diets.
LITERATURE CITED
1. Allen, W.D. and P. Porter. 1973. The relative distribution of IgM and IgA cells in intestinal mucosa and lymphoid tissues of the young unweaned pig and their significance in ontogenesis of secretory immunity. Immunolology. 24:493. 2. Argenzio, RA., J.M. Rhoads, and M. Armstrong. 1994. Glutamine stimulates
prostaglandin-sensitive Na+-H+ exchange in experimental porcine cryptosporidiosis. Gastroenterology 106:1418-1428.
3. Auldist, D.E., L. Morrish, P. Eason and R.H King. 1998. The influence of litter size on milk production of sows. J. Anim. Sci. 67:333-337.
4. Auldist, D.E., D. Carlson, L. Morrish, C.M. Wakeford and R.H King. 2000. The influence of suckling interval on milk production. J. Anim. Sci. 678:2026-2031. 5. Averette, L.A., J. Odle, M.H. Monaco and S.D. Donovan. 1999. Dietary fat during
pregnancy and lactation increases milk fat and IGF-1 concentrations and improves neonatal growth rates in swine. J. Nutr. 129:2123-2129.
6. Bauman, D.E. and W.B. Curie. 1980. Partitioning of nutrients during pregnancy and lactation: A review mechanisms involving homeostasis and homeorhesis. J. Dairy Sci. 63:1514-1529.
8. Bland, I.M., J.A. Rooke, A.G. Sinclair, V.C. Bland and S.A. Edwards. 2001. Effects of supplementing the maternal diet with vitamins and vaccinating the sow on
immunoglobulin G concentrations in piglet plasma. Proc. Nutr. Soc. 60:72A (Abstr.)
9. Blecha, F. 1998. Immunological aspects: comparison with other species. In: Verstegen, M.W.A., Moughan, P.J., Schama, J.W. (eds.), the lactating sow. Wageningen Pers, Wageningen, pp.23-44.
10.Bokhout, B.A and W. Stok. 1980. Does a drug administered by oral route affect the transfer of maternal antibodies in piglets. Tijdsch. Diergeneesk 105:197-191.
11.Borvak, J., J. Richardson, C. Medesan, F. Another, C. Radu, M. Simionescu, V. Gethie and E.S. Ward. 1998. Functional expression of the MHC class-I related receptor, FcRn, in endothelial cells of mice. Int. Immunol. 10:1289-1298.
12.Boyd, R.D., B.D. Moser, A.J. Lewis, E.R. Peo Jr., R.K. Johnson and R.D. Nimmo. 1981. Effects of maternal dietary energy source on glucose homeostasis, liver glycogen and carcass lipid in the neonatal pig. J. Anim. Sci. 53:1316-1324. 13.Broughton, C.W and J.G Lecce. 1970. Electron microscopic studies of the jejunal
epithelium from neonatal pigs fed different diets. J. Nutr. 100:445-449.
14.Burmeiser, W.P., L.N. Gastinel, N.E, Simister, M.L. Blum and P.J. Bjorkman. 1994a. The 2.2 Å crystal structure of the MHC-related neonatal Fc receptor. Nature 372:336-343.
16.Butler, J.E. 1979. Immunologic aspects of breast feeding, anti-infectious activity of breast milk. In: T.K. Oliver and T.H. Kirschbaum (ed.) Human Lactation. Semin. Perinatol. 3:255.
17.Cabrera, R.A, R.D. Boyd, S. B. Jungst, E. R. Wilson, M.E. Johnston, and J. L. Vignes, and J. Odle. 2010. Impact of lactation length and piglet weaning weight on long-term growth and viability of the progeny. J. Anim. Sci. 88:2265-2276.
18.Chiston, R., G.Saminadin, H. Lionet and B. Bacon. 1999. Dietary fat and climate alter food intake, performance of lactating sows and their litters and fatty acid composition of milk. J. Anim. Sci. 69:353-365.
19.Coeffier, M., B. Hecketsweiler, P. Hecketsweiler, and P. Dechelotte. 2005. Effect of glutamine on water and sodium absorption in human jejunum at baseline and during PGE1-induced secretion. J. Appl. Physiolo. 98:2163-2168.
20.Coffey, M.T., R.W. Seerley, R.J. Martin and J.W. Mabry. 1982. Effect of level, source, and duration of feeding of supplemental energy in sow diets on metabolic and hormonal traits related to energy utilization in the baby pig. J. Anim. Sci. 55:329-336. 21.Curi, R., C.J. Lagranha, S.W. Doi, D.F. Sellitti, J. Procopio, T.C. Curi, M. Corless and
P. Newsholme. 2005. Molecular mechanisms of glutamine action. J. Cell Physiol. 204:392-401.
24.Dai, Z.L., J. Zhang, G. Wu and W.Y. Zhu. 2010. Utilization of amino acids by bacteria from the small pig intestine. Amino acids. Doi: 10 1007 / s00726-010-0556-9.
25.Devillers, N., C. Farmer, J. Le Dividich and A. Prunier. 2007. Variability of colostrum yield and colostrum intake in pigs. Animal 1:1033-1041.
26.Farmer, C and H. Quesnel. 2009. Nutritional, hormonal and environmental effects on colostrum in sows. J. Anim. Sci. 87:56-65.
27.Farmer, C and M.T. Sorensen. 2001. Factors affecting mammary development in gilts. Livest. Prod. Sci. 70:141-148.
28.Frenyo, V., G. Pethes, T. Antal and I. Szabo. 1981. Changes in colostral and serum IgG content in swine in relation to time. Veterinary Research Communications 4:275-282.
29.Fridman, W.H. 1991. Fc receptors and immunoglobulins binding factors. FASEB J. 5:2684-2690.
30.Fridman, W.H. (ed). 1989. Structures and functions of low affinity Fc receptors. Chem. Immunol. 47:1-258.
31.Gaskins, H.R. 1998. Immunological development and mucosal defense in pig
intestine. Pages 81-102 in Progress in pig science. J. Wiseman, M.A. Varley and J.P. Chadwick, ed. Notingham Univ. Press, Notingham, UK.
33.Halliday, R. 1959. The effect of steroid hormones on the absorption of antibody in the young rat. J. Endocrinology 18:56-66.
34.Hardy, R.N. 1965. Intestinal absorption of macromolecules in the newborn pig. J. Physiol. 176:19.
35.Harrell, R.J., M.J. Thomas, and R.D. Boyd. 1993. Limitations of the sow milk yield on baby pig growth. Pages 156-164 in Proc. 1993 Cornell Nutr. Conf. Feed
Manufacturers. Cornell University, Ithaca, N.Y.
36.Hartmann, P.E., I. McCauley, A.D. Gooneratne and J.L. Whitley. 1984. Inadequacies of sow lactation: Survival of the fittest. In: M. Peaker, R.G. Vernon and C.H. Knight (Ed.) Physiological strategies during lactation. Pp. 301-326. Academic Press, London, UK.
37.Heo, S., Y.X. Xang, Z. Jin, M.S. Park, B.K. Yang and B.J. Chae. 2008. Effects of dietary energy and lysine intake during late gestation and lactation on blood metabolites, hormones, milk composition and reproductive performance in primiparous sows. Can. J. Anim. Sci. 88:247-255.
38.Hoffman, J.R., N. A. Ratames, J. Kang, S.L. Rashti, N. Kelly and A. Gonzalez. 2010. Journal of the international society of sports nutrition7:8.
L-40.Huber, A.H., R.F. Kelley, L.N. Gastinel and P.J. Bjorkman. 1993. Crystallization and stoichiometry of binding a complex between a rat intestinal Fc receptor and Fc. J. Mol. Biol. 230:1077-1083.
41.Jackson, J.R., W.L. Hurley and R.A. Easter, A.H. Hansen and J. Odle. 1995. Effects of induced or delayed parturition and supplemental dietary fat on colostrum and milk composition.J. Anim. Sci. 73:1906-1913.
42.Jensen, A.R., J. Elnif, D.G. Burrin and P.T. Sangild. 2001. Development of intestinal immunoglobulin absorption and enzyme activities in neonatal pigs is diet dependent. J. Ntr. 131 (12): 3259-3265.
43.Jensen, P., G. Sangel and B. Algers. 1991. Nursing and sucking behavior of semi-naturally kept pigs during the first 10 days of post-partum. Appl. Anim. Behav. Sci. 31:195-203.
44.Jones, E.A. and T.A. Waldman. 1972. The mechanism of intestinal uptake and transcellular transport of IgG in the neonatal rat. J. Clin. Invest. 51:2916-2927.
45.Jonsson, A. 1973. Transfer of immunoglobulins from mother to offspring in the pig. Acta vet. Scand. Suppl. 43:1-64.
46.Kerbert, J.D., R.A. Coulson and T. Fernandez. 1966. Free amino acids in caiman and rat. Comp. Biochemi. 17:583-598.
48.King, R.H., B.P. Mullan, F.R. Dunshea and H. Dove. 1997. The influence of piglet body weight on milk production of sows. Livest. Prod. Sci. 47:169-174.
49.Klobasa, F. J.E. Butler, E. Werhahn and F. Habe. 1986. Maternal-neonatal
immunoregulation in swine: Influence of multiparity on the novo immunoglobulin synthesis by piglets. Vet. Immunol. Immunopathol. 11:149-159.
50.Klobasa, F., E. Werhahn and J.E. Butler. 1987. Composition of sow milk during lactation. J. Anim. Sci. 64:1458-1466.
51.Klobasa, F., J.E. Butler, E. Werhahn and F. Habe. 1986. Maternal-neonatal immunoregulation in swine.II. Influence of multiparity on de novo synthesis by piglets. Vet. Immunol. Immunopath. 11:149.
52.Klobasa, F., F. Habe, E. Werhahn and J.E. Butler. 1981. Regulation of humoral immunity in the piglet by immunoglobulin of maternal origin. Res. In Vet. Sci. 31:195-206.
53.Korhonen, H., P. Marnila and H.S. Gill. 2000. Bovine milk antibodies for health. British Journal of Nutrition 84: S135-S146.
54.Lecce, J.G and C.W. Broughton. 1973. Cessation of uptake of macromolecules by neonatal guinea pig, hamster and rabbit intestinal epithelium (closure) and transport to the blood. J. Nutrition 103:744-750.
57.Li, P., D.A. Knabe, S.W. Kim, C.J. Lynch, S.M. Hutson and G. Wu. 2009b. Lactating porcine mammary tissue catabolizes branched-chain amino acids for glutamine and aspartate synthesis. J. Nutr. 139:1502-1509.
58.Li, X.L., F.W. Bazer, H. Gao, W. Jobgen, G.A. Johnson, P. Li, J.R. McKnight, M.C. Satterfield, T.E. Spencer and G. Wu. 2009a. Amino acids and gaseous signaling. Amino acids 37:65-78.
59.Mackenzie, N.M. and K.D. Keeler. 1984. Isotype specificity in the binding of mouse
immunoglobulins to brush borders isolated from the neonatal mouse small intestine. Biochem. Soc. Trans. 12:747.
60.Mahan, D.C. 1993. Effect of weight, split-weaning, and nursery feeding programs on performance responses of pigs to 105 kilograms body weight and subsequent effects on sow rebreeding interval. J. Anim. Sci. 71:1991-1995.
61.Mahan, D.C., and A.J. Lepine. 1991. Effect of weaning weight and associated nursery feeding programs on subsequent performance to 105 kilograms of body weight. J. Anim. Sci. 69: 1370-1378.
62.Mateo, C.D., D.N. Peters and H.H Stein. 2004. Nucleotides in sow colostrum and milk at different stages of lactation. J. Anim. Sci. 82:1339-1342.
63.McCarthy, K.M., Y. Yong and N.E. Simister. 2000. Bidirectional transcytosis of IgG by the rat neonatal Fc receptor expressed in a rat kidney cell line: a system to study protein transport across epithelia. Journal of Cell Science 113:1277-1285.
Transport". PhD Dissertation. Department of Population Health and Pathobiology.
College of Veterinary Medicine. North Carolina State University, Raleigh, NC 27695. 65.Moon, H.W. 1971. Epithelial cell migration in the alimentary mucosa of the suckling
pig. Proceedings of the society of experimental biology and medicine137:151-154. 66.Mostov, K.E., M. Friedlander, G. Blodel. 1984. The receptor for transepithelial
transport of IgA and IgM contains multiple immunoglobulin-like domains. Nature 308:37-43.
67.Mostov, K.E. and N.E. Simister. 1985. Transcytosis. Cell43;389-390.
68.Newsholme, P., R. Curi, T.C. Pithon Curi, C.J. Murphy, C. Garcia and M. Pires de Melo. 1999. Glutamine metabolism by lymphocytes, macrophages and neutrophils: its importance in health and disease. J. Nutr. Biochem. 10:316-324.
69.Newsholme, P. 2001. Why is L-glutamine metabolism important to cells of the
immune system in health, post injury, surgery or infection? J. Nutr. 131:2515S-2522S. 70.Odle, J., R.T. Zijlstra and S.M. Donovan. 1996. Intestinal effects of milkborne growth
factors in neonate of agricultural importance. J. Anim. Sci. 74:2509-2522.
71.Payne, L.C and C.L. Marsh. 1962. Gamma globulin absorption in the baby pig: The non-selective absorption of heterologous globulins and factors influencing absorption time. J. Nutr. 76:151.
73.Popov, S., J.G. Hubbard, J.K. Kim, B. Ober, V. Gethie and E.S. Ward. 1996. The stoichiometry and affinity of murine Fc fragments with the MHC class I-related receptor, FcRn. Mol. Immunol. In Press.
74.Porter, P. 1969. Transfer of immunoglobulins IgG, IgA and IgM to lacteal secretions in the parturient sow and their absorption by the neonatal pig. Biochim. Byophys. Acta. 181:381.
75.Raghavan, M., V.R. Bonagura, S.L. Morrison and P.J. Bjorkman. 1995a. Analysis of the pH dependence of the neonatal Fc receptor/immunoglobulin G interaction using antibody and receptor variants. Biochemistry 34:14649-14657.
76.Raghavan, M., Y. Wang and P.J. Bjorkman. 1995b. Effects of receptor dimerization on the interaction between the class I MHC related Fc receptor and immunoglobulin G. G. Proc. Natl.Acad. Sci. 92:11200-11204.
77.Raghavan, M. and P.J. Bjorkman. 1996. Fc Receptors and their interactions with immunoglobulins. Annu. Rev. Cell Dev. Biol. 12:181-220.
78.Redman, D.R. 1979. Prenatal influence of immunocompetence of the neonate. J. Anim. Sci. 49:258-267.
79.Reeds, P.J. and J. Odle. 1996. Pigs as models for nutrient functional interaction. In: Advances in Swine in Biomedical Research (M. Tumbleson and L. Schook, eds.) Plenum Press, New York.
80.Reeds, P.J. and D.G. Burrin. 2001. Glutamine and the bowel. J. Nutr. 131:2505-2508. 81.Rhoads, J.M., A.D. Cox, R.A. Argenzio, W. Chen, H.M. Berschneider, J.K. Westwick,
proliferation and activates mitogen-activated protein kinases. The American Physiological Society: G943-953.
82.Rodewald, R. and J.P. Kraehenbuhl. 1984. Receptor mediated transport of IgG. J. Cell. Biol. 99:159-164.
83.Rogero, M.M., P. Borelli and R.A. Fock. 2010. Effects of glutamine on the Nuclear Factor-kappa B (NFkB) signaling pathway of murine peritoneal macrophages. Amino acids 39(2): 435-441.
84.Sangild, P.T., J.f. Trahair, M.K. Loftager and A.L. Fowden. 1999. Intestinal
macromolecular absorption in the fetal pig infusion of colostrum in utero. Pediatr Res. 45: 595-602.
85.Sangild, P.T. 2003. Uptake of colostral immunoglobulins by the compromised newborn farm animals. Acta Vet Scan Suppl 98:105-122.
86.Simister, N.E. and A.R Rees. 1985. Isolation and characterization of an Fc receptor from neonatal rat small intestine. Eur. J. Immunol. 15:733-738.
87.Simister, N.E. and K.E. Mostov. 1989. An Fc receptor structurally related to MHC class I antigens. Nature 337:184-187.
90.Speer, C.V., H. Brown, L. Quinn and D.V. Catron. 1959. The cessation of antibody in the young pig. J. Immunol. 83:632.
91.Spencer, J.D., R.D. Boyd, R. Cabrera and G.L. Allee. 2003. Early weaning to reduce tissue mobilization in lactating sows and milk supplementation to enhance pig weaning weight during extreme heat stress. J. Anim. Sci. 81:2041-2052. 92.Stormont, C. 1972. The role of maternal effects in animal breeding: I. Passive
immunity in newborn animals. J. Anim. Sci. 35:1275-1279.
93.Svendsen, J., E. Ewert and M.R Wilson. 1971. Immunity to Escherichia coli in pigs: the protein levels in secretions from individual mammary glands of sows during the first seven days of lactation. Vet. Sci. 12:448.
94.Svendsen, L.S., B.R. Westrom, J. Svendsen, B.G. Ohlsson, R. Ekman and B.W. Karlsson. 1986. Insulin involvement in intestinal macromolecular transmission and closure in neonatal pigs. J. Ped. Gastr. Nutr. 5:299-304.
95.Townsend, A. and H. Bodmer. 1989. Antigen recognition class I-restricted T lymphocytes. Annu. Rev. Immunol. 7:601-624.
96.USDA. 2007. National Swine Survey: Morbidity/mortality and health management of swine in the U.S. National Animal Health Monitoring System, Animal and Plant Health Inspection Service. Veterinary Services. Washington, DC.
97.USDA. 1993. Transfer of maternal immunity to calves. Unites States Department of Agriculture. Animal and Plant Health Inspection Service. Veterinary Services. Washington, DC.
99.Wallace, K.H and A.R. Rees. 1980. Studies on the immunoglobulin G Fc fragment receptor from neonatal rat small intestine. Biochem. J. 188:9-16.
100. Werhahn, E., F. Klobasa and J. E. Butler. 1981. Investigations of some factors which influence the absorption of IgG by the neonatal piglet. Vet. Immunol.
Immunopath. 2:35.
101. Williams, A.F. and A.N Barclay. 1988. The immunoglobulin super family-domain for cell surface recognition. Annu. Rev. Immunol. 6:381-405.
102. Wilson, M.R. 1974. Immunologic development of the neonatal pig. J. Anim. Sci. 38:1018-1021.
103. Windmueller, H.G., and A.E. Spaeth. 1980. Respiratory fuels and nitrogen metabolism in vivo in small intestine of fed rats. Quantitative importance of glutamine, glutamate and aspartate. J. Biol. Chem. 10:107-112.
104. Wu, G and D.A. Knabe, 1994. Free and protein-bound amino acid in sow’s colostrums and milk. J. Nutr. 124:415-424.
105. Wu, G., D.A. Knabe, W. Yan and N.E, Flynn. 1995. Glutamine and glucose metabolism in enterocytes of the neonatal pig. Am. J. Physiol. 268:R334-R342. 106. Wu, G. 1998. Intestinal mucosal amino acid metabolism. J. Nutr.
128:1249-1252.
108. Yang, Y., S. Heo, Z. Jin, J. Yun, P. Shinde, J. Choi, B. Yan and B. Chae. 2008. Effects of dietary energy and lysine intake during late gestation and lactation on blood metabolites, hormones, milk composition and reproductive performance in
multiparous sows. Arch. Anim. Nutr. 62:10-21.
CHAPTER 2
IMPACT OF LACTATION LENGTH AND PIGLET WEANING WEIGHT ON LONG-TERM GROWTH AND VIABILITY OF THE PROGENY
Rafael. A. Cabrera1, R.D. Boyd2, S. B. Jungst2, E. R. Wilson2, M.E. Johnston2, and J. L. Vignes3, and J. Odle1
1
Department of Animal Science, North Carolina State University, Raleigh, NC 27695, 2Pig Improvement Company, Hendersonville, TN 37075; 3Advanced Birthright Nutrition, Delano, MN 55328.
________________________________________________________________________ This paper is published as: R. A. Cabrera, R.D. Boyd, S. B. Jungst, E. R. Wilson, M.E. Johnston, and J. L. Vignes, and J. Odle. 2010. Impact of lactation length and piglet weaning weight on long-term growth and viability of the progeny. J. Anim. Sci. 88:2265-2276.
ABSTRACT
6.4 kg; 7.3 kg; 8.2 kg; and 9.5 kg. Pigs weighing 5.5 kg at 20-d of age were able to reach 125 kg 8 d sooner (168.8 d) than those weighing 4.6 kg (176.8 d). There was a linear relationship (P < 0.05) between weaning weight and ADG in the post-nursery phase of growth. These results suggest that (1) a weaning weight of less than 5.0 kg weaning weight imposes the greatest marginal loss in production output for a 20-d weaning, and that (2) lactation length influences long-term growth, composition of growth and viability of progeny.
INTRODUCTION
Weaning weight is an important factor influencing post-weaning growth. Pigs with heavier weaning weights grow more rapidly post-weaning. Mahan and Lepine (1991) showed pigs weighing 6.8 to 8.2 kg at weaning reached 105 kg approximately 10-d earlier than pigs weighing 4.1 to 5.5 kg. This finding is consistent with Azain (1997), who observed pigs weighing on average of 5.65 kg reached 104 kg of bodyweight 7-d sooner than those weighing 4.5 kg. However it is not clear to us how weaning weight affected subsequent and viability performance when the confounding influence of birth weight was removed.
The objectives of this experiment were (1) to determine the relationship between weaning weight and growth to 125 kg; and (2) to determine the impact of time spent nursing the sow on long-term growth and viability of her progeny. The confounding effect of birth weight was removed by our procedure.
MATERIALS AND METHODS
This study was conducted at the PIC USA research farm located in Gold City, KY. The distance separating the sow farm (site I) from nursery and finish facilities is no more than 500 m. Nursery and finish facilities are on the same site (Site II). The farm’s (farrowing, nursery and finish) health status was defined as PRRS negative, Mycoplasma positive and PRV and Brucellosis negative based on serological sampling by the veterinary team in charge of health. All protocols were under the supervision of licensed veterinarians. Standard operating procedures for animal care were in accord with published guidelines for animal care (FASS, 1999). The experimental animals were not subjected to prolonged constraint or surgical procedures and were humanely treated throughout the experiment.