ABSTRACT
HOLSENBECK, STEPHANIE LEAH. H-RAS AND ITS ONCOGENIC MUTANTS RAS G12V AND RAS Q61L. (Under the direction of Dr. Carla Mattos.)
The H-Ras protein is a GTPase important to cell cycle and differentiation. Mutations in this protein have been associated with 30% of cancers. A better
H-RAS AND ITS ONCOGENIC MUTANTS RAS G12V AND RAS Q61L
By
STEPHANIE LEAH HOLSENBECK
A thesis submitted to the Graduate Faculty of North Carolina State University in partial fulfillment of the
requirements for the Degree of Master of Science
BIOCHEMISTRY
Raleigh
DEDICATION
BIOGRAPHY
ACKNOWLEDGEMENTS
TABLE OF CONTENTS
List of Tables . . . vi List of Figures . . . vii 1. Introduction and Background . . . 1-11 2. Materials and Methods . . . 11
2.1 Cloning of H-Ras 166 into pET-21a(+) . . . 11-13 2.2 Mutation of H-Ras 166 . . . 13-14 2.3 Western Blot . . . 15 2.4 Mutation of Triple Stop Codon . . . 15-16
2.5 Expression and Isolation of H-Ras 166 protein . . . 16 2.6 Anion Exchange Chromatography . . . 16-17 2.7 Size Exclusion Chromatography . . . 17 2.8 High Resolution Anion Exchange Chromatography . . . 17 2.9 Exchange Reaction . . . 17-18 2.10 Crystallization (performed by Greg Buhrman) . . . 18 2.11 Crystal Soaking in Glycerol (performed by Greg Buhrman) . . . 18-19
2.12 Structure Refinement of Q61L in Glycerol . . . 19 3. Results and Discussion . . . 19
3.1 Isolation of H-Ras 166 for Greater Yield and Purification . . . 19-21 3.2 Superimposition and Root Mean Square Deviation . . . 21-23 3.3 Aqueous vs. Q61L in Glycerol . . . 24-26 3.4 Specific Comparison of the H-Ras Mutant Soaked in Glycerol
LIST OF TABLES
Results and Discussion
1. Data collection and refinement statistics for Ras/GMPPNP Wild-Type and Ras/GMPPNP Q61L mutant in aqueous solution, Ras/GMPPNP Q61L mutant in70% glycerol . . . 23 2. Statistics of comparison molecules superimposed onto the Q61L
LIST OF FIGURES
Introduction and Background
1. A dendogram of the G-Protein Superfamily . . . 4 2. Ras cycle of GTP/GDP interaction . . . 4 3. Diagram of conserved sequences found in GTPases and the relative
location within the protein . . . 5 4. Schematic of the general farensylation/palmitoylation pathway that
H-Ras 166 undergoes in order to be anchored to the membrane . . . 6 5. H-Ras/GTP activates the MEK, PI3-Kinase, RaldGDS, and PLC
Pathways . . . 8 6. Q61L H-Ras 166 featuring the Switch I and Switch II regions . . . . 9 Results and Discussion
7. SDS-PAGE of QFF Fractions and Western Blot . . . 20 8. SDS-PAGE and Western Blot of QFF fractions after triple stop
codon . . . 21 9. Comparison of Gel Filtration and QHP fractions . . . 21 10. RMSD of mutant in aqueous/mutant in glycerol and the mutant in glycerol/wild-type in glycerol with accessible surface area of the
mutant in aqueous solution . . . 24 11. Alternate conformations of Arginine 102 . . . 26 12. Comparison of Asparagine 26 side chain conformations . . . 26 13. General position of the placement of glycerol molecules in the
R32 crystal space group of the H-Ras mutant in glycerol and the wild-type H-Ras in glycerol . . . 29 14. Wild-type and mutant comparison at residue 61 . . . 30 15. RMSD plots of the H-Ras mutant in aqueous solution/H-Ras
mutant in glycerol (blue) and the H-Ras mutant in glycerol/
Introduction and Background:
H-Ras is a GTPase involved in cellular signaling and workings in eukaryotes.
Protein-protein interactions are necessary for signaling and a myriad of other cellular
processes. Protein-protein interfaces can be studied through a number of techniques,
including Nuclear Magnetic Resonance (NMR) and X-Ray Crystallography. The present
study uses a technique based on X-Ray Crystallography called Multiple Solvent Crystal
Structure (MSCS) to determine interaction sites within Ras (7, 8, 9).
The MSCS uses various organic solvents to locate and characterize protein binding
sites, probe plasticity in protein structure, and study hydration patterns (7, 8, 9). With this
technique, probing of mutant protein binding sites may lead to discovery of changes in
binding sites and related function. The objective of the following study was to express the
mutant forms of H-Ras, form protein crystals, and use MSCS techniques to identify areas of
potential protein-protein interaction. A comparison of the X-Ray crystal structure of the
mutants to that of the wild-type, in different organic solvent soaks, reveals differences along
the surfaces of the proteins responsible for changes in protein-protein interaction and may
also contain clues to the aberrant function of the mutants. The study of H-Ras within this
thesis reveals only the crystalline structure of the protein soaked in one organic solvent,
glycerol. Further organic soaks are needed to show possible function of the mutant within
this protein as well as potential sites of protein-protein interaction (7, 8, 9).
The MSCS method first requires cross-linking of a crystalline protein with
glutaraldehyde. The crystal is then soaked in a variety of organic solvents, which represent
functional groups that might be present in a larger binding molecule. Each protein structure
specific organic solvent molecule. The structures and the solvent molecules are then
superimposed onto each other. The “ligand” or in this case the organic solvent molecule
tends to bind areas with access to hydrophobic residues. Mattos et. al. (2006) used elastase
to develop the MSCS method. Extensive mapping of the protein surface was possible due to
the method of superimposing several structures. The structure of Elastase was solved in
100% acetonitrile, 95% acetone, 55% dimethylfomanide, 80% ethanol, 80% isopropanol,
80% 1,2-hexenediol, and 40% trifluoroethanol (9). After superposition of the protein
structure/solvents, it was shown that the organic molecules clustered around the active site
and a few crystal contacts. However, the crystal contacts did not have as many solvent
molecules as the active sites (9). In general, an area with six different organic solvent
molecules interacting with the protein typifies a hydrophobic interaction point as seen in the
S1 site of elastase (9). Where the molecules bind is important but also the type of molecule
that binds is vital in the characterizing of the protein surface.
The type of organic molecules at the site reveals traits of the binding site. This can
show specificity of the binding site for certain types of ligands. The MSCS method can also
show the plasticity of the protein binding site and the functions of water molecules within
the context of the surface of the binding site. MSCS method is useful in many ways because
it does not require prior knowledge of a protein’s properties or of an inhibitor or substrate.
Identification of the hydrophobic or interactive areas helps in determining protein
structure-function relationships, protein/protein or protein-ligand interaction, and the design of ligands
for disease control (9). This method is being used to study GTPases, which are necessary for
The G-proteins (or GTPases) are found in a wide range of eukaryotes, from yeast to
humans. The superfamily is comprised of five groups: Ras, Rho, Rab, Sar1/Arf, and Ran
families (see Figure1). The five sub-groups of the superfamily provide a large range of
cellular functions. Although there is a significant amount of cross-talk between the
signaling pathways involving GTPases, each group has been identified with specific types of
functional roles. The Ras family members mainly regulate gene expression. The Rho
family regulates cytoskeletal reorganization and gene expression. Rab and Sarf1/Arf
members regulate intracellular vesicle movement while Ran regulates nucleocytoplasmic
trafficking during G1, S, and G2 phases of the cell cycle (17, 18). All of these GTPases are
categorized as members due to a basic molecular “switch” involving interaction with GTP
and GDP.
Ras-GTPases function through the use of guanine nucleotide exchange factors
(GEFs) to catalyze the conversion of Ras to the GTP-bound state, and GTPase activating
proteins (GAPs), which accelerate the rate of hydrolysis of bound GTP to GDP (11, 15, 18).
Without GAP the rate of Ras activity is 4.2 x 10 -4 s -1 (15). GAP increases the rate of GTP
hydrolysis by stabilizing the transition state (18). Figure 2 shows how the GTPases function
Figure 1. A dendogram of the G-Protein Superfamily. In Red, the Ran and Rab families. Green is the Sar1/Arf family. The Ras family is in yellow, while the Rho family is seen in blue (18).
The conserved sequences found throughout G-proteins (including Ras) gives insight
into the potential function of these areas and reasons for conservation (see Figure 3). The
N-terminal end contains a conserved Lysine 5 residue, although the reason for conservation is
not known. The N-terminal domain has the first four beta strands and two alpha helices. It
also contains phosphate (the P-loop) and magnesium ion binding loops. The boxes
GxxxxGK and DXXG are the conserved sequence motifs for the phosphate and magnesium
respectively (18). The C-terminal domain contains the other two beta sheets and alpha
helices. Binding loop motifs, NKXD and EXSAX, bind the guanine nucleotide base. The
C-terminus also has a cysteine containing motif at the end that is necessary for post
translational modification.
Figure 3. Diagram of conserved sequences found in GTPases and the relative location within the protein (18).
This sequence is truncated and does not show the CAAX motif.
The post-translational modifications of the cysteine motif anchor the protein to the
plasma membrane. Each of the Ras proteins takes a different route to its location in the
plasma membrane, with each functioning in a distinct microdomain (12). H-Ras (and the
other Ras proteins) are anchored to the membrane through hydrophobic modifications such
as isoprenylation and palmitoylation. H-Ras undergoes four post-translational modifications
C-terminal cysteine and undergoes prenylation catalyzed by the farnesyltransferase. The last
three terminal amino acids are removed through an endoprotease. A methyltransferase adds
a methyl group to the S-farnesylated cysteine and the palmitoyltransferase performs the
palmitoylation of one or two cysteines (20).
Figure 4. Schematic of the general farensylation/palmitoylation pathway that H-Ras166 undergoes in order to be anchored to the membrane. The protein must be anchored to the plasma membrane before becoming functional in activation pathways (13).
This anchors the H-Ras to the plasma-membrane. From here, H-Ras activates kinase
cascades through interaction with GTP, which allows the binding of the effector molecule.
The GTP-bound Ras protein constitutes the “on” state and allows the Ras protein to interact
with its effector molecules. The switch mechanism involves a
guanine-nucleotide-dependent conformational change in Switch I and Switch II domains of the Ras protein,
molecules then activate kinase cascades specific to the effector molecule/Ras complex. The
Ras/GTP complex interacts with multiple downstream effector molecules and regulates
different pathways. One such pathway includes mitogen activated protein kinases
(MAPKs). This pathway controls cellular growth and cytokine receptor signaling within
eukaryotic organisms. In the MAPK module each enzyme phosphorylates and activates the
next member within the cascade (21). The typical MAPK cascade contains two other
proteins: the MAPK kinase kinase (MEKK) that activates MAPK kinase (MEK), which then
activates the MAPK. This module must be activated by a GTP/RAS/Effector interaction (13,
21).
Induction of activation is by a variety of extracellular signals that activate receptors
with intrinsic or associated tryrosine kinase activity. Phosphotyrosines serve as docking
sites for adaptor proteins, which in turn can recruit SOS (21). An extracellular signal
activates the trasmembrane receptors, and in the case of Ras, the SH3 domain of Grb2 binds
to a proline-rich region of the GEF, Son of Sevenless (SOS). These receptors have no
intrinsic protein tryrosine kinase activity but harbor sites for tyrosine phosphorylation, thus
activating the cascade through their phosphotyrosine residues with “adaptor” molecules.
The SOS increases the association of Ras with GTP and the GTP/Ras binds to RAF (a
MEKK) isoforms which targets Raf to the membrane (21). Here the protein kinase activity
increases by phosphorylation. This kinase cascade is vital in all eukaryotic organisms.
Figure 5 shows the Ras activated MAPK and JNK pathways. These pathways are important
Figure 5. H-Ras/GTP activates the MEK, PI3-Kinase, RaldGDS, and PLC pathways. The image above shows the MEK pathway to cellular proliferation and differentiation (23).
The ras genes were discovered due to the high oncogenic potential when transduced
with Harvey and Kirsten murine sarcoma viruses (5). Variants of the two genes, H-Ras and
K-Ras, and N-ras, an isoform found in neuroblastoma cells, are transforming genes when
mutated, and these mutations are present in many human and animal tumors (16). The genes
encode proteins that control regulatory pathways responsible for normal cellular
proliferation and differentiation (12). In thirty percent of human tumors, one of the three
endogenous Ras genes, mentioned above, has a somatic point mutation (1). These mutations
can cause cancer in the pancreas (90%), colon (50%), lung (30%), and thyroid (2, 18). The
point mutations result in the accumulation of the Ras GTP-bound form (3). Oncogenic
mutant forms of H-Ras include the change of Glutamine 61 to Leucine or Arginine and
locations in H-Ras function to cause oncogenic (bound to GTP) variation by not allowing
GTP hydrolysis. Both the intrinsic and the GAP catalyzed reaction is abolished, although
GAP is still able to bind the RAS/GTP molecule (1).
The catalytic domain of H-Ras is comprised of five alpha helices with a central six
stranded beta sheet. Ten loops (named one to ten respectively) connect the alpha helices and
beta strands. Three areas vital for GTP binding in H-Ras are Switch I, Switch II, and the
Phosphate Binding Loop (P-loop). Residues 30-38 (in Loop 2) make up the Switch I region
and residues 60-72 (Loop 4 and part of Alpha helix 2) make up the Switch II region. Switch
I and Switch II are involved in catalysis of GTP. The effector binding area (or where GAP
binds) is made up of amino acids 32-40, encompassing part of Loop 2 and part of the second
beta strand. The effector region, as seen below, overlaps with the majority of the Switch I
region (10).
Upon binding of the GAP, the Switch I and Switch II regions become much more
ordered. The P-loop is made of residues 11-14 and is involved with phosphate binding
along with loops one, two, and four. Loops eight and ten are involved in binding the
guanine nucleotide. The effector binding region for H-Ras contains residues 32-40, which is
comprised of part of loop two and part of beta strand two. Theses regions are involved in
the catalysis of GTP and interaction with the GAP. The switch regions change the most in
conformation when going from the GTP to GDP-bound forms or vice versa. Switch I moves
away from the nucleotide pocket, with Tyrosine 32 completely directed away from the
nucleotide. The Switch II N-terminal portion moves away from the nucleotide pocket as
well, with alpha helix two unwinding one turn (10). The GAP molecule binds the GTP-bound
Ras through the effector region, greatly restricting the flexibility of the switch regions. The
GAP stabilizes the Switch II region, allowing for glutamine 61 to participate in catalysis.
Arginine 789 (from GAP) contributes to the active site by neutralizing the developing
charge in the transition state (11, 14, 18). In the catalytic region there are amino acids that when
mutated, cause oncogenesis by keeping the Ras switch in the “on” position. Residue 12
(Glycine) is oncogenic when replaced with a valine. This mutation physically blocks the
catalytic site. The 61 residue (Glutamine) also becomes oncogenic when replaced with
Leucine. Glutamine 61 interacts with a water molecule responsible for attacking the gamma
phosphate during catalysis. With leucine in place this reaction cannot take place (19).
Burhman and Mattos (2006) report a new crystal form of H-Ras166 having symmetry of the
R32 space group. This is the crystal form used to determine all of the structures discussed in
conformation, directly over the nucleotide, which is also seen in non-catalytic crystals of
Rap2A/GTP (4).
This thesis will first outline the materials and methods used in the study and then present
the results with a discussion of the structural features observed for Q61L H-Ras/GMPPNP (a
non-hydrolyzable GTP analog) in glycerol. The Q61L refers to the mutation of the
Glutamine 61 residue to Leucine. The Results and Conclusion section will compare the
Q61L H-Ras/GMPPNP crystal soaked in 70% glycerol to the wild-type H-Ras/GMPPNP
protein crystal soaked in 70% glycerol. It will also compare the Q61L H-Ras/GMPPNP
crystal in aqueous solution and in glycerol.
Materials and Methods:
Cloning of H-Ras 166 into pET-21a(+)
The Mattos lab received a clone for the catalytic domain of H-Ras in a PAT plasmid
from the Campel lab (UNC, Chapel Hill). The catalytic domain (H-Ras 166) corresponds to
the domain after truncation of twenty residues from the C-terminus, making the functional
protein easier to use in experimentation. However, the PAT plasmid is not well known and
a complete sequence was not available. The Ras gene was therefore transferred to the
pET-21a(+) plasmid, a well known and studied construct. Transferring the gene began by
introducing NdeI and BamHI cut sites into the PAT vector in order to retrieve the H-Ras 166
sequence. The primers are seen below:
Upper Primer:
5’- GGAGGTCCATATGACGGAATATAAGCTGG -3’ Lower Primer:
The NdeI primer cut at CA-TATG and the BamHI primer at G-GATCC. The PCR
reaction used 1uL of PAT plasmid DNA, 36.75ul of distilled water, 1ul of 10mM dNTP
mix, 3ul of each respective primer (5pmol/ul), 5ul of Nova Taq buffer with MgCl2, and
0.25ul of Nova Taq DNA polymerase. For detailed instructions see Novagen Nova Taq
DNA Polymerase and Kits. Briefly, the polymerase chain reaction (PCR) puts the cut sites
into either side of the H-Ras 166 protein that is within the PAT plasmid. The recombinant
PAT DNA, using 1% agarose gel containing 0.5ug/ml eithidium bromide, was gel purified.
The eithidium bromide allows for visualization of the DNA under ultra violet (UV) light.
The plasmid was isolated from the gel using Quiagen Spin Miniprep. The mutated PAT
plasmid and the pET-21a(+) plasmid we digested using 1.5ul of NdeI, 0.5ul of BamHI,
Buffer for BamHI (being similar to that of NdeI), 0.5ul bovine serum albumin (BSA), the
respective pET or PAT DNA, and distilled water up to 30ul. A tube without DNA served as
a negative control and all of the tubes were placed in a 37◦C incubator for one and a half
hours. Dye and running buffer were added to each tube and then they were run on a 1%
agarose gel containing 0.5ug/ml of ethidium bromide. The digested pET vector and H-Ras
166 (containing 547 nuclotides due to the addition of the cut site primers) were isolated.
This produced sticky ends that were complimentary to the ends of the H-Ras 166 protein
sequence which allowed annealing to occur. Annealing the H-Ras 166 gene to the pET
plasmid required T4 DNA ligase, T4 DNA buffer, distilled water, and a 2:1 ratio of the
insert (H-Ras 166 sequence) to the vector (the pET-21a(+)). The protocol is found in
Stratagene Ligation manual. The components were placed in the PCR machine, which was
The plasmid was then placed into the XL-Blue cells via the transformation protocol
supplied by the Quick Change II Site-Directed Mutagenesis Kit. The cells were selectively
grown on Lauria broth agar plates with carbenicillin, overnight at 37°C. This selects only
the cells that took in the recombinant plasmid. A stab of the cells from the plate are then
grown in 200ml Lauria Broth (with the appropriate amount of antibiotic) overnight at 37°C
(in the shaking incubator at 225rpm). There was now enough of the plasmid DNA to isolate
and place into storage cells (T10) for a stock of wild-type H-Ras 166 (pET-21a(+)) and to
use for mutagenesis. The new H-Ras 166/pET21a(+) was isolated through the Quiagen
microcetrifuge miniprep. Gel electrophoresis confirmed the addition of H-Ras 166 to the
pET-21 plasmid in comparison to the original pET-21 vector. The next step was to
introduce the mutations into the H-Ras 166.
Mutation of H-Ras 166
Mutagenesis primers were designed to introduce valine (instead of the wild-type
Glycine) into the twelfth amino acid position (G12V) and in a separate experiment, a
Leucine for a Glutamine at the sixty-first amino acid position (Q61L). Bother were single
mutants. The primers were designed using the program found at
http://labtools.stratgene.com/QC(22). Shown below are the primers for G12V and Q61L.
G12V Sense
5’- GTGGTGGGCGCTGTAGGCGTGGGAAAG -3’ Antisense
5’- CTTTCCCACGCCTACAGCGCCCACCAC -3’ Q61L
Sense
5’- GGATACCGCCGGCCTAGAGGAGTACAGCG -3’ Antisense
QuickChange II Site Directed Mutagenesis was the protocol followed for
mutagenesis. Briefly, 5ul of 10X reaction buffer, 2.0ul of the plasmid DNA containing the
wild-type H-ras 166 sequence, 10ng of each respective mutagenesis primer, 1ul of dNTPs,
and then distilled water brought up to a volume of 50ul were mixed. After the contents of
the PCR-mutagenesis tubes warmed up, 1 ul Pfu Ultra was added, using the “hot start”
method. Pfu Ultra is the enzyme used to catalyze the mutagenesis reaction. The PCR
program selected followed the manufacturers’ protocol. Afterwards, 1 ul of Dpn was added
to each reaction tube, with gentle pippeting of the mixture. The tubes were spun down using
the microcentrifuge for one minute. They were then placed in the 37°C incubator for one
hour, digesting the parental template DNA. The mutated plasmids were then transformed
into the XL1-Blue supercompetent cells. The cells were grown on carbenicillen selective
solid Lauria broth plates in a 37°C incubator overnight. The next day, a colony from the
overnight culture, was grown in ampicillin inoculated Lauria broth overnight at 37°C while
shaking (225rpm). The mutated plasmid was isolated from the Lauria broth culture using
Quiagen microcentrifuge miniprep kit. The DNA was then sent off for sequencing, which
confirmed the mutation to the H-Ras 166 sequence. The plasmid was transformed into the
expression vector (Rosetta cells) in the manner described by Novagen. The cells grew on
agar plates in a 37°C incubator overnight. A sample of the culture was then placed into
240ml of Lauria broth and grown overnight in a shaking incubator (225rpm) at 37°C. The
next day, 40ml aliquots of the overnight culture were placed into one liter flasks of sterile
Western Blot
Identical SDS-PAGE gels are run using fractions from the protein expression or
fractions from later purification steps. One gel is dyed with Comassie Blue and used as a
control for the Western Blot. The other gel is soaked with the transfer membrane and pads
in transfer buffer (25mM Tris pH8.3, 190mM Glycine, and 20% methanol). They are
soaked and washed three times for ten minutes each (while gently shaking). The proteins
from the gel are transferred to the membrane at 25volts for fourteen minutes. The
membrane is placed in blocking buffer (5%milk, 10mM Tris pH7.5, 100mM NaCl, and
0.1% Tween) for one hour at 37°C on a gentle shake. The block is taken off and the
membrane incubated with the primary antibody. The primary antibody was Anti-Pan-Ras
Ab-1 Mouse from Calbiochem and specific for H-Ras. The antibody (5ug/ml) was placed in
10ml of blocking buffer and added to the membrane. This was placed into the incubator at
37°C, shaking for forty-five minutes. Afterwards, the primary antibody was removed and
the secondary antibody added (Immuno Pure Antibody, Rabbit Anti, Mouse IgG). This
secondary antibody is sensitive to alkaline phosphatase. After incubating with the antibody
for forty-five minutes (37°C) the membrane was developed with alkaline phosphatase
solution.
Mutation for Triple Stop Codon
Mutagenesis primers were designed to introduce a triple stop codon to the end of the
protein sequence. This insures less read-through and more of the complete protein.
These triple stop codon mutant sequences were used for the mutagenesis, described in the
next section. Below are the primers for the triple stop codon.
5’- CCGGCAGCACTGATGATGAGGATCCGAATTCGAG- 3’ Antisense
5’- CTCGAATTCGGATCCTCATCATCAGTGCTGCCGG -3’
Expression and Isolation of H-Ras 166 protein
Six liters were inoculated with cells containing one of the H-Ras mutants (and the
triple stop codon) and placed into the shaker (225rpm) at 37°C. The cells were grown until
they reached an optical density (O.D.) of 0.8 to 1.0 (log phase). The measurements were
taken in a spectrophotometer set with a wavelength (λ) equal to six hundred nanometers.
The cells were then inoculated with 1mM Isopropyl-β-D-Thiogalactopyranoside (IPTG) and
the temperature turned down to 32°C, to allow for expression of the H-Ras166 protein. The
cells expressed the protein for four to eight hours. The cells were then centrifuged down
into a pellet. The H-Ras 166 mutated protein was then isolated from within the cells as the
following describes. The cells were resuspended using 50 ml cellular resuspension solution.
This solution contains 20XTris/MgCl2, 5M NaCl, 1mM DTT, 20mM GDP, 200mM
Glycerol, and distilled water. Protease inhibitors including antipain, E34, Pefabloc,
Pepstatin, and Benzamidine were added to the mixture. The resuspension solution was
sonicated for thirty seconds and then cooled for thirty seconds. This step was repeated six
times with the solution on ice. The sonicated mixture spun down at 7,000 rpm for twenty
minutes. The soluble liquid fraction was isolated and placed in an ice bath. Slowly 100ul of
10% PEI was added and mixed at 4◦C for one hour. Afterwards, the solution spun down at
15,000 rpm for ten minutes. This gets rid of any heavy material and DNA.
Anion Exchange Chromatography
The supernatant from the previous step was applied to the Q Sepharose Fast Flow
Amersham. Unbound material was eluted off using a 20mMTris/MgCl2 buffer, pH 7.5. The
bound protein was removed through a linear salt gradient. The samples were tested for
protein through SDS-PAGE. The protein runs in the gel at about 15kD to 20kD and elutes
off the column around 30% to 40% of the elution buffer. Gel Filtration (or size exclusion
chromatography) purified the protein further.
Size Exclusion Chromatography
The isolated fractions from the previous step were spun down to concentrate the
sample to less than two milliliters. A centrifugal filter device from Millipore had a size
exclusion of 5kD and concentrated down the protein sample. The solution was applied to
the 100 Sephadex gel filtration column and eluted off with a 150mM NaCl buffer. Samples
of the fractions were run on the SDS-PAGE which revealed the fractions containing protein.
These fractions were isolated and further purified through the 5ml Q Sepharose HP column.
High Resolution Anion Exchange Chromatography
The collected fractions were diluted, from the previous step, down to 70mM NaCl.
The protein was applied to the equilibrated Q Sepharose HP Column. The protein was then
eluted off over 110 ml, 0-35% of the elution buffer. SDS-PAGE located the fractions with
purified protein and these were collected and concentrated down to less than two milliliters.
Exchange Reaction
The exchange reaction removes salt from the purified protein and binds GMPPNP to
stabilize the protein in the active conformation. The protein was passed over a desalting
column that is pre-equilibrated with 200mM Amonium Sulfate/ 32mM Tris (pH 8.0) buffer.
The fractions were collected and the tubes with protein determined through the Bovine
10mM GMPPNP was added to the total protein solution. The protein (plus GMPPNP)
incubates with alkaline phosphatase (AP) beads (20mg protein/100 U tube AP beads) for
forty-five minutes to one hour at 37°C while shaking. Afterwards, 20mM MgCl2 is added
and the beads are centrifuged (two minutes, 4°C). The supernatant was poured over a
desalting column pre-equilibrated with 20mM Hepes/20mM MgCl2 buffer. The tubes with
protein are then identified through the BSA Assay. The protein fractions are pooled and
concentrated down to 15-20mg/ml. The purified protein is then used to set up trays to
produce Q61L H-Ras 166 crystals.
Crystallization (performed by Greg Buhrman)
Q61L H-Ras crystals were grown in the R32 space group through the hanging drop
vapor diffusion method using protein concentrated down to 15-20mg/ml. The reservoir
solution consisted of 800 ul (0.2 M CaCl2. 24-26 % PEG3350) and 200 ul stabilization
buffer (20mM Hepes/20mM MgCl2) with fresh DTT (4). The drop consisted of 2ul of
protein and 2ul of the reservoir solution and the crystals grew in approximately 5-10 days.
Crystal Soaking in Glycerol and Diffraction Data Collection (performed by Greg Buhrman)
Crystals were soaked in glycerol by first transferring the crystals to 50ul of
stabilization buffer, described above, within the sitting drop plate. The crystals were washed
with stabilization buffer three times and then transferred into a crosslinking buffer
(stabilization buffer with 1% glutaraldehyde). The crystals soaked for thirty minutes to one
hour and then the crosslinking buffer was exchanged with stabilization buffer. Glycerol was
added in increments to a value of 70% glycerol. The crystals were soaked for 90-180
minutes and then flash frozen in liquid nitrogen (4). Diffraction data were collected at the
and the exposure time was 1-3 seconds, an oscillation angle of one degree was used during
data collection in a total of 180 frames. The crystal to detector distance was 120mm and the
HKL2000 program was used to index and scale the data (4).
Structure Refinement of Q61L in Glycerol
The Crystallography and NMR System (CNS) program was used for reciprocal space
refinement, with 10% of the unique reflections removed for the Rfree calculations (4). A
protein model of wild-type H-Ras 166 was used for 30 rounds of rigid body refinement at
2.5 Angstroms (Å). This was followed by 30 rounds of rigid body refinement at 2.0Å.
Simulated annealing, energy minimization, and B-factor refinement were used in CNS
before the calculation of the 2Fo-Fc and Fo-Fc electron density maps (4). Manual rebuilding
was done in the program O and addition of water molecules, ions, GMPPNP, and glycerol
were also added during successive rounds of refinement. Coordinate files for water
molecules were taken from previously published structures found in the Protein Data Bank
(PDB). Buhrman et. al. (2005) also used the wild-type Ras 166 from crystals having
symmetry of the space group R32 to phase the Q61L H-Ras 166 mutant (4).
Results and Discussion:
Isolation of H-Ras 166 for Greater Yield and Purification
The sequences of G12V and Q61L H-Ras 166 in pET were correct, but there was a
problem in the isolation of the protein. After purification of the protein through the QFF
column, SDS-PAGE gels were run to determine the fractions that contained the H-Ras 166
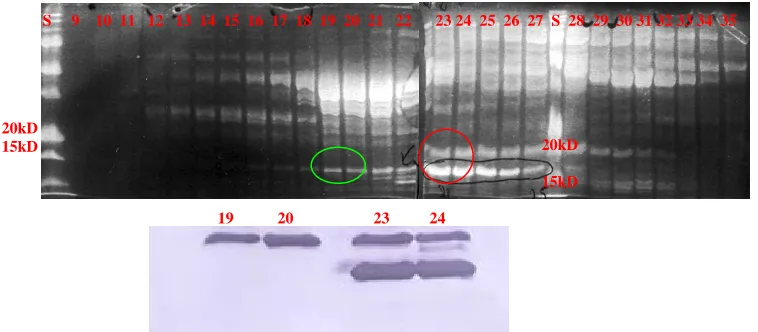
protein (about 20 kDa). The gels below show the fractions possibly containing the protein
(Figure 7). However, another band ran at about the same size but slightly bigger. In order
Western Blot was run. The protein that was originally collected is seen in the bright bands
at the bottom, closer to the 15kDa standard. The top bands, closer to the 20kDa standard,
however, were also H-Ras. Upon review, a triple stop codon was added to the end of the
protein sequence to insure read-through was not occurring.
20kD
15kD
19 20 23 24 2
0kD 15kD
S 9 10 11 12 13 14 15 16 17 18 19 20 21 22 23 24 25 26 27 S 28 29 30 31 32 33 34 35
Figure 7. SDS-PAGE of QFF Fractions and Western Blot. Upper image is the SDS-PAGE of the fractions containing H-Ras protein after QFF purification. The numbers represent the fraction from which the sample was collected. The green circle indicates the H-Ras protein fractions run on the Western Blot that produced single bands (Fractions 19 and 20). Correspondingly, the red circle indicates the fractions found in the Western Blot that produced the dual bands (Fractions 23 and 24).
Upon addition of the triple stop codon, the protein was found entirely in the lower
band (Figure 8). This resulted in an increase in yield of purified H-Ras 166 for
crystallization.
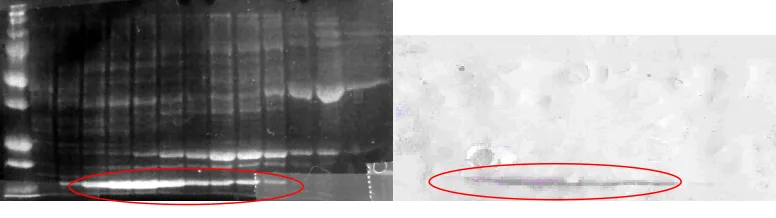
Figure 8. SDS-PAGE and Western Blot of QFF fractions after triple stop codon. The left hand image
represents the fractions containing H-Ras, with the triple stop codon, collected after QFF purification. The red circle indicated the H-Ras seen in the corresponding Western Blot.
S 21 22 23 24 25 26 27 28 29 30 31 32 33 34 S 21 22 23 24 25 26 27 28 29 30 31 32 33 34
Both mutants were constructed with a triple stop codon to insure no read-through
was occurring. However, the protein was still not pure at the end of the S-100 Gel Filtration
run as seen in the following gel. An extra QHP column was added to further purify the
protein in order to more easily produce crystals (Figure 9). Addition of the triple stop codon
and an extra QHP column ensured the acquisition of highly pure H-Ras protein.
Gel Filtration QHP
Figure 9. Comparison of Gel Filtration and QHP fractions. The left hand figure shows contamination after gel filtration. The right gel shows the protein fractions after collection from the QHP column.
S 51 52 53 54 55 56 57 58 59 60 S 16 17 18 19 20 21 22 23 24 25 26 27 28
Superimposition and Root Mean Square Deviation:
structures of the mutant H-Ras in aqueous solution and the wild-type H-Ras in glycerol (4).
Table 2 shows the data and statistics for the superposition for the latter two protein
molecules onto the mutant H-Ras in glycerol.
All superimpositions and Root Mean Square Deviation (R.M.S.D.) calculations were
done with LSQMAN (Upsala Software Factory). The brute force algorithm was used to
superimpose the mutant H-Ras in glycerol with the wild-type H-Ras in glycerol and the
mutant H-Ras in aqueous solution. Root mean square deviations per residue for each
superimposition were calculated with a global fitting algorithm. Visual inspection of the
structures was done manually in O and PyMol.
The comparison of the mutant H-Ras in glycerol with the wild-type in glycerol is to
determine the differences in the position of glycerol molecules and what changes are caused
by the mutation. The comparison of the mutant H-Ras in glycerol with the mutant in
aqueous solution was to determine if structural changes were due to the mutation or to the
Table 1. Data collection and refinement statistics for R32 crystal space group of Ras/GMPPNP Wild-Type in 70% glycerol and Ras/GMPPNP Q61L mutant in aqueous solution, Ras/GMPPNP Q61L mutant in70% glycerol.
Solvent
(concentration)
Aqueous Solution of Q61L Mutant
Glycerol (70%) Wild-Type Glycerol (70%) Q61L Mutant
Space Group R32 R32 R32
Unit Cell a = 88.95 b = 88.95 c = 134.02Å a = b = 90° g = 120°
a = 89.28 b = 89.28 c = 134.70Å a = b = 90° g = 120°
a = 89.157 b = 89.157 c = 135.09Å a = b = 90° c = 120°
Temperature (K) 100 100 100
Resolution (Å) 2.0 1.6 2.0
# Reflections 13,810 26,775 11,707
Completeness (%) 98.3 97.4 88.5
Rfactor/Rfree (%) 19.7/23.4 20.0/21.5 18.9/21.2
Bond Length (Å) 0.005 0.004 0.008
Bond Angle (°) 1.1 1.1 1.3
# Protein Atoms 1,303 1,295 1,322
# Nucleotide Atoms 32 32 32
# Magnesium
Molecules 1 1 1
# Calcium Molecules 3 3 2
# Water Molecules 128 93 124
# Organic Solvent
Molecules 0 12 7
Table 2. Statistics of comparison molecules superimposed onto the Q61L H-Ras (R32 Space Group) in 70% Glycerol. ** MI = (1+Nmatch)/([1+W*RMS]*[1+Nmin]).
Molecules
Superimposed onto Q61L H-Ras in 70% Glycerol
Aqueous Solution of Q61L Mutant
Glycerol
(70%) Wild-Type
RMS Distance (Å) 0.220 0.181
RMS*Nmin/Nmatch 0.220 0.181
MI** 0.81988 0.84673
Maiorov-Crippen RHO
(0-2) 0.01522 0.01253
Relative RMSD 0.01422 0.01171
Normalized RMSD (Å) 0.175 0.124
RMS delta B for
Matched Atoms (Å2) 11.298 3.791
Corr. Coefficient
Comparison of Q61L Aqueous vs. Q61L in Glycerol:
Glycerol is well-known to have a stabilizing effect on protein structure and is widely
used as a stabilizing agent (4, 7, 8, 9). As seen previously with other organic solvents, this
stabilizing effect results in a disorder to order transition within certain mobile elements of
protein structure (4, 7, 8, 9). This was also seen in the mutant H-Ras in glycerol structure. On
comparing the mutant in glycerol to the H-Ras mutant in aqueous solution, the change
becomes more apparent. In Figure 10, comparison of the R.M.S.D. per residue between
aqueous and glycerol soaked mutant structures clearly shows that the largest changes in
protein structure occur in solvent exposed regions of the protein. Some of these regions are
highly flexible and disordered in the aqueous structure, but become ordered to alternate
conformations in the presence of glycerol. Two specific examples are Asparagine 26 and
Arginine 102.
RMSD & Accessible Surface Area vs. Residue Number
0 10 20 30 40 50 60
1 8 15 22 29 36 43 50 57 64 71 78 85 92 99 106 113 120 127 134 141 148 155 162
Residue Number A c ce ss ib le S u rf ac e A rea 0 0.1 0.2 0.3 0.4 0.5 0.6 0.7 0.8 0.9 1 R MSD ( A ) Acc.SurfaceAreaQ61LAqueous RMSD Q61LAQ/Q61LGly RMSDQ61LGly/WildTypeGly
Arginine 102 adopts a more buried conformation, forming a salt bridge with Aspartic
acid 69 (3.52Å) seen in Figure11. Aspartic acid 69 is more ordered due to this interaction,
whereas the structure of the mutant in aqueous solution, the Aspartic acid 69 was modeled
as an Alanine due to lack of density. A similar ordering effect within Switch II is seen for
residues Glutamic acid 63 and Serine 65. The change is seen in the glycerol mutant even
though there is no glycerol molecule nearby, suggesting that the ordering effect is due to
bulk properties of glycerol, such as lowering the dielectric which causes the protein
charge/charge interaction to be more favorable (4, 7, 8, 9).
In the case of Asparagine 26, alternate conformations are due to specific interactions
with bound glycerol molecules. The conformation seen in the wild-type in glycerol is
shown in Figure 12, with two glycerol molecules nearby. One glycerol is more solvent
exposed and the other more buried. The presence of the two glycerol molecules in the
wild-type structure seems to keep the side chain of Asparagine 26 in a more buried conformation,
similar to the conformation found in aqueous solution. The Asparagine 26 of the mutant in
glycerol also shares this conformation. However, unlike the wild-type, the mutant is lacking
the more solvent exposed glycerol. This change allows for the alternate conformation of
Asparagine 26 that is not found in the wild-type (see Figure 12).
Figure 11. Alternate conformation of Arginine 102. Note the salt bridge formed in the conformation of Arginine102 of the mutant in glycerol, not seen in the aqueous mutant. The second conformation of Arginine 102 in the glycerol mutant is similar to the aqueous mutant.
Specific comparison of the H-Ras mutant soaked in glycerol vs. the H-Ras mutant in aqueous solution:
The side chains of residues Lysine 147, Leucine 120, Aspartic acid 30, and Tyrosine
32 show conformational shifts due to the presence of glycerol molecules (average R.M.S.D.
for these four residues 0.22Å versus overall R.M.S.D. = 0.17Å). Even larger differences
occur for residues Tyrosine 64, Isoleucine 36, and Aspartic acid 38 due to the presence of
two glycerol molecules near the switch regions (average R.M.S.D. for these three residues
0.23Å versus overall R.M.S.D. 0.17Å). The conformational changes observed for these
residues towards Leucine 61 tightens the interaction of the H-Ras mutant in glycerol with
Tyrosine 32. Other solvent exposed residue that differ between the aqueous and glycerol
soaked structures include Aspartic acid 54, Arginine 41, Glutamic acid 3 and Lysine 5.
These residues all have good electron density in the glycerol structure. The average
R.M.S.D. between the mutant H-Ras in glycerol and the mutant in H-Ras in aqueous
solution structures is 0.17Å, while the average R.M.S.D. between mutant H-Ras in glycerol
and the wild-type H-Ras in glycerol structures is 0.12Å, supporting the notion that changes
in the solvent environment have a greater effect on overall protein structure than changes
due to a specific mutation.
Comparison of Q61L and Wild-Type H-Ras in 70% Glycerol:
The wild type and Q61L mutant Ras proteins are very similar in structure with few
major differences. Most of the differences between the two structures occur in the dynamic
Switch II region. The overall R.M.S.D. for the wild-type H-Ras soaked in glycerol and the
mutant H-Ras soaked in glycerol is 0.12Å. The wild-type H-Ras has twelve glycerol
part, to the higher resolution of the wild-type structure (1.6Å) to the mutant H-Ras in
glycerol structure (2.0Å). Five glycerol molecules bound to the H-Ras mutant in glycerol
have corresponding glycerol molecules in the wild-type H-Ras in glycerol structure
(glycerol molecules of the mutant Ras: 1, 2, 3, 4, 5 with a, b, c, d, e of the wild-type
H-Ras in Figure 13). Three of these are found in the effector binding pocket adjacent to the
nucleotide (see Figure 13). The other two glycerol molecules in the mutant and the other
seven in the wild-type Ras are in different positions and resulting in slightly different protein
side chain conformations. The most striking difference between the H-Ras mutant in
glycerol and the wild-type H-Ras soaked in glycerol is the absence of a glycerol at the site of
mutation.
Effector Binding Pocket
Many of the glycerol molecules are found near the effector binding pocket. Four are
near the GMPPNP molecule in both the wild-type H-Ras in glycerol (Fig.13 glycerols b, e,
d, and h) and in the mutant H-Ras in glycerol (Fig. 13 glycerols 2, 4, 5, and 6) structures,
with three being in overlapping positions (glycerols 2, 4, 5 and b, d, e). Two glycerol
molecules, found in slightly different locations in the mutant H-Ras and wild-type H-Ras
structures are still both near the GMPPNP pocket (see Figure 13). Some interesting glycerol
binding sites were also found in other areas in each structure.
Site of Mutation
The glycerol seen adjacent to Glutamine 61 of the wild-type H-Ras soaked in
glycerol is absent in the mutant H-Ras in glycerol. The glycerol (Fig. 14) is 3.58Å away
from the Glutamine 61 residue (see Figure 14). The polar side chain of the Glutamine 61
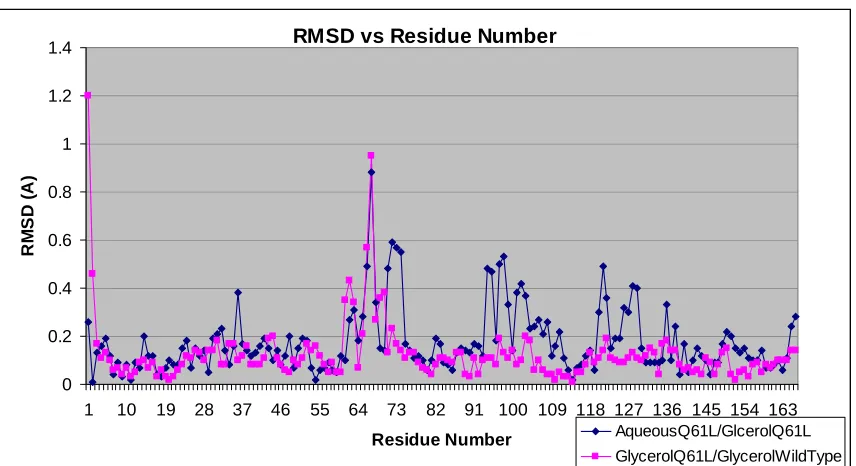
in glycerol does not favor that interaction. Figure 15 shows the R.M.S.D.s of the residues
for the mutant H-Ras in glycerol with wild-type H-Ras in glycerol and the mutant H-Ras in
glycerol with the mutant H-Ras in aqueous solution. Focusing on the individual residues in
the mutant H-Ras in glycerol with the wild-type H-Ras in glycerol, there is a higher
R.M.S.D. for Alanine 66 and Methionine 67, within the Switch II region.
l
3 c 5 e
6
4 d f
h 1 a
j
7
i g
2 b
m
A B
Figure 14. Wild-type and mutant comparison at residue 61.(a) Image of the glycerol molecule found near the Glutamine 61 in wild-type but not in the mutant H-Ras in glycerol. The wild-type H-Ras glycerol and Glutamine 61 residue are seen in salmon. (b) This is a figure in O that shows Glutamine 61 (wild-type H-Ras in glycerol) interacting with the glycerol molecule. The two water molecules of Leucine 61 in the mutant H-Ras can be seen in the same area as the glycerol molecule.
The Alanine 66 and Methionine 67 are exposed and the side chains do not have any
electron density, therefore the RMSD is higher in the aqueous structure. The Methionine 1
residue has complete electron density in the mutant H-Ras soaked in glycerol structure, but
in the comparable wild-type structures the residue was replaced with Alanine due to lack of
electron density. The difference between the two causes a large R.M.S.D. value. However,
the residues within the Switch II (residues 60-72, Avg R.M.S.D. = 0.33Å), have an overall
higher R.M.S.D. value than those seen in Switch I (residues 30-38, Avg R.M.S.D. = 0.13Å),
reflecting the general disorder of the Switch II region. This only reveals the major
differences of the two proteins in glycerol, with the Switch II being more disordered.
Comparison of the R.M.S.D. values of the mutant H-Ras in glycerol/wild-type H-Ras in
glycerol and the mutant in glycerol/mutant H-Ras in aqueous solution shows a similar
pattern within the switch regions. However, the C-terminal residues after Switch II, are
RMSD vs Residue Number 0 0.2 0.4 0.6 0.8 1 1.2 1.4
1 10 19 28 37 46 55 64 73 82 91 100 109 118 127 136 145 154 163 Residue Number RM SD ( A ) AqueousQ61L/GlcerolQ61L GlycerolQ61L/GlycerolWildType Figure 15. R.M.S.D. plots of the Ras mutant in aqueous solution/Ras mutant in glycerol (blue) and the H-Ras mutant in glycerol/wild-type H-H-Ras in glycerol (magenta).
The R.M.S.D. values between the H-Ras structures in the presence of glycerol (Total
Avg = 0.12Å) are lower than those between the aqueous structure and the H-Ras mutant in
glycerol (Total Avg = 0.17Å). Switch I (30-38) R.M.S.D.s for the structures in glycerol
(Switch I: Avg. R.M.S.D. = 0.13Å) is lower than that of the aqueous (Switch I: Avg.
R.M.S.D. = 0.18Å) but the Switch II residues (60-72) have the same average RMSD for the
mutant H-Ras in glycerol with the wild-type H-Ras in glycerol as that of the mutant H-Ras
in aqueous solution with the mutant H-Ras in glycerol (0.33Å). The overall changes seen
within the H-Ras protein is mainly due to the solvent and not the mutation. However, within
the Switch II region, this becomes unclear.
Conclusions:
The overall changes seen in the H-Ras mutant in glycerol is due mainly to the
glycerol to the protein in aqueous solution. However, the mutation comparison with
wild-type in glycerol does reveal several interesting facts. The glycerol molecule located near the
Glutamine 61 in the wild-type and not in the mutated protein is interesting considering most
organic molecules are attracted to regions of hydrophobicity. It is also noteworthy that
while most of the glycerol molecules found in the mutant structure and in the wild-type were
in separate areas, there were several places where the glycerols were superimposed, most
notably in the GMPPNP pocket. This region is important for binding the downstream
effector molecules and being involved in the catalysis of GTP to GDP. The conservation of
glycerol molecules to this area denotes the importance of this region. This is also similar to
results seen in Mattos et.al. (2006) where organic solvents tend to bind in areas of the
protein that are involved as binding sites to effector molecules. Future research will involve
more organic solvent soaks to the Q61L Ras crystal and review of the regions of interaction
within the protein, giving a broader understanding of the structure function relationship of
the mutated Ras protein. This may reveal important areas within the protein that can be used
REFERENCES
1. H.R. Bourne, D.A. Sanders, F. McCormick. Nature. 349:117–127 (1991).
2. J. L. Bos, Cancer Res. 49, 4682-4689 (1989).
3. J. Boguski et al. Nature 409, 922-927 (2001).
4. G. Buhrman, Title, Dissertation PhD., North Carolina State University, (2005).
5. J. J. Harvey, Nature 204, 1104-1105 (1964).
6. U. Krengel, Cell 62, 539-548 (1990).
7. C. Mattos and D. Ringe, Nat.Biotechnol. 14, 595-599 (1996).
8. C. Mattos and D. Ringe, Curr.Opin.Struct.Biol. 11, 761-764 (2001).
9. C. Mattos et al. JMB In Press, 1-12 (2006).
10. M. Milburn et al. Science 247, 939-945 (1990).
11. R. Mittal, M. R. Ahmadian, R. S. Goody, A. Wittinghofer, Science 273, 115-117 (1996).
12. G.W. Reuther and C.J. Der, Curr. Opin. Cell Biol. 12, 157-165 (2000).
13. E.K. Rowinsky et al. J. Clin.Oncol. 17, 3631-3652 (1999).
14. A. Scheidig, C. Burmester, and R.S. Goody, Structure 7(11), 1311-1324 (1999).
15. I. Schlichting et al., Nature 345, 309-315 (1990).
16. K. Shimizu et al., Proc.Natl.Acad.Sci.U.S.A 80, 2112-2116 (1983).
17. Y. Takai et. al., Mol.Biol.Cell. 11(5), 1875-1886 (2000).
18. Y. Takai et. al., Phys. Rev. 81(1), 154-188 (2001).
19. A. Valencia et al. Biochemistry, 30(19), 4637-4646 (1991).
21. http://www.biochemweb.org/signaling.shtml
22. http://labtools.stratgene.com/QC
23. http://www.cellsignal.com