| INVESTIGATION
RNA-Interference Pathways Display High Rates of
Adaptive Protein Evolution in Multiple Invertebrates
William H. Palmer,*,†,1Jarrod D. Hadfield,* and Darren J. Obbard*,† *Institute of Evolutionary Biology, University of Edinburgh, EH9 3FL, United Kingdom and†Centre for Infection, Evolution and Immunity, University of Edinburgh, EH9 3FL, United Kingdom ORCID ID: 0000-0001-5392-8142 (D.J.O.)
ABSTRACT Conflict between organisms can lead to a reciprocal adaptation that manifests as an increased evolutionary rate in genes mediating the conflict. This adaptive signature has been observed in RNA-interference (RNAi) pathway genes involved in the suppression of viruses and transposable elements inDrosophila melanogaster, suggesting that a subset ofDrosophilaRNAi genes may be locked in an arms race with these parasites. However, it is not known whether rapid evolution of RNAi genes is a general phenomenon across invertebrates, or which RNAi genes generally evolve adaptively. Here we use population genomic data from eight invertebrate species to infer rates of adaptive sequence evolution, and to test for past and ongoing selective sweeps in RNAi genes. We assess rates of adaptive protein evolution across species using a formal meta-analytic framework to combine data across species and by implementing a multispecies generalized linear mixed model of mutation counts. Across species, wefind that RNAi genes display a greater rate of adaptive protein substitution than other genes, and that this is primarily mediated by positive selection acting on the genes most likely to defend against viruses and transposable elements. In contrast, evidence for recent selective sweeps is broadly spread across functional classes of RNAi genes and differs substantially among species. Finally, we identify genes that exhibit elevated adaptive evolution across the analyzed insect species, perhaps due to concurrent parasite-mediated arms races.
KEYWORDSadaptive evolution; antiviral immunity; population genetics; RNA interference; small RNA; transposable elements; viruses
R
NA-interference (RNAi) mechanisms include a diverse group of pathways, united by their use of Argonaute-family proteins complexed with short (20–30 nt) RNA mol-ecules to target longer RNA molmol-ecules through sequence complementarity (Carmellet al.2002; Meister 2013). These pathways regulate multiple biological processes that can be divided into three distinct subpathways in arthropods and nematodes, each represented by a characteristic class of small RNAs: the micro-RNA (miRNA), the short-interfering RNA (siRNA), and the piwi-interacting RNA (piRNA) pathways.The miRNA pathway processes endogenously encoded fold-back hairpins which, in their mature miRNA form, regu-late gene expression and coordinate developmental processes (Alvarez-Garcia and Miska 2005; Chenet al.2014; Ha and Kim 2014). The siRNA pathway has two distinct roles, depending on the endogenous or exogenous origin of its substrate. First, the endo-siRNA pathway processes endogenously encoded double-stranded RNA to regulate processes such as transpos-able element (TE) defense (Czechet al.2008; Ghildiyalet al.
2008; Kawamuraet al.2008), chromosomal segregation (Hall
et al.2003; Huanget al.2015), and heterochromatin formation (Deshpandeet al.2005). Second, the exo-siRNA (or viRNA) functions primarily as a form of antiviral immunity (Wanget al.
2006; Bronkhorst and van Rij 2014). The piRNA pathway forms a defense against TEs, which is germline limited in some spe-cies, and is mediated by piRNAs derived from endogenously encoded clusters of inactivated TE sequences and from active TEs (Klattenhoff and Theurkauf 2008; Thomson and Lin 2009; Czech and Hannon 2016; Lewiset al.2018).
Within this framework, there is substantial mechanistic variation among species and RNAi-pathway components seem
Copyright © 2018 Palmeret al.
doi:https://doi.org/10.1534/genetics.117.300567
Manuscript received November 28, 2017; accepted for publication January 31, 2018; published Early Online February 1, 2018.
Available freely online through the author-supported open access option.
This is an open-access article distributed under the terms of the Creative Commons Attribution 4.0 International License (http://creativecommons.org/licenses/by/4.0/), which permits unrestricted use, distribution, and reproduction in any medium, provided the original work is properly cited.
Supplemental material is available online atwww.genetics.org/lookup/suppl/doi:10. 1534/genetics.117.300567/-/DC1.
1Corresponding author: Ashworth Laboratories, University of Edinburgh, Charlotte Auerbach
to be evolutionarily labile. For example, in nematodes, the mechanism and function of the piRNA pathway is not well conserved: primary piRNA-like small RNAs are encoded by short distinct loci instead of the clusters observed inflies and mammals, and they mediate the biogenesis of a separate endo-siRNA population transcribed by an RNA-dependent RNA polymerase (RdRP) and processed by Dicer (Duchaineet al.
2006; Das et al.2008). Further, only one of thefive major clades of nematode has retained Piwi-subfamily proteins— the canonical effector of the piRNA pathway—and instead rely solely on the (RdRP-produced) endo-siRNAs (Sarkies
et al.2015). The piRNA pathway can also take on entirely new roles, for example, duplications ofpiwiinAedes mosqui-toes has allowed the piRNA pathway to adopt an antiviral role in somatic tissues (Morazzani et al.2012), while other
piwiduplicates maintain the ancestral function (Miesen and Girardi 2015; Miesenet al.2016).
The role of RNAi pathways in mediating intergenomic (host–virus) and intragenomic (host–TE, segregation distortion) (Ferree and Barbash 2007) conflict may make them a target of antagonistic host–parasite coevolution. This could result in balancing or directional selection on the loci in conflict, evi-denced by the maintenance of polymorphism or elevated rates of adaptivefixation, respectively (e.g., Anderson and May 1982; Ebert 2008). This has been well studied inDrosophila RNAi-pathway genes, which show elevated rates of adaptive protein evolution (Obbardet al. 2006, 2009), signatures of selective sweeps (Kolaczkowskiet al.2011; Obbardet al.2011; Lewis
et al.2016), and sites with elevated protein evolution across the
Drosophilaphylogeny (Vermaaket al.2005; Heger and Ponting 2007; Kolaczkowskiet al.2011). For example, a comparison of the antiviral RNAi genesAGO2,Dcr-2, andr2d2to their miRNA functional counterparts with no known role in conflict (the paralogsAGO1,Dcr-1, andloqs) shows a striking difference in rates of protein evolution, as well as a greater rate of adaptive amino acid substitution (Obbardet al.2006). In addition, evo-lutionary rates of piRNA-pathway genes involved in transcrip-tional silencing are elevated and highly correlated with other piRNA-pathway genes across the Drosophila phylogeny (Blumenstielet al.2016).
Although some antiviral and anti-TE RNAi-pathway genes clearly display elevated rates of adaptive protein evolution in
Drosophila, the generality of this pattern remains to be elucidated. Here we apply both traditional McDonald–Kreitman (MK) (McDonald and Kreitman 1991) and SnIPRE-style (Eilertson
et al.2012) analyses as well as selective sweep-based analyses (Nielsenet al.2005; Pavlidis et al.2013) to publicly available genome-scale data from three dipterans, two lepidopterans, a hymenopteran, and two clade V nematodes (Sarkieset al.2015). By combining estimates across species, we investigate the specific RNAi subpathways that may be the target of elevated positive selection. This allows us to estimate the rates of adap-tation across species, thereby improving single-gene estimates and allowing us to identify genes that are undergoing parallel adaptation across the taxa analyzed. Finally, we summarize the evidence for recently completed and ongoing selective sweeps in
RNAi genes across these eight taxa. We conclude that rapid evolution of RNAi genes is a general phenomenon in these eight invertebrates, although evidence for recent sweeps is highly contingent on the focal species.
Materials and Methods
Selection of genes for analysis
Putative RNAi-pathway genes ofDrosophila melanogaster
andCaenorhabditis eleganswere used tofind homologs in six insects and two nematode species (Supplemental Material, Table S1andTable S2). For the six insect species, we
classi-fied these genes as miRNA, piRNA, siRNA, or viRNA based on a literature search (Table S1). Where a gene was implicated in more than one subpathway, we assigned it to the pathway that has been independently experimentally validated most often. Although the viRNA and siRNA pathways are not easily separa-ble, we make this distinction based on the hypothesis that these genes may be evolving adaptively in response to viruses, as these genes have direct experimental evidence of an antiviral role inD. melanogaster. We also split the piRNA-pathway genes among three functional categories: post-transcriptional silenc-ing effectors, transcriptional silencsilenc-ing effectors, and biogenesis machinery. A gene was considered a biogenesis factor if piRNA levels decrease upon loss of function, an effector if piRNA-pathway function is compromised without reducing piRNA levels, and a transcriptional silencing effector if the effector is involved in transcriptional silencing (Table S1). Finally, we selected 65 piRNA genes inD. melanogasterwith known tissue specificity to calculate rates of adaptation in the germlinevs.the somatic follicle cells (Table S3). This gene list contains the core of the piRNA-pathway genes independently validated in two of three screens for piRNA-pathway constituents (Czech et al.
2013; Handleret al.2013; Muerdteret al.2013).
Homologs of the D. melanogaster and C. elegans genes were identified using a two-step process. First, a hidden Markov model (HMMer) (Eddy 2008) was used tofind the best re-ciprocal best hits for a gene of interest using predicted pro-tein sets (if available) or UniProtKB. If no hit was found, then Exonerate was used to identify unannotated homologs in the genome using the model“protein2genome”(Slater and Birney 2005). If Exonerate was unable to model a homolog then this gene was classified as missing, either due to gene loss or an incomplete genome assembly. We defined genes as dupli-cates (paralogs) if multiple regions of a genome shared a best hit to a reference gene, and if these regions showed substantial se-quence divergence between them (i.e., they were not obviously a misassembly duplicate or allelic). Because the large divergence times between insects and nematodes and the complexity of RNAi pathways in nematodes make homology assignment un-certain, we restricted our gene-level analyses to insects.
Population genomic data
We used previously published population genomic data for
gambiae 1000 Genomes Consortium 2014), Heliconius melpomene (Kronforstet al.2013),Bombyx mandarina(Xia
et al.2009),Apis mellifera(Harpuret al.2014),Pristionchus pacificus(Rödelspergeret al.2014), andC. briggsae(Thomas
et al.2015) for our analyses (Table S4). For bothDrosophila
species, we used previously published haplotype data (haploid sequencing of D. melanogasterand inbred lines ofD. pseudoobscura). For the other taxa, we obtained raw sequencing reads from the European Bioinformatics Insti-tute European Nucleotide Archive (identifiers provided in Table S4) and mapped them to the most recent reference genome for each species using Bowtie2 (Langmead and Salzberg 2012) with default settings. We used GATK’s HaplotypeCaller on each individual separately (DePristo
et al. 2011) to call variants in a 200-kb region surrounding each gene of interest (i.e., 100 kb either side of the RNAi gene, unless the contig was,200 kb). For high coverage data sets (A. mellifera,H. melpomene,C. briggsae,A. gambiae, andP. pacificus) we excluded sites with a read depth lower thanfive, but we reduced this threshold to two for the low-coverageB. mandarina. All sites above thisfilter were included in the analysis. After mapping andfiltering sites we created two randomly resolved pseudohaplotype sequences per individual (i.e., without any phase information) from the sites that remained, and these were used for downstream analyses (none of which depend on phase). Only one haplotype was sampled from each
C. briggsaeandP. pacificusindividual, as the sequenced individ-uals were reported to be highly homozygous. InH. melpomene, we occasionally observed long stretches of high divergence shared by multiple individuals. We assumed these to be possible cases of either contamination, inversions that have recently risen to a high frequency, or introgression (Pardo-Diazet al.2012), and we removed these haplotypes.
To calculate divergence between genes we used the out-group speciesD. simulans,D. miranda,H. hecale,B. huttoni,A. christyi, andA. melas; and to polarize mutations for sweep anal-yses we usedA. cerana,C. nigoni, andP. exspectatus(Table S4). Out-groups were selected based on their divergence from the in-group species (1–10% divergence of all sites) and on the availability of genomic data. ForA. gambiae we tested out-groups with low (A. melas) and high (A. christyi) diver-gence times, as mostAnophelesspecies are too close or too divergent to provide a robust out-group for MK tests (Obbard
et al. 2007), and our results remain qualitatively the same for both out-groups (A. melasused for the presented analyses). ForD. simulans(FlyBase, r2.02),D. miranda(Pseudobase, MSH22 strain),A. melas (VectorBase, CM1001059 strain, AmelC1 assembly),A. christyi(VectorBase, ACHKN1017 strain, AchrA1 assembly),B. huttoni(Sacktonet al.2014) (BioProject PRJNA198873), andP. exspectatus(WormBase, Bioproject PRJEB6009), the out-group reference assemblies were pub-licly available and used as provided. However, theC. nigoni
reference assembly sequence is contaminated with the more divergent nematodeC. afra(Thomaset al.2015), andC. nigoni
is the only currently suitable out-group forC. briggsae. We there-fore applied a sliding window across the alignments between
C. nigoni andC. afra, and arbitrarily excluded regions that were.6 SD from the mean divergence. Published reference assemblies were not available forA. ceranaandH. hecale. To generate out-group sequences for these species, we iteratively remapped reads (H. hecale: ERR260306; A. cerana: SRR957079) to the respectiveA. melliferaandH. melpomenereferences, each time updating the previous reference with homozygous nonreference calls. These reads were mapped with Bowtie2 and then remapped with the divergent alignment software Stampy (Lunter and Goodson 2011). Homozygous nonre-ference calls (enriched for sites divergent between the in-group and out-in-group) were made with GATK’s HaplotypeCaller, with the heterozygosity parameter set to the expected di-vergence between species. Such sequences will not perfectly reflect the true out-group sequence and they are expected to be biased toward the in-group, downwardly biasing es-timates of divergence in high-divergence regions. However, we confirmed that this approach works well by iteratively mappingD. simulanstoD. melanogasterand then compar-ing the result with the known D. simulansassemblies (KS=
0.10 for iterative mappingvs. KS= 0.12 for the true assembly).
While bias probably remains, it is unlikely to spuriously elevate the inferred rates of one class of genes relative to the other. More generally, our approach to mapping,fi lter-ing, and variant calling may be prone to such biases, but they are unlikely to differentially affect gene classes of different function.
For the MK-based analyses, target sequences were aligned as amino acids using MUSCLE (Edgar 2004) and then each gene alignment was examined manually to remove putative misalignments. Likely misalignments were identified by eye as regions of unusually high divergence with no amino acid similarity to the consensus sequence, often occurring at the ends of the gene. We assumed these were caused by misassembly and removed these blocks from the alignment. Within-species data were alignedfirst, and then a consensus sequence of this alignment was used to align against the out-group sequence. Synonymous and nonsynonymous substitutions between species were inferred using codeml from the PAML package using the YN00 model (Yang and Nielsen 2000), which estimates substitution rates using an approximation to maximum likelihood methods, while accounting for base composition differences between codon positions and differences in transition/transversion rates.
Rates of adaptive protein evolution by pathway
several maximum likelihood and Bayesian methods to esti-matea, the proportion of nonsynonymous substitutions that are adaptive (Charlesworth 1994; Fayet al.2001, 2002; Smith and Eyre-Walker 2002; Sawyeret al.2003; Bierne and Eyre-Walker 2004; Welch 2006). However,aand related statistics can be biased by slightly deleterious mutations. This is because such mutations are unlikely tofix but do contribute substan-tially to polymorphism (McDonald and Kreitman 1991; Eyre-Walker 2002; Charlesworth and Eyre-Walker 2008; Eyre-Walker and Keightley 2009; Gossmann et al.2012). We used DFE-alpha and SnIPRE to estimate rates of adap-tive evolution. These complementary approaches model the population-genetic processes responsible for these biases (DFE-alpha) or the resulting genome-wide variability caused by these biases (SnIPRE) (Eyre-Walker and Keightley 2009; Eilertsonet al.2012).
In the first approach, we used an explicit population-genetic model to estimate the number of adaptive nonsynon-ymous substitutions per site (DFE-alpha; Eyre-Walker and Keightley 2009). This approach has the advantage that it provides direct estimates of the parameters of interest and it explicitly models changes in population size [as reflected by the site frequency spectrum (SFS) of unconstrained sites] and the distribution of deleterious fitness effects, which might otherwise bias estimates (Keightley and Eyre-Walker 2007; Eyre-Walker and Keightley 2009). However, as cur-rently implemented, this method does not allow data to be directly combined among species. Therefore, to obtain more precise homolog- and pathway-based estimates, we combined per-gene point estimates from DFE-alpha using a linear mixed model (including their estimated uncertainty; i.e., a meta-analysis; see Text S1 inFile S1). In the second approach, we used an extension of the SnIPRE model (Eilertsonet al.2012), which reframes the MK framework as a linear model in which polymorphism and substitution counts are predicted by syn-onymous or nonsynsyn-onymous state. Although this model does not explicitly consider the same underlying population-genetic processes, it does permit a straightforward extension to na-tively include gene, homolog, pathway, and host species as predictors, and therefore provides a direct test of the questions of interest (although at a cost of potentially less accurate or arbitrarily scaled parameter estimates; see Text S1 inFile S1). We have reimplemented the SnIPRE model using the Bayesian generalized linear mixed modeling R package MCMCglmm (Hadfield 2010). A detailed description of the study design and analytical and statistical methods is provided in Text S1 inFile S1, along with annotated R code necessary tofit the described models.
Selective sweep analysis
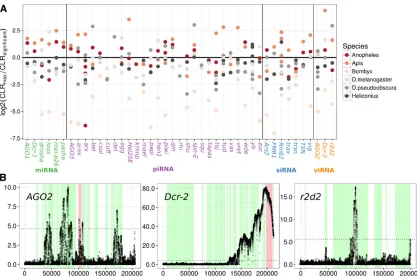
The recent spread of a positively selected allele leaves char-acteristic patterns of diversity and allele frequencies in the genomic region surrounding the selected site, and these can be used to detect recent adaptive substitutions (e.g., Smith and Haigh 1974; Barton 1998; Nielsenet al.2005). We used SweeD (Pavlidis et al.2013; derived from Sweepfinder,
Nielsenet al.2005) to search for evidence of recent selective sweeps in the regions surrounding RNAi genes. The algorithm scans the genome and at a user-defined interval calculates the composite likelihood of the observed SFS under a model of a selective sweep centered on that site vs. a standard neutral model. The ratio of the two composite likelihoods (CLR) is then used as a test statistic, with significance assessed by coalescent simulation (see Figure S1 in File S2 and Text S2 inFile S1). We used this method to scan 200 kb (or less if the reference genome contig was,200 kb) surrounding each gene of interest in each species. For each focal region, we polarized the SFS by parsimony be-tween the out-group reference genome and the in-group consensus sequence, which we aligned with LastZ ungapped alignment (Harris 2007). This simple parsimony-based in-ference of ancestral states risks mispolarization of low fre-quency polymorphism as high frefre-quency-derived alleles; however, we assume this does not differentially affect con-trol and RNAi genes. We did not assume an ancestral state forfixed differences that were invariant in our in-group (i.e., these sites were folded). This will make the analysis more robust to possible errors during contig alignment, be-cause misalignment would manifest itself as regions of in-creased divergence between species. We included invariant sites in the analysis as a characteristic signature of a recent sweep is a lack of diversity; so including invariant sites in Sweepfinder analyses can greatly improve statistical power (Nielsen et al. 2005). This comes with a risk of increased false positives (Huberet al.2016), but including these sites should not differentially affect RNAi and control genes un-less there is a consistent difference in neutral mutation rates or depth of coverage between these two classes of genes. We have confirmed that there are no consistent differences in read depth between control and RNAi genes. The SweeD analysis provides CLR values for equidistant points across the genome, with CLR values forming a“peak”in areas with high support for a sweep. To assess whether RNAi genes have experienced more sweeps than control genes in six of our eight species (B. mandarinaandP. pacificuswere not tested because the published genome assemblies are unannotated), we counted the number of RNAi and control genes that overlapped significant peaks in the CLR statistic (based on the significance threshold provided by coalescent simulation; Figure S1 inFile S2and Text S2 inFile S1). If consecutive peaks occurred within 1 kb of each other, we classified them as a single broad peak, such that the contig was split into“sweep-positive”and“sweep-negative”areas. We then classified all genes along the contig as to whether they overlapped a sweep-positive area or not, and whether or not they were an RNAi gene. We used a binomial test to assess whether RNAi or control classes had more sweep-positive genes than expected given the summed gene length for each class.
simulations and modeled these values (CLRg) using the fol-lowing linear mixed model:
g
CLRklm¼ b0þbClass:lþuOrganism:mþeklm:
Here, bClass:l is afixed effect for the pathway each gene is assigned (miRNA, siRNA, piRNA, or viRNA),uOrganism:m is a random effect for speciesm, andeklmis the error term.
In the four organisms for which we have haplotype infor-mation (D. melanogaster,D. pseudoobscura,P. pacificus, andC. briggsae), we additionally tested for ongoing or soft sweeps using the haplotype-based nSL statistic (Ferrer-Admetllaet al.
2014). The nSL statistic is similar to the more widely used iHS statistic (Voight et al.2006) except that distance is mea-sured in polymorphic sites rather than the genetic map distance (Ferrer-Admetllaet al.2014). This genome scan calculates the average number of consecutive polymor-phisms associated with either the ancestral or derived al-lele at each polymorphic site along the contig across all pairwise comparisons. Areas with long-range linkage dis-equilibrium will therefore be identified through SNPs with extreme nSL values.
Data availability
The data used to fit the DFE-alpha meta-analysis and the cross-species SnIPRE analysis are provided on Figshare (Data S1 and S2 inFile S1; DOI: 10.6084/m9.figshare.5843991. v1). For DFE-alpha data, each line corresponds to a gene within a species, where we include the output of DFE-alpha, the bootstrap SE, and associated RNAi pathways. For the SnIPRE data, each line corresponds to a type of mutation in a gene in a species—such that there are four lines per gene– species combination, and includes associated RNAi pathways and the number of nonsynonymous and synonymous sites (LN
and LS). Gene alignments are available via Figshare (DOI:
10.6084/m9.figshare.5621455).
Results
Evidence of genome-wide adaptive substitution in insects, but not nematodes
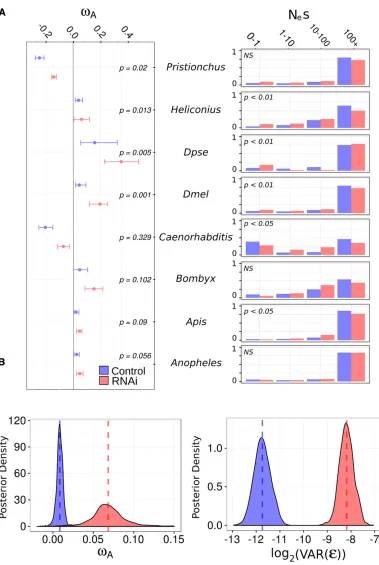
Position-matched“control”genes (lacking RNAi-related function) allowed us to estimate the average genome-wide rate of adaptation, assuming that proximity to RNAi gene has no effect on their rate of adaptive evolution. Our findings broadly agree with previous analyses; suggesting a substan-tial fraction of amino acid substitution is adaptive across in-sect species (Figure 1). All inin-sect species shared similar estimates (vA from 0.02 to 0.05) except for D. pseudoobscura, which
exhibited an extremely highvAvalue of 0.16 adaptive
nonsy-nonymous substitutions per synonsy-nonymous substitution per site with a 95% bootstrap interval [0.05, 0.32]. Although we only sampled two nematode lineages, it is notable that both
vAestimates were negative (C. briggsae:20.20 [20.25,20.15]; P. pacificus:20.24 [20.27,20.21]). This is consistent with the previously noted high ratio of nonsynonymous to synonymous
polymorphism (pA/pS) ratio in these species, and perhaps
sug-gests population structure and local adaptation (Rödelsperger
et al.2014; Thomaset al.2015). We also calculateda, or the proportion of adaptive substitutions for each species, which reflects the same patterns observed forvA(Figure
S2 inFile S2).
The cross-species SnIPRE-like model provides a formal comparison of adaptive divergence in the insect species. The structure of the model forces comparison relative to one species, for which we choseD. melanogaster.A. gambiaeand
B. mandarinahad levels of putatively adaptive nonsynony-mous divergence that were indistinguishable from those of
D. melanogaster (MCMCp = 0.489 and MCMCp = 0.616, respectively). Consistent with the DFE-alpha estimates of
vA,A. melliferaandH. melpomenehad significantly less
adaptive nonsynonymous divergence thanD. melanogaster
(MCMCp = 0.04 and MCMCp ,331024, respectively);
whereas D. pseudoobscura had an increased excess of nonsynonymous divergence (MCMCp = 0.0005). Other species-specific SnIPRE parameters can be found in Text S1 inFile S1.
RNAi genes consistently display more adaptive protein substitution than other genes
For each focal species, we estimated the distribution offitness effects of new mutations using DFE-alpha for RNAi-pathway and non-RNAi (control) genes. Wefitted two models, one in which RNAi and control genes shared a single distribution of
fitness effect (DFE), and the second in which each class of gene had a separate DFE. We then compared these models using a likelihood ratio test. InD. melanogaster,D. pseudoobscura,H. melpomene, A. mellifera, and C. briggsae, models in which control and RNAi genes have separate DFE parametersfitted the data significantly better than a model in which the two classes share a single DFE (Figure 1). Although there is no clear or universal trend, the DFE of control genes generally seemed slightly shifted toward more deleterious mutations than RNAi genes. For example, in most lineages (not D. pseudoobscura or A. gambiae), the estimated DFE had a higher proportion of strongly deleterious mutations in con-trol genes than RNAi genes, which suggests less constraint in RNAi genes. However, the overall shape of the DFE is quite different between species. This either indicates that in these species gene function may play a smaller role than other factors in patterns of polymorphism, such as the ef-fective population size, or that the DFE is estimated with low precision.
We then compared rates of adaptive amino acid substitu-tion in RNAi genes to those in the non-RNAi control genes in each lineage by pooling polymorphism and divergence data for the two classes as input to DFE-alpha (Figure 1). In every species tested, the point estimate of class-widevAwas greater
gene estimates ofvAin a linear mixed model framework (i.e., a
meta-analysis) to estimate cross-species rates of adaptive evo-lution in control and RNAi genes (Model 1 in Text S1 inFile S1 and Figure 1). We found the cross-speciesvAwas significantly
greater for RNAi genes than control genes, estimated asvA=
0.062 [0.049, 0.078] vs. vA= 0.01 [0.0009, 0.019] (P ,
0.001). In addition, the residual gene-level variance was also much greater (MCMCp ,0.001) for RNAi genes (0.0037,
[0.0022, 0.0051]) than control genes (0.0003, [0.0001, 0.0004]), implying thatvAis more variable in this class than
among genes in general and consistent with a subset of RNAi genes or pathways undergoing extreme rates of adap-tive amino acid substitution (Figure 1). However, the
coef-ficient of variation was not significantly different between RNAi and control genes, indicating these differences in residual variances are consistent with a mean–variance
Figure 1 vAand the DFE differ between RNAi genes and other genes. (A) Left: For each species,
vAestimates and 95% bootstrap confidence intervals are plotted for control (i.e., non-RNAi; blue) and RNAi (red) genes. Signifi -cance was determined by per-mutation. Right: The estimated discretized DFE for each species, with the proportion of mutation with deleterious Nes values in each category given for non-RNAi (blue) and RNAi (red) genes. (B) The posterior distribution of estimated
relationship in the rates of RNAi-pathway genes (Figure S4 inFile S2).
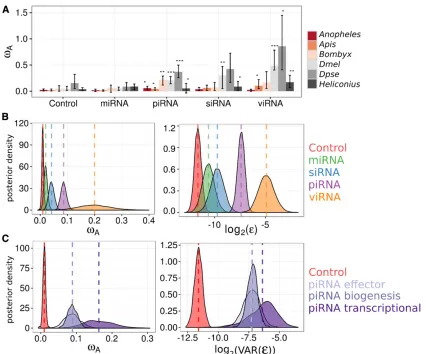
Adaptive rates are high in piRNA and viRNA pathways
The higher rate of adaptive substitution seen in RNAi genes as a whole could result from slightly elevated positive selection across all components, or to a subset of the genes or pathway being substantially elevated. The higher gene-level variance seen in RNAi genes (above) suggests the latter, and to test this we pooled polymorphism and divergence data by subpathway for each insect species to calculate rates of adaptation in miRNA, siRNA, viRNA (i.e., confirmed antiviral siRNA inD. melanogaster), and piRNA pathways (Figure 2). In each spe-cies, the piRNA pathway exhibited a significantly greater rate of adaptive amino acid substitution than control genes, and miRNA-pathway genes showed similar rates to control genes.
Rates of adaptation for the siRNA (both endo-siRNA and viRNA) pathway were greater in only a subset of lineages. The magnitude of rates and proportion of lineages nominally significant in the test increased upon removing endo-siRNA genes and restricting the analysis to viRNA genes only. For all subsequent analyses, we analyzed these pathways separately to test the hypothesis that the core antiviral RNAi genes have elevated rates of adaptive evolution.
To formalize the effect of pathway (miRNA, piRNA, non-antiviral endo-siRNA, or viRNA) while accounting for vari-ability in adaptation across species (Model 2 in Text S1 inFile S1and Figure 2), we performed a meta-analysis ofvA
esti-mates in individual genes from DFE-alpha,fitting pathway as afixed effect. The piRNA, viRNA, and endo-siRNA pathways were each significantly different from control genes (control
vA=0.01 [0.002, 0.018]; piRNA MCMCp,0.001; viRNA
MCMCp = 0.002; siRNA MCMCp = 0.004; for MCMCp value calculation, see the Text S1 in File S1), with cross-species estimates ofvAof 0.08 [0.06, 0.10], 0.18 [0.06, 0.30], and
0.03 [0.01, 0.05], respectively. The viRNA-pathwayvA
esti-mate was not significantly greater than the piRNA pathway (MCMCp = 0.07), but was greater than the endo-siRNA path-way (MCMCp = 0.01), and the miRNA pathpath-way (MCMCp, 0.001). ThevAestimate for the piRNA pathway was signifi
-cantly greater than the endo-siRNA (MCMCp = 0.002) and the miRNA pathways (MCMCp,0.001). Consistent with our analysis of pooled polymorphism and divergence data, the rate of adaptive evolution in the miRNA pathway (vA =
0.01 [20.001, 0.02]; MCMCp = 0.09) was not significantly different from control genes. Our linear models included pathway-specific error variances, which were lower for con-trol genes (3 [2, 4] 3 1024) and miRNA-pathway genes
(7 [2, 12]31024) than for endo-siRNA (13 [4, 22]31024),
piRNA (66 [37, 97] 3 1024), and viRNA-pathway genes
(0.04 [0.007, 0.86]); consistent with a great variation in adap-tive rates in these pathways. As in the comparison between RNAi and control genes, these elevated variances in piRNA, siRNA, and viRNA pathways could be explained by the elevated mean rates in these pathways (Figure S4 inFile S2).
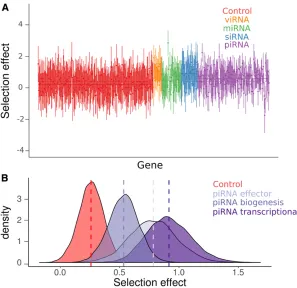
We repeated the subpathway-level analysis using a SnIPRE-like model (Eilertsonet al.2012) to estimate the average se-lection effect within subpathways across organisms, without making any explicit assumptions about the DFE. Although SnIPRE can be used to provide estimates of population-genetic parameters, we limit our discussion to the“selection effect” statistic, where negative values are consistent with constraint
and positive values with adaptive protein evolution, and mag-nitude reflects the strength of positive or negative selection. Consistent with our analysis of DFE-alpha estimates, the SnIPRE model identified a mean positive selective effect estimated across species (selective effect = 0.25 [0.02, 0.46], MCMCp = 0.03), with large variance among genes (Figure 3). Again, viRNA, endo-siRNA, and piRNA pathway-level selection effects were significantly elevated compared to control genes (viRNA: 1.10 [0.63, 1.57], MCMCp,53 1024; nonantiviral siRNA: 0.96 [0.44, 1.52], MCMCp =
0.02; piRNA: 0.63 [0.44, 0.84], MCMCp,331024); with
the viRNA pathway exhibiting a significantly larger effect than the piRNA (MCMCp = 0.006), but not the endo-siRNA (MCMCp = 0.66). In agreement with the DFE-alpha analy-sis, the miRNA pathway was not significantly different from control genes (MCMCp = 0.07) and had a selection effect of 0.53 [0.20, 0.86].
Adaptation is elevated in all major piRNA-pathway functions, but is most enriched in transcriptional silencing
Rapid adaptation in DrosophilapiRNA-pathway genes has been hypothesized to be the result of fluctuating selection for increased TE defense and decreased off-target genic si-lencing (Blumenstielet al.2016). A prediction of this hypoth-esis is that genes involved in transcriptional silencing would be under increased positive selection. We tested this predic-tion by further dividing the piRNA pathway into effectors (e.g., PIWIs), biogenesis factors (e.g., adapter proteins), and transcriptional silencing factors, and then using single-gene
polymorphism and divergence data to estimatevAand the
selection effect for each piRNA functional category (Model 3 in Text S1 inFile S1). We found all piRNA functional groups are significantly greater than control genes (MCMCp , 0.001) (Figure 2C), and that transcriptional silencing genes (vA= 0.16 [0.08–0.25]) have greater adaptive rates than
effectors (MCMCp = 0.04,vA= 0.08 [0.04–0.13]) and
bio-genesis factors (MCMCp = 0.03, vA= 0.08 [0.05–0.11]).
This result holds when excludingDrosophilatranscriptional silencing factorsrhino,deadlock, andcutoff, which are prod-ucts of recent gene duplication orde novoformation (Figure S3 inFile S2), and may not have evolutionary rates that are directly comparable to other genes.
We also estimated the average selection effect for each functional process of the piRNA pathway using the SnIPRE approach. Similar to the DFE-alpha meta-analysis, we find that all piRNA functional categories have elevated positive selection relative to control genes (biogenesis: MCMCp = 0.018; effector: MCMCp = 0.012; transcriptional silencing: MCMCp = 0.0004), that transcriptional silencing factors had the largest average selection effect of 0.92 [0.58, 1.31], and that genes involved in transcriptional silencing were signifi -cantly greater than biogenesis factors (selection effect: 0.53 [0.29, 0.78], MCMCp = 0.027) (Figure 3B). In contrast to the DFE-alpha meta-analysis, however, genes involved in transcrip-tional silencing were not significantly greater than effector genes (0.78 [0.40, 1.19], MCMCp = 0.68), and pathway-level point estimates of these selection effects were much closer (Figure 2C and Figure 3B).
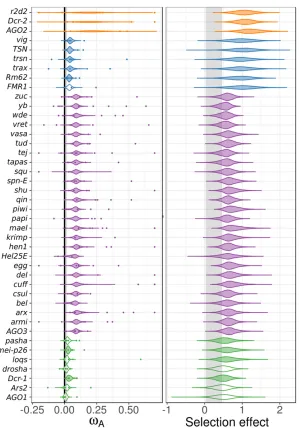
Individual genes in the piRNA and viRNA pathway show elevated adaptation
The higher overall rates of adaptive protein substitution seen in RNAi genes may result from the engagement of some genes in an evolutionary arms race (e.g., with viral suppressors of RNAi), a response to the selection imposed by the invasion of novel parasites (e.g., TEs), or a trade-off between the
speci-ficity and sensitivity of genome defense (Obbardet al.2006; Aravinet al.2007; Blumenstielet al.2016). We used a linear mixed model to combine single-gene estimates ofvAfrom
DFE-alpha across multiple species to identify candidate arms-race genes in the RNAi pathways,fitting subpathway as afixed effect with homolog and organism as random effects and subpathway-specific error variances. We found little var-iation among genes in a subpathway after accounting for subpathway, and in most cases there was not enough infor-mation to differentiate individual genes from the subpathway mean (Figure 4, left). Consequently, all genes in the rapidly evolving viRNA and piRNA subpathways were identified as having significantly greater adaptive rates than control genes. Most (five of six) siRNA-pathway genes, and two of seven miRNA-pathway genes were also identified as having significantly elevated adaptive rates. Although a model that accounts for pathway is statistically preferable if pathways are meaningful, any errors in assigning pathway“ member-ship”would introduce bias to the estimates for misclassified
genes. We therefore also estimated homolog-specific effects in a model that excludes the subpathway effect (Model 2B in Text S1 inFile S1). This modelfinds significant evidence for positive selection in fewer genes (Figure S5A in File S2), including 13 of 22 piRNA genes, 2 of 3 viRNA genes, and no genes in the siRNA or miRNA pathway.
We also performed this homolog-level analyses using the SnIPRE approach. Similar to the DFE-alpha meta-analysis, we found very little information after accounting for subpathway (Figure 4, right), resulting in low among-gene variation within RNAi subpathways. When we excluded subpathway effects, we found a similar result to the homolog-level DFE-alpha meta-analysis without subpathway, except fewer piRNA-pathway genes are nominally significant (6 of 22 genes) (Figure S5B in File S2). Notably,maelstrom,eggless,piwi(incorporating the dipteran duplicateaub),AGO2, andDcr-2were found to have significantly elevated positive selection across all four homolog-level analyses (i.e., with or without imposing a subpathway classification).
MK tests are commonly used to test for positive selection in individual genes. SnIPRE selection effects can be used to perform an analogous test for selection, except the approach can gain power by taking in the genome-wide distribution of polymorphism and divergence patterns byfitting gene as a random effect (Eilertsonet al.2010). We found that 36% of RNAi genes show nominally significant evidence for adaptive protein evolution across species analyzed. In contrast, only 5% of selection effects in control genes were significantly positive (Figure S6 in File S2). At the pathway level, 40% of piRNA genes, 44% of viRNA genes, 26% of nonantiviral siRNA-pathway genes, and 25% of miRNA-pathway genes had significantly positive selection effects (Figure S6 inFile S2). No gene had positive selection effects in every lineage, althougharmitage,capsuleen,cutoff,tudor,vasa,vretano, and
Ybhomologs were identified in over half the lineages.
Selective sweeps are detectable across functional classes of RNAi genes
(D. melanogaster:P= 0.0006;A. mellifera:P= 0.015;A. gambiae:P= 0.0001; D. pseudoobscura: P= 73 1025).
However, wefind no difference among subpathways in the frequency with which we detected recent sweeps. General differences in constraint between RNAi and control genes could bias these results, perhaps through misidentification of reduced diversity caused by elevated negative or back-ground selection as a sweep. However, DFE-alpha and SnIPRE analyses suggest RNAi genes are less constrained (Figure 1 and Text S1 in File S1, Model 3A, nonsynony-mous:piRNA effect), making our analysis conservative. None of the genes exhibited a significant CLR peak across all organisms tested, althoughspn-Eandvigdisplay signif-icant evidence of recent sweeps in five of the six insect lineages. It was notable that 34% of the variation in the per-gene maximum CLR test statistic was attributable to species, consistent with either sample size or demographic history playing a substantial role in our power to detect sweeps.
Sweep signatures were the most pronounced inA. melli-fera, in both the CLR magnitude and breadth of the genomic region affected (Figure 5 and Figure S12 inFile S2). These were associated with large regions devoid of any polymor-phism, despite the high rate of recombination seen in hon-eybees (Beyeet al.2006), which is expected to narrow the region affected by a nearby sweep. We also searched for evidence of haplotype structure, as would be expected during an ongoing or soft selective sweep using the nSL statistic (data not shown). However, there were no strong signals in any of the RNAi genes for which we had haplo-type information.
Discussion
Using both DFE-alpha and SnIPRE-like MK analyses, we identify elevated rates of adaptive evolution in RNAi-pathway genes across six insects and two nematodes. In most species, the RNAi-pathway genes were also more likely to display
evidence of a recent selective sweep. As inDrosophila, genes involved in the suppression of viruses and TEs show the high-est rates of adaptive evolution, consistent with these genes being engaged in an arms race in multiple invertebrate line-ages. We were able to extend past Drosophilaanalyses by combining genic rates of adaptive evolution across species to infer positive selection associated with particular RNAi-pathway functions and homologs. We found accelerated ad-aptation across piRNA-pathway functions, including piRNA biogenesis machinery, effector proteins, and especially tran-scriptional silencing machinery. Although there was substan-tial variation in rates among RNAi genes, the antiviral genes
AGO2andDcr-2and the piRNA-pathway genes maelstrom,
eggless,piwi,aub,armitage,capsuleen,cutoff,tudor,vasa,vretano,
spn-E,vig, andYbshow consistently strong signatures of positive selection.
Identification of rapidly evolving pathways by DFE-alpha and SnIPRE
Estimated rates of adaptive protein evolution in an MK-framework (McDonald and Kreitman 1991) can be biased by past population size changes and slightly deleterious mutations that segregate at low frequencies (McDonald and Kreitman 1991; Eyre-Walker 2002; Fay et al. 2002; Smith and Eyre-Walker 2002; Sawyeret al.2003; Bierne and Eyre-Walker 2004;
Welch 2006; Charlesworth and Walker 2008; Eyre-Walker and Keightley 2009; Gossmannet al.2012). Here we attempted to account for these biases by explicitly modeling the DFE and demographic history using DFE-alpha (Eyre-Walker and Keightley 2009), or by modeling the genome-wide patterns of polymorphism and diver-gence with SnIPRE (Eilertson et al. 2012). We expect these methods to complement one another. Both methods assume that demographic history affects all loci in a sim-ilar manner, but SnIPRE is better able to capture variabil-ity across loci in these effects, while DFE-alpha conditions on a point estimate. In addition, both methods can be biased by variation in the DFE, but under different cir-cumstances. The DFE-alpha meta-analysis assumes a sim-ilar DFE for all genes, which may bias single-gene vA
estimates in either direction, depending on the true DFE of a gene. SnIPRE, like traditional MK-style analyses, does not take into account the SFS, and so can be biased by slightly deleterious mutations which will downwardly bi-as selection effects. Therefore, for single-gene analyses SnIPRE is more conservative, while DFE-alpha can be more powerful if the SFS and DFE parameters are accu-rately estimated.
Most of the qualitative results of each of these analyses agree that genes in the piRNA and viRNA pathways are evolving
adaptively. However, SnIPRE and DFE-alpha analyses dis-agree on the relative differences in the rate of adaptive evolution among subpathways. For example, the DFE-alpha meta-analysis provides low point estimates for the endo-siRNA and miRNA pathways relative to the piRNA and viRNA; but SnIPRE identifies the endo-siRNA selection effect as higher than the piRNA, and piRNA genes closer to the miRNA. As noted above, this incongruence could reflect differences in the DFE between subpathways; genes in the miRNA and endo-siRNA pathways are highly conserved and have low rates of protein evolution, while mechanisms of piRNA-pathway function are surprisingly diverse across animals (e.g., Morazzaniet al.2012; Sarkieset al.2015). These differences in constraint could lead to an underestimation of miRNA- and endo-siRNA-pathway adap-tation and overestimation of piRNA adapadap-tation in the DFE-alpha analyses, and could indicate that estimating the DFE separately for each subpathway may improve estimates.
Adaptive protein evolution across species is enriched in specific functional pathways
We found large differences in rates of adaptive protein substitution between insects and nematodes, but less variation among insect species. In an ANOVA, wefind that species explained only 11% of the variation in gene-level estimates ofvA, but gene and pathway
explained 42% of the variation in gene-levelvAestimates;
sug-gesting that gene function is a greater determinant of the rate of adaptive evolution than species. The elevated rate seen in piRNA-and viRNA-pathway genes across species could be caused by rapid adaptation in the same subset of genes in a pathway, or in a random selection of genes in a pathway. Homolog-level analysis of vAand selection effects (Figure 4 and Figure S5 inFile S2)
indicates it is probably both because subsets of homologs within pathways show consistent evidence for elevated adaptive protein evolution, but homologous genes also exhibit high variances across species (but see Figure S4 inFile S2).
Much of the variation in adaptive rate is not attributable to species or conserved gene function, and it is necessarily difficult to ascribe this remaining variance to a source. It is likely that the great majority is derived from the sampling error associated with measuring polymorphism and divergence in a single gene, how-ever biological processes may also contribute. Functional diver-gence of a gene from its role inDrosophilacould affect the adaptive rate in that species. For example, the repurposing of the piRNA pathway to target viruses in mosquitoes might be expected to increase adaptive rates of any factors shared in both anti-TE and antiviral roles (Morazzaniet al.2012). Additionally, if conflict is driving the observed adaptation, then differences in the mag-nitude or frequency of conflict could change the adaptive poten-tial of a gene. In nature, this could be driven by differences in the diversity, frequency, or virulence of viral pathogens across species.
Potential drivers of adaptation in the viRNA pathway
It seems likely that the elevated rates of adaptive protein evolution we detect in the viRNA and piRNA pathways are a result of recurrent selection mediated by viruses and/or TEs. First, it is well established that defensive pathways show high
rates of adaptive evolution, presumably as a consequence of antagonistic coevolution with parasites (Stenseth and Smith 1984; Buckling and Rainey 2002; Patersonet al.2010; Brockhurst
et al.2014). For example, a recent analysis of virus-interacting proteins estimated that 30% of adaptive protein changes in mam-mals are driven by viruses (Enardet al.2016). Second, for the viRNA-pathway genes at least, viral suppressors of RNAi are strong candidates to be the driving agent. Many RNA and DNA viruses of invertebrates are known to have proteins or structural RNAs which actively block RNAi function (Liet al.2002; Van Rij
et al.2006; Nayaket al.2010; van Mierloet al.2012; Bronkhorst
et al.2014), and these can evolve rapidly and can be highly host specific, consistent with an arms-race scenario (van Mierloet al.
2014). Wefind thatAGO2andDcr-2display consistently elevated rates of adaptive protein substitution across insect species, with additional limited evidence of elevated adaptation inhen1, all of which have previously been identified as targets of active suppres-sion by viral proteins [viral suppressors of RNAi (VSRs)] (Van Rij
et al.2006; Vogleret al.2007; Nayaket al.2010; van Mierloet al.
2012; van Cleefet al.2014), lending credibility to the hypothesis that viruses may play a major role in driving the observed rapid evolution in RNAi genes.
Potential drivers of adaptation in the piRNA pathway
Whereas an arms race between antiviral RNAi genes and viral suppressors of RNAi is intuitive, the observed rapid adaptive evolution of piRNA-pathway genes is currently harder to explain. Similar to viruses, TEs are costly for their hosts and could, in principle, select for increased suppression (Charlesworthet al.
1994). However, piRNA-generating clusters ostensibly provide an adaptive defense that can arise on much shorter timescales than fixation of advantageous mutations, reminiscent of ac-quired immunity (Brenneckeet al.2007; Khuranaet al.2011; Hanet al.2015; Mohnet al.2015).
The adaptive response in piRNA genes could be mediated by at least three nonexclusive mechanisms: (i) direct piRNA-pathway suppression by TEs or by off-target VSRs, (ii) recurrent
higher TE diversity than somatic tissues, this is broadly sup-ported by our observation that piRNA-pathway genes with pri-marily germline function (Czech et al. 2013; Handler et al.
2013; Muerdteret al.2013) have higher rates of adaptive pro-tein evolution than those functioning in the somatic layer of cells surrounding the Drosophila ovary (Figure S15 in File S2); although this is difficult to disentangle from previous ob-servations that germline-specific genes have generally high adaptive rates (Choi and Aquadro 2015; Flores et al.2015). The genomic autoimmunity hypothesis (iii) goes further and proposes piRNA-pathway adaptation to TE invasions results in increased piRNA function and associated off-target genic effects, which are then selected against after the TE is suppressed (Castilloet al.2011; Blumenstielet al.2016). It could be argued that our analysis of adaptive rates in piRNA functions lends broad support for this, in that genes mediating transcriptional silencing show the greatest adaptive rates across species in the piRNA pathway, with additional evidence for rapid adaptation in biogenesis factors whose rates are expected to be correlated with the transcriptional machinery (Blumenstielet al.2016). However, our pathway-level and homolog-level analyses also
find signals of elevated adaptation in effector genes, which have rates that covary to a lesser degree with other piRNA factors (Blumenstiel et al. 2016). This does not refute the genomic autoimmunity hypothesis, but may suggest additional selective forces acting on the piRNA pathway, independent of genes, un-derlying a trade-off between sensitivity and specificity. Never-theless, our results would alsofit within the context of (ii) in a scenario where the transcriptional machinery has a greater evo-lutionary potential than the rest of the piRNA pathway.
Concluding remarks
Accelerated adaptive evolution in RNAi genes has been described in multipleDrosophilaspecies, where a subset of genes evolve adaptively in siRNA and piRNA pathways, but not the miRNA pathway. Our analyses extend the observation of rapid RNAi gene evolution, and generalize elevated positive selection in piRNA and viRNA pathways across six insect and two nematode species.
Acknowledgments
We thank Charles Langley and two anonymous reviewers for their constructive comments on the manuscript. We thank the authors of the previous studies who made their data publicly available. We thank Rob Ness and Peter Keightley for helpful advice on the analysis. W.H.P. is supported by the Darwin Trust of Edinburgh and this work in D.J.O.’s laboratory was partly supported by a Wellcome Trust Strategic Award to the Centre for Immunity, Infection and Evolution (WT095831). J.D.H. is supported by a Royal Society Research Fellowship (UF150696).
Literature Cited
Alvarez-Garcia, I., and E. A. Miska, 2005 MicroRNA functions in animal development and human disease. Development 132: 4653–4662.
Anderson, R. M., and R. M. May, 1982 Coevolution of hosts and parasites. Parasitology 85: 411–426.
Aravin, A. A., G. J. Hannon, and J. Brennecke, 2007 The Piwi-piRNA pathway provides an adaptive defense in the transposon arms race. Science 318: 761–764.
Barton, N. H., 1998 The effect of hitch-hiking on neutral geneal-ogies. Genet. Res. 72: 123–133.
Beye, M., I. Gattermeier, M. Hasselmann, T. Gempe, M. Schioett
et al., 2006 Exceptionally high levels of recombination across the honey bee genome. Genome Res. 16: 1339–1344.
Bierne, N., and A. Eyre-Walker, 2004 The genomic rate of adap-tive amino acid substitution in Drosophila. Mol. Biol. Evol. 21: 1350–1360.
Blumenstiel, J. P., A. A. Erwin, and L. W. Hemmer, 2016 What drives positive selection in the Drosophila piRNA machinery? The genomic autoimmunity hypothesis. Yale J. Biol. Med. 89: 499–512. Brennecke, J., A. A. Aravin, A. Stark, M. Dus, M. Kellis et al.,
2007 Discrete small RNA-generating loci as master regulators of transposon activity in Drosophila. Cell 128: 1089–1103. Brockhurst, M. A., T. Chapman, K. C. King, J. E. Mank, S. Paterson
et al., 2014 Running with the red queen: the role of biotic conflicts in evolution. Proc. R. Soc. B Biol. Sci. 281: 20141382. Bronkhorst, A. W., and R. P. van Rij, 2014 The long and short of antiviral defense: small RNA-based immunity in insects. Curr. Opin. Virol. 7: 19–28.
Bronkhorst, A. W., K. W. R. van Cleef, H. Venselaar, and R. P. van Rij, 2014 A dsRNA-binding protein of a complex invertebrate DNA virus suppresses the Drosophila RNAi response. Nucleic Acids Res.42: 12237–12248.
Buckling, A., and P. B. Rainey, 2002 Antagonistic coevolution be-tween a bacterium and a bacteriophage. Proc. Biol. Sci. 269: 931–936.
Carmell, M. A., Z. Xuan, M. Q. Zhang, and G. J. Hannon, 2002 The Argonaute family: tentacles that reach into RNAi, developmental control, stem cell maintenance, and tumorigenesis. Genes Dev. 16: 2733–2742.
Castillo, D. M., J. C. Mell, K. S. Box, and J. P. Blumenstiel, 2011 Molecular evolution under increasing transposable ele-ment burden in Drosophila: a speed limit on the evolutionary arms race. BMC Evol. Biol. 11: 258.
Charlesworth, B., 1994 The effect of background selection against deleterious mutations on weakly selected, linked variants. Genet. Res. 63: 213–227.
Charlesworth, B., P. Sniegowski, and W. Stephan, 1994 The evo-lutionary dynamics of repetitive DNA in eukaryotes. Nature 371: 215–220.
Charlesworth, J., and A. Eyre-Walker, 2008 The McDonald-Kreit-man test and slightly deleterious mutations. Mol. Biol. Evol. 25: 1007–1015.
Chen, Y.-W., S. Song, R. Weng, P. Verma, J.-M. Kugler et al., 2014 Systematic study of Drosophila microRNA functions us-ing a collection of targeted knockout mutations. Dev. Cell 31: 784–800.
Choi, J. Y., and C. F. Aquadro, 2015 Molecular evolution of Dro-sophila germline stem cell and neural stem cell regulating genes. Genome Biol. Evol. 7: 3097–3114.
Czech, B., and G. J. Hannon, 2016 One loop to rule them all: the ping-pong cycle and piRNA-guided silencing. Trends Biochem Sci. 41: 324–337.
Czech, B., C. D. Malone, R. Zhou, A. Stark, C. Schlingeheydeet al.,
2008 An endogenous small interfering RNA pathway in
Dro-sophila. Nature 453: 798–802.
endogenous siRNA pathway to suppress Tc3 transposon mobility in the Caenorhabditis elegans germline. Mol. Cell 31: 79–90. DePristo, M. A., E. Banks, R. Poplin, K. V. Garimella, J. R. Maguire
et al., 2011 A framework for variation discovery and genotyp-ing usgenotyp-ing next-generation DNA sequencgenotyp-ing data. Nat. Genet. 43: 491–498.
Deshpande, G., G. Calhoun, and P. Schedl, 2005 Drosophila ar-gonaute-2 is required early in embryogenesis for the assembly of centric/centromeric heterochromatin, nuclear division, nuclear migration, and germ-cell formation. Genes Dev. 19: 1680–1685. Duchaine, T. F., J. A. Wohlschlegel, S. Kennedy, Y. Bei, D. Conte, Jr.et al., 2006 Functional proteomics reveals the biochemical niche of C. elegans DCR-1 in multiple small-RNA-mediated path-ways. Cell 124: 343–354.
Ebert, D., 2008 Host–parasite coevolution: insights from the Daphnia– parasite model system. Curr. Opin. Microbiol. 11: 290–301. Eddy, S. R., 2008 A probabilistic model of local sequence
align-ment that simplifies statistical significance estimation. PLoS Comput. Biol. 4: e1000069.
Edgar, R. C., 2004 MUSCLE: multiple sequence alignment with high accuracy and high throughput. Nucleic Acids Res. 32: 1792–1797. Eilertson, K. E., J. G. Booth, and C. D. Bustamante, 2012 SnIPRE: selection inference using a Poisson random effects model. PLoS Comput. Biol. 8: e1002806.
Enard, D., C. G. Le Cai, C. Gwennap, and D. A. Petrov, 2016 Viruses are a dominant driver of protein adaptation in mammals. eLife 5: e12469.
Evgen’ev, M. B., H. Zelentsova, N. Shostak, M. Kozitsina, V. Barskyi
et al., 1997 Penelope, a new family of transposable elements and its possible role in hybrid dysgenesis in Drosophila virilis. Proc. Natl. Acad. Sci. USA 94: 196–201.
Eyre-Walker, A., 2002 Changing effective population size and the McDonald-Kreitman test. Genetics 162: 2017–2024.
Eyre-Walker, A., and P. D. Keightley, 2009 Estimating the rate of adap-tive molecular evolution in the presence of slightly deleterious mu-tations and population size change. Mol. Biol. Evol. 26: 2097–2108. Fay, J. C., G. J. Wyckoff, and C. I. Wu, 2001 Positive and negative
selection on the human genome. Genetics 158: 1227–1234. Fay, J. C., G. J. Wyckoff, and C.-I. Wu, 2002 Testing the neutral
theory of molecular evolution with genomic data from Drosoph-ila. Nature 415: 1024–1026.
Ferree, P. M., and D. A. Barbash, 2007 Distorted sex ratios: a window into RNAi-mediated silencing. PLoS Biol. 5: e303. Ferrer-Admetlla, A., M. Liang, T. Korneliussen, and R. Nielsen,
2014 On detecting incomplete soft or hard selective sweeps using haplotype structure. Mol. Biol. Evol. 31: 1275–1291. Flores, H. A., V. L. B. DuMont, A. Fatoo, D. Hubbard, M. Hijjiet al.,
2015 Adaptive evolution of genes involved in the regulation of germline stem cells in Drosophila melanogaster and D. simulans. G3 (Bethesda) 5: 583–592.
Ghildiyal, M., H. Seitz, M. D. Horwich, C. Li, T. Duet al., 2008 Endogenous siRNAs derived from transposons and mRNAs in Drosophila so-matic cells. Science 320: 1077–1081.
Gossmann, T. I., P. D. Keightley, and A. Eyre-Walker, 2012 The effect of variation in the effective population size on the rate of adaptive molecular evolution in eukaryotes. Genome Biol. Evol. 4: 658–667. Ha, M., and V. N. Kim, 2014 Regulation of microRNA biogenesis.
Nat Rev Mol Cell Biol. 15: 509–524.
Hadfield, J. D., 2010 MCMC methods for multi-response general-ized linear mixed models: the MCMCglmm R package. J. Stat. Softw. 33: 1–22.
Hall, I. M., K. Noma, and S. I. S. Grewal, 2003 RNA interference machinery regulates chromosome dynamics during mitosis and meiosis infission yeast. Proc. Natl. Acad. Sci. USA 100: 193–198. Han, B. W, W. Wang, C. Li, Z. Weng, and P. D. Zamore,
2015 piRNA-guided transposon cleavage initiates Zucchini-dependent, phased piRNA production. Science 348: 817–821.
Handler, D., K. Meixner, M. Pizka, K. Lauss, C. Schmied et al.,
2013 The genetic makeup of the Drosophila piRNA pathway.
Mol. Cell 50: 762–777.
Harpur, B. A., C. F. Kent, D. Molodtsova, J. M. Lebon, A. S. Alqarni
et al., 2014 Population genomics of the honey bee reveals strong signatures of positive selection on worker traits. Proc. Natl. Acad. Sci. USA 111: 2614–2619.
Harris, R. S., 2007 Improved Pairwise Alignment of Genomic DNA. Ph.D. Thesis, Pennsylvania State University, University Park, PA. Heger, A., and C. P. Ponting, 2007 Evolutionary rate analyses of orthologs and paralogs from 12 Drosophila genomes. Genome Res. 17: 1837–1849.
Huang, C., X. Wang, X. Liu, S. Cao, and G. Shan, 2015 RNAi
pathway participates in chromosome segregation in mammalian cells. Cell Discov. 1: 15029.
Huber, C. D., M. DeGiorgio, I. Hellmann, and R. Nielsen, 2016 Detecting recent selective sweeps while controlling for mutation rate and back-ground selection. Mol. Ecol. 25: 142–156.
Kawamura, Y., K. Saito, T. Kin, Y. Ono, K. Asaiet al., 2008 Drosophila endogenous small RNAs bind to Argonaute 2 in somatic cells. Nature 453: 793–797.
Keightley, P. D., and A. Eyre-Walker, 2007 Joint inference of the distribution offitness effects of deleterious mutations and pop-ulation demography based on nucleotide polymorphism fre-quencies. Genetics 177: 2251–2261.
Khurana, J. S., J. Wang, J. Xu, B. S. Koppetsch, T. C. Thomsonet al.,
2011 Adaptation to P element transposon invasion in
Dro-sophila melanogaster. Cell 147: 1551–1563.
Klattenhoff, C., and W. Theurkauf, 2008 Biogenesis and germline functions of piRNAs. Development 135: 3–9.
Kolaczkowski, B., D. N. Hupalo, and A. D. Kern, 2011 Recurrent adaptation in RNA interference genes across the Drosophila phylogeny. Mol. Biol. Evol. 28: 1033–1042.
Kronforst, M. R., M. E. Hansen, N. G. Crawford, J. R. Gallant, W. Zhanget al., 2013 Hybridization reveals the evolving genomic architecture of speciation. Cell Rep. 5: 666–677.
Lack, J. B., C. M. Cardeno, M. W. Crepeau, W. Taylor, R. B. Corbett-Detig
et al., 2015 The Drosophila genome nexus: a population genomic resource of 623 Drosophila melanogaster genomes, including 197 from a single ancestral range population. Genetics 199: 1229–1241. Langmead, B., and S. L. Salzberg, 2012 Fast gapped-read
align-ment with Bowtie 2. Nat. Methods 9: 357–359.
Lee, Y. C. G., and C. H. Langley, 2012 Long-term and short-term evolutionary impacts of transposable elements on Drosophila. Genetics 192: 1411–1432.
Lewis, S. H., C. L. Webster, H. Salmela, and D. J. Obbard, 2016 Repeated duplication of Argonaute2 is associated with strong selection and testis specialization in Drosophila. Genetics 204: 757–769.
Lewis, S. H., K. A. Quarles, Y. Yang, M. Tanguy, L. Frézal et al., 2018 Parthropod analysis reveals somatic piRNAs as an an-cestral defence against transposable elements. Nat. Ecol. Evol. 2: 174–181.
Li, H., W.-X. Li, and S.-W. Ding, 2002 Induction and suppression of RNA silencing by an animal virus. Science 296: 1319–1321. Lunter, G., and M. Goodson, 2011 Stampy: a statistical algorithm for sensitive and fast mapping of Illumina sequence reads. Ge-nome Res. 21: 936–939.
McDonald, J. H., and M. Kreitman, 1991 Adaptive protein evolu-tion at the Adh locus in Drosophila. Nature 351: 652–654. McGaugh, S. E., C. S. S. Heil, B. Manzano-Winkler, L. Loewe, S.
Goldsteinet al., 2012 Recombination modulates how selection affects linked sites in Drosophila.PLoS Biol.10: e1001422. Meister, G., 2013 Argonaute proteins: functional insights and
emerging roles. Nat. Rev. Genet. 14: 447–459.
Miesen, P., A. Ivens, A. H. Buck, and R. P. van Rij, 2016 Small RNA profiling in dengue Virus 2-infected Aedes mosquito cells reveals viral piRNAs and novel host miRNAs. PLoS Negl. Trop. Dis. 10: e0004452. Mohn, F., D. Handler, and J. Brennecke, 2015 piRNA-guided slic-ing specifies transcripts for Zucchini-dependent, phased piRNA biogenesis. Science 348: 812–817.
Morazzani, E. M., M. R. Wiley, M. G. Murreddu, Z. N. Adelman, and K. M. Myles, 2012 Production of virus-derived ping-pong-dependent piRNA-like small RNAs in the mosquito soma.PLoS Pathog8: e1002470.
Muerdter, F., P. M. Guzzardo, J. Gillis, Y. Luo, Y. Yuet al., 2013 A genome-wide RNAi screen draws a genetic framework for trans-poson control and primary piRNA biogenesis in Drosophila. Mol. Cell 50: 736–748.
Nayak, A., B. Berry, M. Tassetto, M. Kunitomi, A. Acevedo et al., 2010 Cricket paralysis virus antagonizes Argonaute 2 to modulate antiviral defense in Drosophila. Nat. Struct. Mol. Biol. 17: 547–554. Nielsen, R., S. Williamson, Y. Kim, M. J. Hubisz, A. G. Clarket al., 2005 Genomic scans for selective sweeps using SNP data. Ge-nome Res. 15: 1566–1575.
Obbard, D. J., F. M. Jiggins, D. L. Halligan, and T. J. Little, 2006 Natural selection drives extremely rapid evolution in an-tiviral RNAi genes. Curr. Biol. 16: 580–585.
Obbard, D. J., Y.-M. Linton, F. M. Jiggins, G. Yan, and T. J. Little, 2007 Population genetics of Plasmodium resistance genes in Anophe-les gambiae: no evidence for strong selection. Mol. Ecol. 16: 3497–3510. Obbard, D. J., J. J. Welch, K. W. Kim, and F. M. Jiggins, 2009 Quantifying adaptive evolution in the Drosophila immune system. PLoS Genet. 5: e1000698.
Obbard, D. J., F. M. Jiggins, N. J. Bradshaw, and T. J. Little, 2011 Recent and recurrent selective sweeps of the antiviral RNAi gene argonaute-2 in three species of drosophila. Mol. Biol. Evol. 28: 1043–1056.
Pardo-Diaz, C., C. Salazar, S. W. Baxter, C. Merot, W. Figueiredo-Readyet al., 2012 Adaptive introgression across species bound-aries in Heliconius butterflies. PLoS Genet. 8: e1002752. Paterson, S., T. Vogwill, A. Buckling, R. Benmayor, A. J. Spiers
et al., 2010 Antagonistic coevolution accelerates molecular evolution. Nature 464: 275–278.
Pavlidis, P., D. Zivkovic, A. Stamatakis, and N. Alachiotis, 2013 SweeD: likelihood-based detection of selective sweeps in thousands of genomes. Mol. Biol. Evol. 30: 2224–2234.
Peccoud, J., V. Loiseau, R. Cordaux, and C. Gilbert, 2017 Massive horizontal transfer of transposable elements in insects. Proc. Natl. Acad. Sci. USA 114: 4721–4726.
Petrov, D. A., J. L. Schutzman, D. L. Hartl, and E. R. Lozovskaya, 1995 Diverse transposable elements are mobilized in hybrid dysgen-esis in Drosophila virilis. Proc. Natl. Acad. Sci. USA 92: 8050–8054. Rödelsperger, C., R. A. Neher, A. M. Weller, G. Eberhardt, H. Witte
et al., 2014 Characterization of genetic diversity in the nema-tode Pristionchus pacificus from population-scale resequencing data. Genetics 196: 1153–1165.
Rozhkov, N. V., A. A. Aravin, E. S. Zelentsova, N. G. Schostak, R. Sachidanandamet al., 2010 Small RNA-based silencing strat-egies for transposons in the process of invading Drosophila spe-cies. RNA 16: 1634–1645.
Sackton, T. B., R. B. Corbett-Detig, J. Nagaraju, L. Vaishna, K. P. Arunkumaret al., 2014 Positive selection drives faster-Z evo-lution in silkmoths. Evoevo-lution 68: 2331–2342.
Sarkies, P., M. E. Selkirk, J. T. Jones, V. Blok, T. Boothbyet al.,
2015 Ancient and novel small RNA pathways compensate for
the loss of piRNAs in multiple independent nematode lineages.
PLoS Biol.13: e1002061.
Sawyer, S. A., R. J. Kulathinal, C. D. Bustamante, and D. L. Hartl, 2003 Bayesian analysis suggests that most amino acid replace-ments in Drosophila are driven by positive selection. J. Mol. Evol. 57: S154–S164.
Slater, G. S., and E. Birney, 2005 Automated generation of heuristics for biological sequence comparison. BMC bioinformatics 6: 31. Smith, J. M., and J. Haigh, 1974 The hitch-hiking effect of a
favourable gene. Genet. Res. 23: 23–35.
Smith, N. G. C., and A. Eyre-Walker, 2002 Adaptive protein evo-lution in Drosophila. Nature 415: 1022–1024.
Stenseth, N. C., and J. M. Smith, 1984 Coevolution in ecosystems: red queen evolution or stasis? Evolution 38: 870–880. TheAnopheles gambiae1000 Genomes Consortium, 2014 Ag1000G
phase 1 AR2 data release. MalariaGEN. http://www.malariagen. net/data/ag1000g-phase1-AR2.
Thomas, C. G., W. Wang, R. Jovelin, R. Ghosh, T. Lomaskoet al., 2015 Full-genome evolutionary histories of selfing, splitting, and selection in Caenorhabditis. Genome Res. 25: 667–678. Thomson, T., and H. Lin, 2009 The biogenesis and function of
PIWI proteins and piRNAs: progress and prospect. Annu. Rev. Cell Dev. Biol. 25: 355–376.
van Cleef, K. W., J. T. van Mierlo, P. Miesen, G. J. Overheul, and J. J. Fros, 2014 Mosquito and Drosophila entomobirnaviruses suppress dsRNA- and siRNA-induced RNAi. Nucleic Acids Res. 42: 8732–8744.
van Mierlo, J. T., A. W. Bronkhorst, G. J. Overheul, S. A. Sadanandan, J. O. Ekströmet al., 2012 Convergent evolution of argonaute-2 slicer antagonism in two distinct insect RNA viruses. PLoS Pathog. 8: e1002872.
van Mierlo, J. T., G. J. Overheul, B. Obadia, K. W. R. van Cleef, C. L. Webster et al., 2014 Novel Drosophila viruses encode host-specific suppressors of RNAi. PLoS Pathog. 10: e1004256. van Rij, R. P., M. C. Saleh, B. Berry, C. Foo, A. Houk et al.,
2006 The RNA silencing endonuclease Argonaute 2 mediates
specific antiviral immunity in Drosophila melanogaster. Genes Dev. 20: 2985–2995.
Vermaak, D., S. Henikoff, and H. S. Malik, 2005 Positive selection drives the evolution of rhino, a member of the heterochromatin protein 1 family in Drosophila. PLoS Genet. 1: e9.
Vogler, H., R. Akbergenov, P. V. Shivaprasad, V. Dang, M. Fasler
et al., 2007 Modification of small RNAs associated with sup-pression of RNA silencing by tobamovirus replicase protein. J. Virol. 81: 10379–10388.
Voight, B. F., S. Kudaravalli, X. Wen, and J. K. Pritchard, 2006 A map of recent positive selection in the human genome. PLoS Biol. 4: e72 [erratum: PLoS Biol. 5: e147; corrigenda: PLoS Biol. 4: e154 (2007)].
Wang, X.-H., R. Aliyari, W.-X. Li, H.-W. Li, K. Kimet al., 2006 RNA interference directs innate immunity against viruses in adult Drosophila. Science 312: 452–454.
Welch, J. J., 2006 Estimating the genomewide rate of adaptive protein evolution in Drosophila. Genetics 173: 821–837. Xia, Q., Y. Guo, Z. Zhang, D. Li, Z. Xuanet al., 2009 Complete
resequencing of 40 genomes reveals domestication events and genes in silkworm (Bombyx). Science 326: 433–436.
Yang, Z., and R. Nielsen, 2000 Estimating synonymous and non-synonymous substitution rates under realistic evolutionary mod-els. Mol. Biol. Evol. 17: 32–43.
Yi, M., F. Chen, M. Luo, Y. Cheng, H. Zhaoet al., 2014 Rapid evolution of piRNA pathway in the teleostfish: implication for an adaptation to transposon diversity. Genome Biol. Evol. 6: 1393–1407.