| INVESTIGATION
Compensatory Drift and the Evolutionary Dynamics
of Dosage-Sensitive Duplicate Genes
Ammon Thompson,*,†,1,2Harold H. Zakon,*,†and Mark Kirkpatrick*
*Department of Integrative Biology and†Department of Neuroscience, University of Texas, Austin, Texas 78712
ABSTRACT Dosage-balance selection preserves functionally redundant duplicates (paralogs) at the optimum for their combined expression. Here we present a model of the dynamics of duplicate genes coevolving under dosage-balance selection. We call this the
compensatory drift model. Results show that even when strong dosage-balance selection constrains total expression to the optimum, expression of each duplicate can diverge by drift from its original level. The rate of divergence slows as the strength of stabilizing selection, the size of the mutation effect, and/or the size of the population increases. We show that dosage-balance selection impedes neofunctionalization early after duplication but can later facilitate it. We fit this model to data from sodium channel duplicates in 10 families of teleostfish; these include two convergent lineages of electricfish in which one of the duplicates neofunctionalized. Using the model, we estimated the strength of dosage-balance selection for these genes. The results indicate that functionally redundant paralogs still may undergo radical functional changes after a prolonged period of compensatory drift.
KEYWORDSduplication; expression evolution; dosage balance; neofunctionalization; whole-genome duplication
T
HE fate of duplicate genes is characterized by two extremes: degeneration and the origin of biological novelty. Early models for the evolutionary dynamics of duplicates suggested that typically one member of a duplicate pair would quickly degenerate into a nonfunctional pseudogene (Haldane 1933; Ohno 1970). More rarely, a duplicate instead may evolve a novel function in a process calledneofunctionalization(Muller 1936; Ohno 1970; Ohta 1987). The time scale for either pseu-dogenization or neofunctionalization is expected to be on the order of a few million years (Lynch and Conery 2000).Recent research indicates, however, that the evolutionary dynamics for many duplicates are not so simple (Walsh 1995, 2003; Force et al.1999; Papp et al.2003; He and Zhang 2005; Rastogi and Liberles 2005; Scannell and Wolfe 2008; Qianet al.2010; Kondrashov 2012). Some genes aredosage sensitive, meaning that a change in their copy number alters expression and disrupts the stoichiometric balance of their gene products with those of other genes. Duplicates of
dosage-sensitive genes typically willfix in a population only if they originate in a whole-genome duplication (WGD), where all interacting partners duplicate together. Selection to maintain the stoichiometric relations between the products of duplicate genes, termed dosage-balance selection, can preserve dupli-cates as functionally redundant copies for prolonged periods of time (Birchleret al. 2001, 2005; Veitia 2002; Pappet al.
2003; Aury et al. 2006; Blomme et al. 2006; Freeling and Thomas 2006; Stranger et al. 2007; Qian and Zhang 2008; Edger and Pires 2009; Makino and McLysaght 2010; Konrad
et al.2011; Birchler and Veitia 2012; McGrathet al.2014a). Recent data on a pair of sodium channel duplicates in teleostfish are consistent with the expectations of the dosage-balance hypothesis (Thompsonet al.2014). The two dupli-cates, also called paralogs, have been conserved in muscle cells for over 300 million years since the teleost-specific WGD. In two independent lineages of electricfish, however, only one of the sodium channels is expressed in muscle cells. The other duplicate neofunctionalized and now plays a key role in the electric organ (Novak et al. 2006; Zakon et al.
2006; Arnegardet al.2010). These convergent neofunction-alization events happened on a very slow time scale, more than 100 million years after duplication (Arnegard et al.
2010; Lavouéet al.2012; Betancur-Ret al.2013). The phy-logenetic context for the evolution of the duplicates is shown in Figure 1.
Copyright © 2016 by the Genetics Society of America doi: 10.1534/genetics.115.178137
Manuscript received May 13, 2015; accepted for publication December 6, 2015; published Early Online December 9, 2015.
Supporting information is available online at www.genetics.org/lookup/suppl/ doi:10.1534/genetics.115.178137/-/DC1
1Present address: Department of Evolution and Ecology, University of California,
Davis, One Shields Avenue, Davis, CA 95616.
2Corresponding author: Department of Evolution and Ecology, University of California,
Davis, CA 95616. E-mail: [email protected]
Thompsonet al.(2014) proposed that in the teleost ances-tor the duplicates were preserved after WGD by dosage-balance selection. They hypothesized that under this selective constraint, one paralog gradually drifted to lower expression levels, while the other compensated by evolving higher expres-sion. Eventually, one paralog contributed so little to its original function that it could be neofunctionalized in the electric organ without major compromise to muscles. This mode of evolution also may explain comparative expression patterns observed in some ciliates (Gout and Lynch 2015) as well as some mammals (Lan and Pritchard 2015). This hypothesis raises theoretical and quantitative issues not previously explored. Can dosage-balance selection in fact maintain duplicates for hundreds of millions of years? Will this mode of evolution produce comparative patterns in a phylogeny that are dis-tinct from other models? And how does this evolutionary process affect the likelihood of neofunctionalization?
Here we develop a model for the evolution of paralog expression under dosage-balance selection. It envisions a process, which we callcompensatory drift, in which paralogs diverge by weakly selected mutations thatfix largely by drift. The model shows how key genetic parameters determine the time scale over which duplicates are maintained before one is lost or neofunctionalizes. The evolutionary dynamics are determined by just two compound parameters. Thefirst is a speed parameter that relates mutation, selection, and random genetic drift to the rate at which the duplicates’ expression
diverges. The second is a threshold parameter that determines the point at which expression of one duplicate is sufficiently low that it is largely relieved from dosage-balance constraints and free to evolve a novel function. The model predicts two phases of evolution. In the initial phase, the difference in expression between functionally identical paralogs drifts randomly while their combined expression remains nearly constant. In the second phase, the expression threshold is reached, and one of the duplicates quickly accrues function-altering substitutions.
Wefit the compensatory drift model to data from Thompson
et al.(2014) on the expression of sodium channel duplicates in 10 families of teleostfish. Our estimate for the speed pa-rameter is consistent with what is known about the biological parameters that feed into it, suggesting that compensatory drift is a plausible model for sodium channel evolution. Our estimate for the threshold parameter is, to our knowledge, the first available. Finally, we demonstrate that dosage-balance selection can greatly enhance the probability of neofunctional-ization compared to the classic neutral scenario. These results suggest that WGD, as well as contexts in which dosage-balance selection acts, may be a particularly rich source of genetic novelty for geologically long periods of time.
Materials and Methods
The model
After duplication, stabilizing selection favors an optimal total expression of two paralogs. A mutation that affects expression of either one will either increase or decreasefitness depending on whether it brings total expression closer to or further from the optimum. Mutations also experience random genetic drift, so there is a nonzero probability that both mildly deleterious and beneficial mutations will be established.
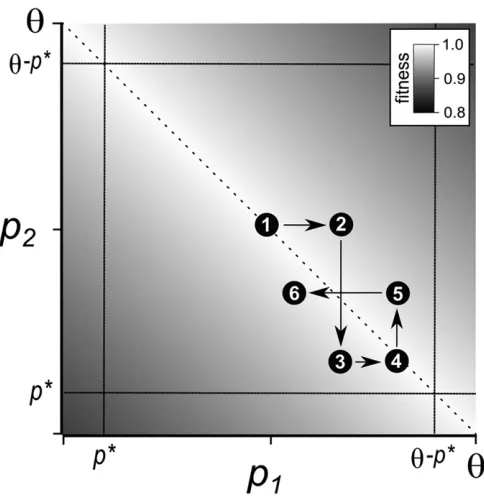
We visualize compensatory drift as a series offixation events that change the expression of the duplicates. A schematic of the process is shown in Figure 2. The two paralogs evolve in an anticorrelated pattern. Mutations in one duplicate can move the total expression away from its optimum. Compensatory mutations in the other duplicate tend to move total expression closer to the optimum. The result is that total expression re-mains close to the optimum, while the difference in their ex-pressionfluctuates randomly. The state of the population at any time is described by the total expression of the two duplicates and the difference in expression between them. If expression evolves to a point at which one of the duplicates produces the bulk of the gene product, selection is no longer strong enough to prevent function-altering substitutions from accruing in the paralog with lower expression. This threshold can be inter-preted as either the point where pseudogenization quickly oc-curs or where the benefit of neofunctionalization outweighs the fitness tradeoff from loss of the ancestral function.
Assumptions
The expression levels of two duplicates are denoted asp1and
p2. We assume that stabilizing selection acts on the sum of
Figure 1 Sodium channel expression and phylogenetic relationships of 10 teleostfish species. The families represented here span almost the entire teleost clade. The relative expression in skeletal muscle of the voltage-gated sodium channel genesScn4aaandScn4abis represented with pie charts for each of the 10 species. Thick red segments on the branches leading to the two electricfishEigenmannia veriscensand Gna-thonemus petersiiindicate the likely times when electric organs evolved andScn4aa neofunctionalized (Arnegardet al.2010; Betancur-Ret al.
expressionA¼ p1 þ p2. Thefitness function acting onAis proportional to a normal distribution with mean equal to the optimum for total expressionuand with variancev2(which are assumed to be constant in time). The variance parameter determines the strength of selection, where larger values of
v2indicate weaker stabilizing selection. No selection acts on the difference in expressionD¼ p12 p2.
Mutations occur in the regulatory regions of each of the four gene copies at a rate m per generation. They evolve according to a Fisher-Wright model of drift and selection. Mutations enter the population at a rate of 4Nm, whereNis the population size. Their effects on expression are additive. The effect of a given mutation onp1orp2, which we denote as
d, is normally distributed with mean 0 and variance s2
m. We therefore assume that the distribution of mutational effects is constant in time and independent of a gene’s current level of expression. Biologically, this means that the regulation of expression is free of complicated forms of epistasis.
New mutations are either lost orfixed under the combined forces of selection and drift. We assume that mutation is weak (4Nm1), so there is a negligible chance that more than one mutation will be segregating. (We will return to this point in the Resultssection, which suggests that the model also may be a good approximation when that assumption is violated.) Evolution thus proceeds by a series of fixation events at the two loci. This is a Poisson process, and the waiting time between mutations is exponentially distributed with mean of 1=ð4NmÞgenerations.
We calculate the fixation probability for each mutation using the diffusion approximation of Kimura (1962)
Pfix ¼
12e22s
12e24Ns (1)
wheresis the selection coefficient of the new mutation
s 2 d
2
2v2 (2)
Equation 2 is an approximation that neglects the deviation of the population from the optimum u. The approximation is valid when the SD of mutational effects is large relative to the typical deviation from the optimum. We verified the ac-curacy of the approximation using parameter values consistent with the data on teleost sodium channels from Thompsonet al.
(2014) (Supporting Information,File S1).
We assume that when the duplication occurs, the two paralogs have equal expression, and their total expression is optimal (D= 0 andA=u). As evolution proceeds, expres-sion of the duplicates eventually will fall to a threshold level, denotedp*, while its paralog rises tou2p*. At this point, the paralog with lower expression rapidly either becomes a pseu-dogene or neofunctionalizes. This threshold is represented in our model by a critical difference in the expression of the duplicatesD* =u22p*. IfDreaches eitherD* or2D*, then one or the other duplicate loses its original function.
Evolutionary dynamics
Our goal is to determine the probability distribution for expression levels at times following the duplication event. Simulations reveal that under plausible parameter values, evolutionary trajectories are confined to values of A that are very close tou(File S1). This suggests that the dynamics can be approximated by a one-dimensional diffusion in the expression differenceD=p12p2. We write the probability density ofDat timetfollowing the duplication asFðD;tÞ. The evolution of the density function is described by
@
@tFðD;tÞ ¼
1 2s
2 D
@2
@D2FðD;tÞ (3)
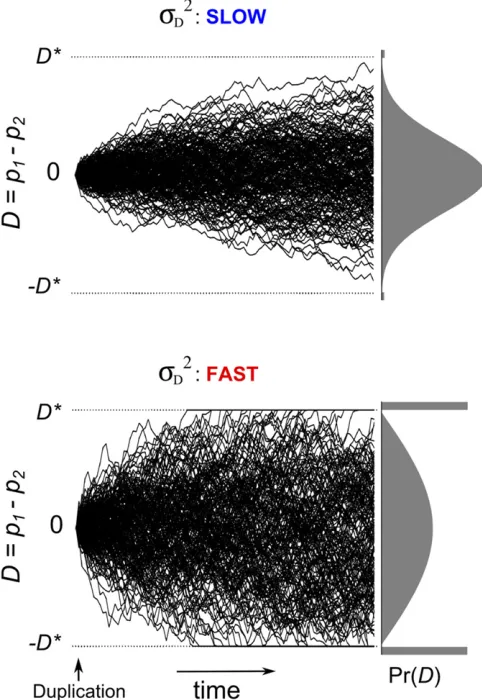
This is the heat equation (Cox and Miller 1965), wheres2D is the diffusion parameter. This parameter determines the speed at whichDevolves, and it equals the rate of increase in variance of the probability distributionDper generation.
File S2shows that
s2D¼k
mv3 smN3=2
(4)
where k is a constant that is independent of the model’s parameters. It is difficult to calculate analytically, so we de-termined its value (k1.543) numerically (File S2).
From Equation 4, we gain insight into the impact of bi-ological parameters on the speed at whichDevolves. Imagine that we follow a set of evolutionary lineages that began to
Figure 2 Schematic of the coevolution of paralog expression under com-pensatory drift. Axes show the expression of the duplicate genes, and
fitness is represented with a gray scale. The dashed diagonal line shows the maximalfitness wherep1+p2=u. The dotted vertical and horizontal lines show the expression thresholds where a duplicate loses its original function. A sequence of several consecutive expression changes is shown with numbered circles.
diverge independently after the duplication event. The vari-ance in the distribution ofDinitially increases at a constant rate and is equal to s2
Dt attgenerations after duplication. Thus, the diffusion rates2
Dsets the speed of divergence, as illustrated in Figure 3. Equation 4 shows how the biological parameters affect this speed. The speed is reduced by larger population sizes. Larger values ofNcause a greater number of mutations to enter the population in each generation but also increase the efficiency of purifying selection; the net re-sult is that a smaller number of mutationsfix (see Equation 1). Equation 4 also shows that the speed of divergence in-creases with higher mutation rates (largerm) and decreased strengths of selection (largerv2). A somewhat counterintui-tive result is that the speed of divergence declines as the average effect size of mutationssmincreases. This is so be-cause larger mutations are more likely to be strongly delete-rious and therefore very unlikely tofix.
To summarize the model, the probability density of D
evolves according to Equation 3, with initial conditionD= 0 att= 0 and with absorbing barriers at6D*. Before doing any further analysis, Equation 3 tells us a simple but impor-tant fact: although the model is based on six underlying bi-ological parameters (m,v,sm,N,u, andp*), the evolutionary dynamics are governed by only two: the speed parameter s2D and the thresholdD*.
The solution for the density function ofDis
FðD;tÞ ¼ ffiffiffiffiffiffiffiffiffiffiffiffiffiffi1
2ps2Dt
q XN
n¼2N
n
exp
2ðDþ4nD*Þ2
2s2 Dt
2exp
2ðDþ ð4n22ÞD*Þ
2
2s2Dt
o
(5)
for2D*,D ,D* (Cox and Miller 1965). The probability that one of the duplicates has either been lost as a pseudo-gene or has neofunctionalized aftertgenerations is
PlossðtÞ ¼12
R
D*
2D*
FðD;tÞdD
¼4PN
n¼0
F
ð4nþ3ÞD*
ffiffiffiffiffiffiffiffi s2Dt
q
2F
ð4nþ1ÞD*
ffiffiffiffiffiffiffiffi s2Dt
q
(6)
where Fdenotes the standard normal cumulative distribu-tion funcdistribu-tion (Cox and Miller 1965).
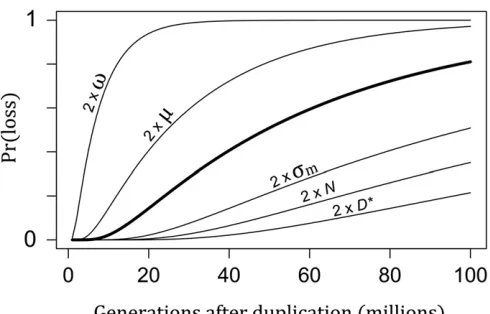
With Equation 6, we can infer how varying the biological parameters in Equation 4 affect the expected life span of duplicate genes. Figure 4 shows the result of varying each biological parameter of the model on the time scale of dupli-cate loss. These results imply that the time between duplica-tion and loss can be very long, especially for large populaduplica-tions, genes under strong dosage constraints (smallv), and genes with high expression (largeD*). To get some idea of the time scale, we can calculate the number of generations needed to reach a probability of 1/2 that one of the duplicates is lost using parameter values that are plausible for the electric
fish clades: a population sizeN= 104and a mutation rate
m= 1025. The strength of stabilizing selection (v2¼81 s2m) is such that 90% of mutations are strongly deleterious (jNsj.1) and so have negligible chance of fixation. The threshold isD* = 5sm, which means that following dupli-cation, the thresholdp* could in principle be reached with thefixation of justfive mutations of typical size. (As we will see, however, this does not happen because most mutations are eliminated by dosage-balance selection.) Under these assumptions, wefind from Equation 6 that after 1.7 billion generations, there is still a 50% probability that neither gene will have been lost. Thus, dosage-balance selection can maintain functional paralogs for very long evolutionary periods. If we decrease the strength of dosage-balance se-lection such that half the mutations are nearly neutral (v2¼2:33103
s2m), the amount of time decreases dramat-ically to just 11 million generations.
Figure 3 The speed of divergence in the expression of duplicate genes. Examples of the evolution of expression differenceD(=p12p2) when the diffusion parameters2Dis small (top) and large (bottom):Each panel
Data availability
Simulation code is available upon request.
Results
Fitting the model to data
To assess the plausibility of this model and to estimate pa-rameters of biological interest, wefit this model to data on the expression of sodium channel duplicates from Thompson
et al. (2014). The data are the relative expression levels of the two teleost-specific paralogs in 10 families offish sampled broadly across the entire teleost clade and the phylogenetic relations between those families (Figure 1). The parameters beingfit are the diffusion rates2
Dand the threshold for gene lossD*.
We used approximate Bayesian computation (ABC) be-cause it allows inferences about models that are too compli-cated for statistical frameworks such as likelihood (Tavare
et al. 1997; Beaumont et al. 2002; Beaumont 2010). The basic approach is to compare summary statistics measured from simulated data to the same statistics measured from real data. Estimates for the parameters are given by the values that produce simulated data sets that are most similar to the real data. In practice, this is accomplished by choosing values for the model parameters from prior distributions, simulating data using the model with those values, and comparing the summary statistics that result with those from the real data. The parameter values used in the simulation are rejected from the posterior distribution if the summary statistics from the real and simulated data sets are not sufficiently similar.
We simulated the evolution of expression on the phylogeny under the model described earlier. The output of the simula-tion gave the identities of the lineages (if any) that lost one of the paralogs to muscle function and the relative expression of
the two paralogs for those lineages that have not. These results were compared to the actual data using two types of summary statistics. Thefirst, which is binary, is determined by whether neofunctionalization occurred in the same locations on the tree as observed in the data. We rejected all simulations in which this pattern was not observed. The second kind of summary statistic was the independent contrasts (Felsenstein 1985) at the nodes of the phylogeny for the relative expres-sion of the duplicates in the nonelectric fish. We rejected simulations if the Euclidean distance of the independent con-trasts between the real and simulated data exceeded a threshold. Further details are given inFile S3.
Including the electric fish data in the analysis upwardly biases our estimate of the probability of neofunctionalization. (The families offish in the data set are not randomly chosen: it intentionally includes the only two families in which neo-functionalization is known.) To address this issue, we per-formed ABC analysis both with the electricfish and without them. Excluding the electric fish biases the estimate in the opposite direction, and therefore, the two analyses give boundaries for our estimates of model parameters.
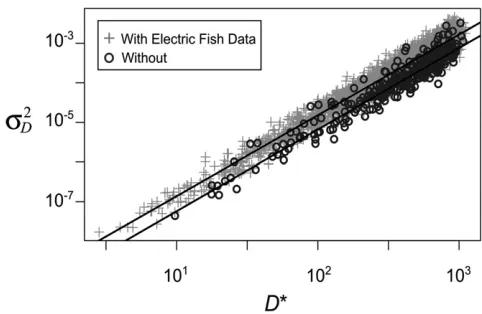
The joint posterior distributions for the diffusion rates2
D and the threshold for gene lossD* from the two analyses are shown in Figure 5. The distributions are quite similar. On a log-log plot, the values of logs2D and log D* are strongly correlated. The data are consistent with either small values of the speed parameter s2D and the threshold D* or with large values of both parameters.
We can use published information about absolute gene expression levels to refine the likely range of values for these parameters. Promoter and enhancer mutation studies sug-gest that gene expression levels may be on the order of 10sm to 100sm(Melnikov et al.2012; Patwardhan et al.2012; Metzgeret al.2015). The data from Thompsonet al.(2014), in conjunction with estimates of the distribution of transcript levels in eukaryotic cells (Mortazaviet al.2008; Islamet al.
2010; Schwanhäusser et al. 2011; Marguerat et al. 2012), suggest that a conservative lower limit forD* is 3sm(seeFile S3for details). LettingD* vary between 3smand 102sm, we used the linear regressions shown in Figure 5 to determine a range of plausible values fors2D. We estimate that if only three substitutions of typical size are needed to reduce a paralog’s expression to the threshold (D* = 3sm), then the expected value ofs2Dis 5.431029smper year. If expression is much larger, such that 100 substitutions of typical size are required to reach threshold, then the expected value ofs2
D is 1.53 1025smper year.
We explored what these results imply about the biological parameters on which the model is based. We began by esti-mating the strength of dosage-balance selection on the sodium channels. We assumed the range of values for s2
D just de-scribed, that m lies between 1026 and 1024 per allele per generation, thatNlies between 104and 106, and that there is one generation per year. Equation 4 and these parameter values then imply that the variance of thefitness functionv2 is between 11s2m and 4:63106s2m. We can use plausible
Figure 4 The probability of gene loss after duplication. The thick curve shows the probability of loss, either through pseudogenization or neo-functionalization, over time with standard parameter values: the selection strength isv2= 104, the SD of the mutation effect size iss
m= 1, the
population size is N = 104, the mutation rate is m = 1025, and the expression threshold isD*= 100. Other curves show results when indi-vidual parameter values are doubled.
expression levels derived from the studies cited earlier to estimate how efficient dosage-balance selection is at remov-ing expression mutations in terms of transcripts per cell. If the sodium channels are expressed at 50 transcripts per cell and
smis 5% of that expression level, for example, then the esti-mated values ofv2imply that mutations that change sodium channel expression by more than 5.3 transcripts per cell are efficiently eliminated by dosage-balance selection.
Next, we asked about the properties of mutations thatfix. We simulated the compensatory drift process using the pa-rameter values cited in the preceding paragraph (seeFile S1
for details). These results show that for small values ofD* (= 3sm) and strong dosage-balance selection (v2= 11s2m), 97% of mutations are removed by selection that otherwise would fix. On average, mutations thatfix change expression by only 0.02sm, and some 9000 substitutions occur before one of the duplicates becomes a pseudogene or neofunctionalizes. For a larger value ofD* (100sm) and very weak selection (v2= 4:63106
s2m), only 17% of mutations are prevented from fixing by dosage-balance selection. The effect of the average mutation that fixes is 0.7sm, and 8000 substitutions occur before the threshold is reached. We emphasize that these estimates are very rough, but they are, to our knowledge, thefirst for these important evolutionary parameters.
Wefind that if dosage-balance selection is strong (vnot very much bigger thansm), then the parameter estimates for the sodium channels are consistent with the assumptions of one-dimensional diffusion approximation. With weak selec-tion, however, the approximation breaks down. This is so because total expression can deviate substantially from the optimum so that the dynamics are not well approximated by a one-dimensional diffusion. Our model therefore describes the evolutionary dynamics of these sodium channel dupli-cates ifD* andvare not very much larger thansmbut would
be more accurately modeled by a two-dimensional diffusion model if they are not. It may be difficult to develop analytic results for this model, but it could be studied numerically.
Stochastic simulations suggest that our results are surpris-ingly robust to the assumption that no more than one mutation segregates at any given time (i.e., 4Nm1). Simulations of a Wright-Fisher model show that mutations that fix do so largely as a neutral process. The distribution offitness effects for fixed mutations is shown inFile S1. For the parameter values simulated, the mean value ofjNsjis between 0.15 and 0.24, and it is very rare for mutations tofix withjNsj.1. We ran simulations in which the mutation rate varied over more than four orders of magnitude. WhenNm= 1, the most com-mon allele is typically at a frequency of only about 50% (File S2). Nevertheless, the substitution rate is very close to what our model predicts (File S3). This behavior is also consistent with a model in which mutations that segregate at apprecia-ble frequencies are entirely neutral. The results of the simu-lations begin to significantly depart from the expectations of our model only when Nm .1. In sum, our analytic results may apply when mutation rates are higher than the approx-imations assume.
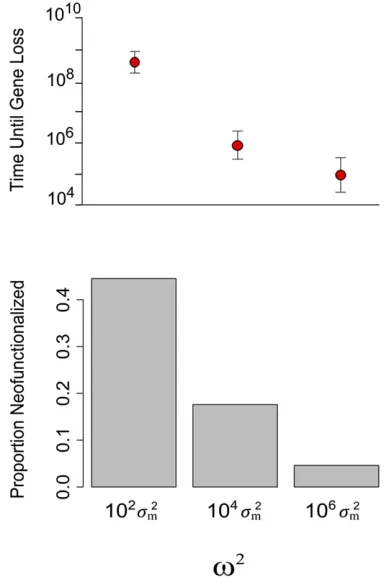
Neofunctionalization and compensatory drift
Because dosage-balance selection can maintain duplicates for long evolutionary periods, it may be more likely that neo-functionalization will occur than it does when dosage balance is weak or absent (Forceet al.1999; Pappet al.2003; Aury
et al.2006; Hughes et al.2007; Scannell and Wolfe 2008; Thompsonet al.2014; Gout and Lynch 2015). To explore this idea further, we extended our model by adding two new kinds of mutations. The first is a loss-of-function mutation that renders one of the duplicates a pseudogene. The proba-bility that itfixes is again given by thefitness function used in the main model. The second kind of mutation neofunction-alizes one of the duplicates. It suffers the samefitness cost as a loss-of-function mutation but also benefits from a 0.1% fitness gain from its new function.
We compared the frequency of neofunctionalization in three simulated populations (File S1) evolving under dosage-balance selection that ranged from strong to very weak:
v2= 102s2
m, 104s2m, and 106s2m. For all three simulations, mutations that alter expression were 10 times more frequent than pseudogenizing mutations, and pseudogenizing muta-tions were 103times more frequent than neofunctionalizing mutations. The population size wasN= 104, the mutation rate wasm= 1025mutations per allele per generation, and the optimal expression wasu= 5sm.
We found that neofunctionalization is greatly facilitated by balance selection. Figure 6 shows that when dosage-balance selection is stronger, duplicate genes are preserved for longer, and more mutations occur before a duplicate is lost. In consequence, neofunctionalization happens nearly 10 times more often than when dosage-balance selection is very weak. Neofunctionalization is most likely when expression falls inside a window of values in which the cost of losing
Figure 5 Joint posterior distribution of the diffusion rate parameters2
D
and the expression thresholdD*estimated from sodium channel expres-sion in teleostfish. The joint distributions are from two ABC analyses using the expression data from Thompsonet al.(2014). In one analysis, the two lineages of electricfish are included, and in the other, they are not. The linear relationship between the parameters from the two anal-yses is very similar. The regression lines are logs2
D= 2.04 logD*220.5
with the electricfish and logs2
the original function is smaller than the benefit of gaining the new function. In this window, a mutation that causes pseu-dogenization is still too deleterious tofix. Equation 4 shows that stronger dosage-balance selection slows the rate of com-pensatory drift and thus increases the amount of time the population spends in this evolutionary window. These results suggest that dosage-balance selection greatly diminishes the evolutionary potential of paralogs early after duplication but, after a long period of compensatory drift, greatly facilitates the acquisition of a new adaptive function.
Discussion
We formalized a model of the evolutionary process that we call
compensatory drift. This model shows how dosage-balance selection on duplicate genes (paralogs) can lead to neofunc-tionalization some tens to hundreds of millions of years after duplication. Dosage-balance selection constrains the com-bined expression of both paralogs to an optimum, but not the expression of the individual genes. This allows the relative expression of the paralogs to drift apart by the fixation of mutations with small effects. The speed at which this diver-gence occurs is determined by the diffusion rates2D, which, in turn, is a function of several biological parameters. Our results
show that stronger dosage-balance selection and larger muta-tional effects on expression slow divergence because a greater fraction of mutations is strongly deleterious and so has virtu-ally no chance offixation. Larger populations also decrease divergence because they enhance the efficiency of selection and so eliminate a larger fraction of mutations.
Simulations of compensatory drift reveal that dosage-balance selection can improve the odds that neofunctionaliza-tion occurs rather than pseudogenizaneofunctionaliza-tion. If a novel funcneofunctionaliza-tion yields a slight advantage while having a large tradeoff with the ancestral function, dosage-balance selection can still improve the chances of neofunctionalization, but only after a long period of compensatory drift. As expression of one paralog declines, the strength of selection to maintain its original function diminishes. It reaches a level at which mutations that pseu-dogenize the gene are still strongly deleterious, but mutations that neofunctionalize are beneficial. Our results show that the probability of neofunctionalization is increased when the added expression of duplicates is high, dosage-balance con-straints are strong, and population sizes are large.
We fit the model to data on sodium channel duplicates in teleost fish. We estimate that the diffusion rate s2
D lies between 5:431029
s2m and 1:53102
5
s2m per year, where s2m is the variance of mutation effect sizes. The square root of s2D is roughly equal to the amount of divergence that accumulates in a lineage per year. This implies that duplicates diverge between 731025
dand 431023
d per year, where
dis the average effect that a mutation has on the amount of gene product produced by a duplicate. About 8000–9000 substitutions occur before the threshold is reached. This number seems large, but it is not inconceivable. Summing up all the genetic elements that can affect expression (e.g., promoters, enhancers, microRNAs, post-translational regula-tors, etc.), there are many mutational targets for expression changes. Indeed, high rates of enhancer gain and loss (en-hancer turnover) have been seen in several taxa (Schmidt
et al. 2010; Domene et al. 2013; Pariset al. 2013; Arnold
et al.2014). Dosage-balanced duplicates may undergo more rapid enhancer turnover than singleton genes because com-pensation is possible at two different loci. A last consideration is that the time span involved is long, on the order of 108 generations. In any event, our inferences about numbers of substitutions are very imprecise, and the actual number may be much smaller. In the future, we expect that larger data sets of comparative paralog expression will emerge and will allow greater precision in parameter estimates using methods of analysis such as ABC.
This work builds on earlier hypotheses about the evolution of dosage-sensitive duplicates. Aury et al.(2006) proposed that expression of duplicates evolves by compensatory changes, which can greatly delay the pseudogenization or neofunctionalization of one of the pair. Later work suggested that this process leads to a “random walk”along a line of equal combined expression, a process that could explain com-parative gene expression patterns observed in disparate line-ages of organisms (Thompsonet al.2014; Gout and Lynch
Figure 6 Dosage-balance selection and the probability of neofunctional-ization. The top panel shows the number of mutations (a proxy for time) that occur before one of the duplicates neofunctionalizes or pseudoge-nizes. Dots show the mean, and the whiskers show 1 SD. The bottom panel compares the frequency of neofunctionalization for three strengths of dosage-balance selection, from strong to very weak. Results are based on 103simulations.
2015; Lan and Pritchard 2015). Other researchers suggested that gene loss in a duplicated network would cause imbal-ances and thus put positive selective pressure for loss of other duplicates in the same network, leading to concerted dupli-cate inactivation (Pappet al.2003; Hugheset al.2007; Konrad
et al.2011). Under compensatory drift, the eventual loss of a duplicate may not have much impact on other genes in its network because its paralog will already be producing (al-most) all the gene product needed.
Several lines of evidence are consistent with dosage-balance selection after WGD. In contrast to classical models in which redundant duplicates evolve neutrally (Ohno 1970; Walsh 1995; Force et al. 1999; Lynch and Conery 2000), dosage-balance selection will cause both genes to be essential immediately after duplication. WGD does not disrupt dosage balance, and therefore, many preserved duplicates originat-ing in a WGD may evolve under dosage-balance selection.
Paramecium tetraurelia has undergone three WGDs in its evolutionary history. In a large proportion of the duplicates from the most recent WGD, both members of the pair are evolving under strong purifying selection, and this propor-tion declines over time (Auryet al.2006). This pattern indi-cates that many genes are dosage sensitive and evolve under dosage-balance selection but that eventually selection to con-serve function is lost for one of the duplicates. Other exam-ples come from vertebrates. Some 100 million years after a WGD in the ancestor of salmonidfish, about half the dupli-cates are retained, and one-quarter of those are still similar in expression and sequence (Berthelotet al.2014). In a WGD that happened in the ancestor of teleost fish about 300 million years ago, many duplicate pairs persisted for over 200 million years before a member of the pair was lost (Blomme
et al.2006; Brunetet al.2006; Satoet al.2009). Delayed loss of duplicates long after a WGD is also seen in Paramecium
species (McGrathet al.2014b). Together these patterns in-dicate that many duplicates after WGDs are dosage sensitive and evolve in two phases: an initial prolonged phase where both duplicates evolve under selection that conserves func-tion and a later phase in which a duplicate is lost. This later phase could be due to a paralog drifting to low expression and may be the stage at which a redundant gene is most likely to evolve a new function.
Additional predictionsflow from the compensatory drift model. Duplicate pairs should persist longer if their total expression is high because more mutations mustfix to reach the expression threshold p* (i.e., D* is larger). (Figure 4 shows the impact of increasingD* on the time until duplicate loss.) Both yeast and paramecia show just this pattern: there is a positive correlation between expression levels and the longevity of duplicated genes following WGD (Seoighe and Wolfe 1999; Auryet al.2006; Goutet al.2010; McGrathet al.
2014b). To explain this pattern, Goutet al.(2010) argued that stabilizing selection on total expression is stronger on dosage-sensitive duplicates that have high levels of expres-sion. This idea is consistent with our model: the speed at which expression of paralogs diverges becomes slower as
the strength of selection increases. The model also makes predictions about patterns of subfunctionalization of dosage-balanced duplicates. When duplicates are expressed in differ-ent cell types under differdiffer-ent regulation, compensatory drift can occur in parallel in the two cell types, occasionally lead-ing to subfunctionalized expression. Finally, our model makes predictions about phylogenetic patterns. We expect the member of a duplicate pair that has neofunctionalized in a lineage to have lower expression than its paralog in closely related lineages where neofunctionalization has not occurred (Anderson and Evans 2009; Thompsonet al. 2014). Recent data support this prediction (Gout and Lynch 2015).
Compensatory drift may play an important role in two other evolutionary contexts. Dosage-balance selection can act on gene duplicates that do not arise by WGD. Selection for increased expression canfix a duplicated gene in a pop-ulation (Kondrashov 2012). Subsequently, there is stabilizing selection favoring the new, higher-expression optimum. Once this level is reached, the expression can diverge by compen-satory drift, as described by our model. Second, compensa-tory drift can act on the transcription and translation rates for a gene evolving under stabilizing selection for expression. An important difference with duplicate genes is that transcrip-tion and translatranscrip-tion rates cannot completely compensate for each other. Qualitatively, however, we expect to see similar evolutionary dynamics.
In our model, neofunctionalization happens after a long period of compensatory drift. Alternatively, a novel gene function could predate the duplication event as a minor pleio-tropic effect that is not optimized because of tradeoffs. Under the escape-from-adaptive-conflict model, duplicates are freed from these tradeoffs, allowing one of them to become rapidly optimized for the alternative function (Conant and Wolfe 2008; Des Marais and Rausher 2008). However, if one of the gene’s functions requires both duplicates to contribute expression, then compensatory drift would have to occur be-fore one duplicate can escape from the adaptive conflict.
Compensatory drift is related to but distinct from quanti-tative subfunctionalization (QS). This process describes how, following duplication, degenerative mutations accumulate by drift in each paralog until their total expression declines to a minimum total level necessary for viability (Force et al.
Dosage-balance selection may provide opportunities for adaptation long after WGD occurs. When one of a duplicate pair of genes drifts to a low level of expression, a period of incubation occurs during which it can evolve a new function. As illustrated by duplicates of sodium channel genes in teleost fish, downregulation of dosage-sensitive duplicates may be a common preadaptation in many diversifying gene families. Compensatory drift thus still may be facilitating adaptation very long after the two WGDs that occurred near the root of the vertebrate tree.
Acknowledgments
We thank Laura Crothers for comments on the manuscript. We also acknowledge the Texas Advanced Computing Center (TACC) at the University of Texas at Austin for providing HPC resources that have contributed to the research results reported in this paper. This research was funded by National Science Foundation grants DEB-1311521 to A.T. and DEB-0819901 to M.K.
Literature Cited
Arnold, C. D., D. Gerlach, D. Spies, J. A. Matts, Y. A. Sytnikova et al., 2014 Quantitative genome-wide enhancer activity maps forfive Drosophila species show functional enhancer conserva-tion and turnover during cis-regulatory evoluconserva-tion. Nat. Genet. 46: 685–692.
Anderson, D. W., and B. J. Evans, 2009 Regulatory evolution of a duplicated heterodimer across species and tissues of al-lopolyploid clawed frogs (Xenopus). J. Mol. Evol. 68: 236–247. Arnegard, M. E., D. J. Zwickl, Y. Lu, and H. H. Zakon, 2010 Old gene duplication facilitates origin and diversification of an in-novative communication system—twice. Proc. Natl. Acad. Sci. USA 107: 22172–22177.
Aury, J., O. Jaillon, L. Duret, B. Noel, C. Jubinet al., 2006 Global trends of whole-genome duplications revealed by the ciliate Paramecium tetraurelia. Nature 444: 171–178.
Beaumont, M. A., 2010 Approximate Bayesian computation in evolution and ecology. Annu. Rev. Ecol. Evol. Syst. 41: 379–406. Beaumont, M. A., W. Zhang, and D. J. Balding, 2002 Approximate Bayesian computation in population genetics. Genetics 162: 2025–2035.
Berthelot, C., F. Brunet, D. Chalopin, A. Juanchich, M. Bernard et al., 2014 The rainbow trout genome provides novel insights into evolution after whole-genome duplication in vertebrates. Nat. Commun. 5: 1–10.
Betancur-R, R., R. E. Broughton, E. O. Wiley, K. Carpenter, J. A. Lópezet al., 2013 The tree of life and a new classification of bony fishes. PLoS Curr. 5: pii: ecurrents.tol.53ba26640df0c-caee75bb165c8c26288.
Birchler, J. A., and R. A. Veitia, 2012 Gene balance hypothesis: connecting issues of dosage sensitivity across biological dis-ciplines. Proc. Natl. Acad. Sci. USA 109: 14746–14753. Birchler, J. A., U. Bhadra, M. P. Bhadra, and D. L. Auger,
2001 Dosage-dependent gene regulation in multicellular eukaryotes: implications for dosage compensation, aneu-ploidy syndromes and quantitative traits. Dev. Biol. 234: 275–288.
Birchler, J. A., N. C. Riddle, D. L. Auger, and R. A. Veitia, 2005 Dosage balance in gene regulation: biological implica-tions. Trends Genet. 21: 219–226.
Blomme, T., K. Vandepoele, S. De Bodt, C. Simillion, S. Maereet al., 2006 The gain and loss of genes during 600 million years of vertebrate evolution. Genome Biol. 7: R43.
Brunet, F. G., H. R. Crollius, M. Paris, J. Aury, P. Gilbert et al., 2006 Gene loss and evolutionary rates following whole-ge-nome duplication in teleost fishes. Mol. Biol. Evol. 23: 1808– 1816.
Conant, G. C., and K. H. Wolfe, 2008 Turning a hobby into a job: how duplicated genesfind new functions. Nat. Rev. Genet. 9: 938–950.
Cox, D. R., and H. D. Miller, 1965 Markov processes in continuous time with continuous state space, pp. 203–251 inThe Theoryof Stochastic Processes. Wiley, New York.
Des Marais, D. L., and M. D. Rausher, 2008 Escape from adaptive conflict after duplication in an anthocyanin pathway gene. Na-ture 454: 762–765.
Domene, S., V. F. Bumaschy, F. S. J. de Souza, L. F. Franchini, S. Nasifet al., 2013 Enhancer turnover and conserved regulatory function in vertebrate evolution. Phil. Trans. R. Soc. Lond. B Biol. Sci. 368: 20130027.
Edger, P. P., and J. C. Pires, 2009 Gene and genome duplications: the impact of dosage-sensitivity on the fate of nuclear genes. Chromosome Res. 17: 699–717.
Felsenstein, J., 1985 Phylogenies and the comparative method. Am. Nat. 125: 1–15.
Force, A., M. Lynch, F. B. Pickett, A. Amores, Y. Yan et al., 1999 Preservation of duplicate genes by complementary, de-generative mutations. Genetics 151: 1531–1545.
Freeling, M., and B. C. Thomas, 2006 Gene-balanced duplica-tions, like tetraploidy, provide predictable drive to increase mor-phological complexity. Genome Res. 16: 805–814.
Gout, J.-F., and M. Lynch, 2015 Maintenance and loss of dupli-cated genes by dosage subfunctionalization. Mol. Biol. Evol. 32: 2141–2148.
Gout, J., D. Kahn, and L. Duret Paramecium Post-Genomics Con-sortium, 2010 The relationship among gene expression, the evolution of gene dosage, and the rate of protein evolution. PLoS Genet. 6: e1000944.
Hahn, M. W., 2009 Distinguishing among evolutionary models for the maintenance of gene duplicates. J. Hered. 100: 605–617. Haldane, J. B. S., 1933 The part played by recurrent mutation in
evolution. Am. Nat. 67: 5–19.
He, X., and J. Zhang, 2005 Rapid subfunctionalization accompa-nied by prolonged and substantial neofunctionalization in du-plicate gene evolution. Genetics 169: 1157–1164.
Hughes, T., D. Ekman, H. Ardawatia, A. Elofsson, and D. A. Liberles, 2007 Evaluating dosage compensation as a cause of dupli-cate gene retention in Paramecium tetraurelia. Genome Biol. 8: 213.
Islam, S., U. Kjällquist, A. Moliner, P. Zajac, J.-B. Fan et al., 2011 Characterization of the single-cell transcriptional land-scape by highly multiplex RNA-seq. Genome Res. 21: 1160–1167. Kimura, M., 1962 On the probability offixation of mutant genes
in a population. Genetics 47: 713–719.
Kondrashov, F. A., 2012 Gene duplication as a mechanism of ge-nomic adaptation to a changing environment. Proc. Biol. Sci. 279: 5048–5057.
Konrad, A., A. I. Teufel, J. A. Grahnen, and D. A. Liberles, 2011 Toward a general model for the evolutionary dynamics of duplicate genes. Genome Biol. Evol. 3: 1197–1209. Lan, X., and J. K. Pritchard, 2015 Long-term survival of duplicate
genes despite absence of subfunctionalized expression. bioRxiv DOI: 10.1101/019166
Lavoué, S., M. Miya, M. E. Arnegard, J. P. Sullivan, C. D. Hopkins et al., 2012 Comparable ages for the independent origins of electrogenesis in African and South American weakly electric fishes. PLoS One 7: e36287.
Lynch, M., and J. S. Conery, 2000 The evolutionary fate and con-sequences of duplicate genes. Science 290: 1151–1155. Lynch, M., and A. Force, 2000 The probability of duplicate gene
preservation by subfunctionalization. Genetics 154: 459–473. Makino, T., and A. McLysaght, 2010 Ohnologs in the human
ge-nome are dosage balanced and frequently associated with dis-ease. Proc. Natl. Acad. Sci. USA 107: 9270–9274.
Marguerat, S., A. Schmidt, S. Codlin, W. Chen, R. Aebersold et al., 2012 Quantitative Analysis of Fission Yeast Transcriptomes and Proteomes in Proliferating and Quiescent Cells. Cell 151: 671–683. McGrath, C. L., J. F. Gout, T. G. Doak, A. Yanagi, and M. Lynch, 2014a Insights into three whole-genome duplications gleaned from the Paramecium caudatum genome sequence. Genetics 197: 1417–1428.
McGrath, C. L., J.-F. Gout, P. Johri, T. G. Doak, and M. Lynch, 2014b Differential retention and divergent resolution of dupli-cate genes following whole-genome duplication. Genome Res. 24: 1665–1675.
Melnikov, A., A. Murugan, X. Zhang, T. Tesileanu, L. Wanget al., 2012 Systematic dissection and optimization of inducible en-hancers in human cells using a massively parallel reporter assay. Nat. Biotechnol. 30: 271–277.
Metzger, B. P. H., D. C. Yuan, J. D. Gruber, F. Duveau, and P. J. Wittkopp, 2015 Selection on noise constrains variation in a eukaryotic promoter. Nature 521: 344–347.
Mortazavi, A., B. A. Williams, K. McCue, L. Schaeffer, and B. Wold, 2008 Mapping and quantifying mammalian transcriptomes by RNA-seq. Nat. Methods 5: 621–628.
Muller, H. J., 1936 Bar duplication. Science 83: 528–530. Novak, A., M. Jost, Y. Lu, A. Taylor, H. H. Zakonet al., 2006 Gene
duplications and evolution of vertebrate voltage-gated sodium channels. J. Mol. Evol. 63: 208–221.
Ohno, S., 1970 Evolution by Gene Duplication. Springer-Verlag, New York.
Ohta, T., 1987 Simulating evolution by gene duplication. Genet-ics 115: 207–213.
Papp, B., C. Pal, and L. D. Hurst, 2003 Dosage sensitivity and the evolution of gene families in yeast. Nature 424: 194–197. Paris, M., T. Kaplan, X. Y. Li, J. E. Villalta, S. E. Lott et al.,
2013 Extensive divergence of transcription factor binding in Drosophila embryos with highly conserved gene expression. PLoS Genet. 9: e1003748.
Patwardhan, R. P., J. B. Hiatt, D. M. Witten, M. J. Kim, R. P. Smith et al., 2012 Massively parallel functional dissection of mam-malian enhancers in vivo. Nat. Biotechnol. 30: 265–270. Qian, W., and J. Zhang, 2008 Gene dosage and gene duplicability.
Genetics 179: 2319–2324.
Qian, W., B. Liao, A. Y. Chang, and J. Zhang, 2010 Maintenance of duplicate genes and their functional redundancy by reduced expression. Cell 26: 425–430.
Rastogi, S., and D. A. Liberles, 2005 Subfunctionalization of du-plicated genes as a transition state to neofunctionalization. BMC Evol. Biol. 5: 28.
Sato, Y., Y. Hashiguchi, and M. Nishida, 2009 Temporal pattern of loss/persistence of duplicate genes involved in signal trans-duction and metabolic pathways after teleost-specific genome duplication. BMC Evol. Biol. 9: 127.
Scannell, D. R., and K. H. Wolfe, 2008 A burst of protein sequence evolution and a prolonged period of asymmetric evolution fol-low gene duplication in yeast. Genome Res. 18: 137–147. Schmidt, D., M. D. Wilson, B. Ballester, P. C. Schwalie, G. D.
Brownet al., 2010 Five-vertebrate ChIP-seq reveals the evo-lutionary dynamics of transcription factor binding. Science 328: 1036–1040.
Schwanhäusser, B., D. Busse, N. Li, G. Dittmar, J. Schuchhardtet al., 2011 Global quantification of mammalian gene expression control. Nature 473: 337–342.
Seoighe, C., and K. H. Wolfe, 1999 Yeast genome evolution in the post-genome era. Curr. Opin. Microbiol. 2: 548–554.
Stoltzfus, A., 1999 On the possibility of constructive neutral evo-lution. J. Mol. Evol. 49: 169–181.
Stranger, B. E., M. S. Forrest, M. Dunning, C. E. Ingle, C. Beazley et al., 2007 Relative impact of nucleotide and copy number variation on gene expression phenotypes. Science 315: 848–853.
Tavare, S., D. J. Balding, R. C. Griffiths, and P. Donnelly, 1997 Inferring coalescence times from DNA sequence data. Genetics 145: 505–518.
Thompson, A., D. Vo, C. Comfort, and H. H. Zakon, 2014 Expression evolution facilitated the convergent neo-functionalization of a sodium channel gene. Mol. Biol. Evol. 31: 1941–1955.
Veitia, R. A., 2002 Exploring the etiology of haploinsufficiency. BioEssays 24: 175–184.
Walsh, B., 2003 Population-genetic models of the fates of dupli-cate genes. Genetica 118: 279–294.
Walsh, J. B., 1995 How often do duplicated genes evolve new functions? Genetics 139: 421–428.
Zakon, H. H., Y. Lu, D. J. Zwickl, and D. M. Hillis, 2006 Sodium channel genes and the evolution of diversity in communication signals of electricfishes: convergent molecular evolution. Proc. Natl. Acad. Sci. USA 103: 3675–3680.
GENETICS
Supporting Information
www.genetics.org/lookup/suppl/doi:10.1534/genetics.115.178137/-/DC1
Compensatory Drift and the Evolutionary Dynamics
of Dosage-Sensitive Duplicate Genes
Ammon Thompson, Harold H. Zakon, and Mark Kirkpatrick
File S1
Stochastic Simulation of Compensatory Drift
Stochastic simulations for the evolution of
p
1and
p
2We used explicit stochastic simulations of compensatory drift to check the diffusion
approximation and gain additional insight about the evolutionary process. In our simulations,
expression-altering mutations appeared in diploid individuals in a population of size
N
at a
mutation rate
𝜇
per allele per generation. The initial conditions were
𝑝
1= 𝑝
2and
𝑝
1+ 𝑝
2= 𝜃
,
where
𝜃
is the optimal expression level. Expression evolved according to a Poisson process.
The number of generations until the next mutation appeared in an individual in the population
was drawn from an exponential distribution with rate parameter
𝜆 = 4𝑁𝜇
. Mutations occurred in
either duplicate with equal probability and changed expression of that duplicate by a random
amount,
𝛿
, drawn from a standard normal distribution. The selection coefficient for a mutation
that changes
𝑝
2to
𝑝
2+ 𝛿
was calculated as
𝑠 =
𝑊(𝑝𝑊(𝑝1,𝑝2+𝛿)1,𝑝2)
− 1
, where
W
() is the fitness
function given by equation 1 in File S2. The probability that the mutation fixed was calculated
with Equation 1 from the main text. If the mutation fixed, then expression in the population for
that duplicate was updated and the process began again. Absorption occurred when the
expression of one of the duplicates fell below the threshold at
𝑝
∗or rose above the threshold
at
𝜃 – 𝑝
∗. Mutation effect size is independent of distance from the threshold. The amount of the
mutation density that extends beyond the threshold is the probability of a mutation that
guarantees a neofunctionalizing or pseudogenizing event. This also means that the total density
that extends into negative expression is treated as the probability of a mutation that completely
turns off expression. In the event the threshold is reached, regardless of which duplicate crossed
a threshold, the duplicate with lower expression neofunctionalized or pseudogenized.
To check the diffusion approximation, we simulated compensatory drift within a single
lineage for different numbers of generations and different values of the parameters
(𝜇, 𝑁, 𝜔
2)
.
We generated empirical distributions for the difference in expression,
𝐷 = 𝑝
1− 𝑝
2, and
compared them to the diffusion approximations given by Equations 5 and 6 in the main text.
We also used the simulations to confirm the assumption made by the diffusion
approximation that the sum of expression,
𝐴 = 𝑝
1+ 𝑝
2, tends to stay close to the optimum
value,
𝜃
. We used the range of parameter values estimated from our ABC analysis to simulate
expression evolution under the model and measure the standard deviation of
A
, which we denote
as
𝜎
𝐴. We found that
𝜎
𝐴is small compared to
𝜎
𝑚and
𝜃
when selection is at least strong enough
to remove approximately half of expression altering mutations.
To gain additional insight about compensatory drift, we used the simulations to find the
number of mutations, number of mutations that fix, and the sizes of mutations that fix. The
results are reported in the main text. We measured the proportion of all mutations that fix under
these parameter values, which we call
𝛼
, and used this value to measure the proportion of
mutations that were prevented from fixing by dosage-balance selection. We calculated that
proportion as
1 − 2𝑁𝛼
.
Dosage balance selection and the probability of neofunctionalization
To study the frequency of neofunctionalization under compensatory drift, we simulated the
dynamics as above. These simulations included two more types of mutations, pseudogenizing
and neofunctionalizing. We set the pseudogenization mutation rate to be 10
3times higher than
the neofunctionalization rate. Ten percent of mutations were pseudogenizing, and 0.01% of
mutations caused neofunctionalization. Neofunctionalization increased fitness by 0.1% but also
caused a loss of fitness since expression no longer contributed to the ancestral function. The
fitness of a pseudogenizing mutation, for example if
p
1became a pseudogene leaving
p
2alone to
contribute expression, was calculated as
𝑊 = exp [
−(𝑝2−𝜃)2
2𝜔2
]
and if
p
1had neofunctionalized
then
𝑊 = 1.001 × exp [
−(𝑝2−𝜃)2
2𝜔2
]
. The only parameter that was varied in the simulations was the
selection strength
ω
2, which took the values of 10
2𝜎
𝑚2, 10
4𝜎
𝑚2, and 10
6𝜎
𝑚2. One thousand
simulations were run for each condition. Simulations ended when either pseudogenization or
neofunctionalization of one of the duplicates had occurred.
Substitution in populations with high
N
𝝁
If the mutation rate is high and/or the population size is large, the population is likely to be
analytic model. If most mutations that reach an appreciable frequency in the population are
effectively neutral, then we expect this fact to have a negligible impact on the rate of
substitutions. To assess this issue we performed stochastic simulations as described above and
recorded the values of
Ns
for mutations that fix. We simulated populations with three strengths
of selection, corresponding to situations in which 99%, 90%, or 50% of mutations have |
Ns
| > 1.
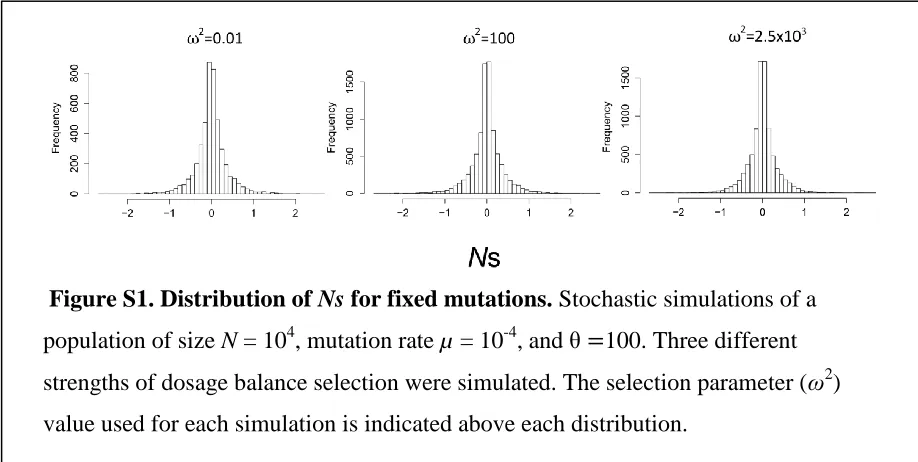
Figure S1 shows the distribution of
Ns
of mutations that fixed. The mean |
Ns
| of mutations that
fix was 0.24 (median = 0.15) for all three cases. Less than 1.3% of substitutions had |
Ns
| > 1. In
summary, simulations show that more than 98% of mutations that fix are nearly neutral even
when 99% of random mutations have a large impact on fitness (|
Ns
| > 1).
These results indicate that the vast majority of mutations that fix are nearly neutral, suggesting
that the model may provide a good approximation even when population size and/or mutation are
large.
To investigate this issue further, we performed individual-based simulations. If
substitution is a Poisson process, then the mean number of substitutions will have a linear
relationship with the mutation rate. If high mutation rates impact the dynamics of substitution,
then the mean number of substitution should depart from that linear relationship as
Nµ
becomes
high relative to the time it takes for a mutation to fix.
Figure S1. Distribution of
Ns
for fixed mutations.
Stochastic simulations of a
population of size
N
= 10
4, mutation rate
µ
= 10
-4, and θ
=
100. Three different
strengths of dosage balance selection were simulated. The selection parameter (
ω
2)
We simulated populations of
N
= 100 asexual haploid individuals evolving by
non-overlapping generations for 10
6generations. Each individual had a probability
µ
of mutating. If
mutation happened in an individual then a random variate
δ
was drawn from a standard Normal
distribution and was added to the expression level of the individual. Zygotes were created for
generation
t
+ 1 by sampling individuals in generation
t
with probabilities proportional to their
fitnesses. Selection strength was such that 62% of mutations had |
Ns
| > 1. The starting condition
was all individuals in the population had optimal expression.
Simulations were run for values of
N
µ over the range [10
-4, 10]. We determined the allele
frequency spectra by sampling the simulations every 10
3generations, and calculated the
substitution rates. The results for the allele frequency spectra are shown in Figure S2. With
N
µ =
0.1, the most common allele was typically at a frequency around 85%, and no more than four
alleles segregated. With
Nµ
= 1, the major allele frequency is typically 50%, and up to 12 alleles
segregate.
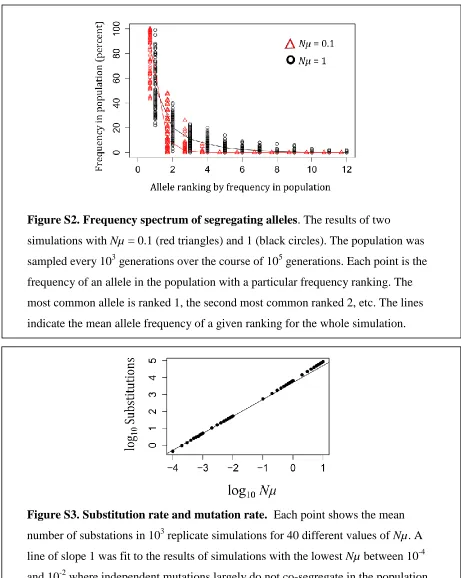
The relationship between
N
µ and the substitution rate is shown in Figure S3. The
relation at higher mutation rates is very close to what is expected from extrapolating from the
lowest mutation rates (the regime where our Poisson process approximation holds). At the very
highest mutation rates (
N
µ > 1), we begin to see departures from linearity, but the departures are
still not large even with
N
µ = 10. We conclude that our model provides good approximations for
mutation rates that are somewhat higher than are justified by our assumption that only one
Figure S3. Substitution rate and mutation rate.
Each point shows the mean
number of substations in 10
3replicate simulations for 40 different values of
Nµ
. A
line of slope 1 was fit to the results of simulations with the lowest
Nµ
between 10
-4and 10
-2where independent mutations largely do not co-segregate in the population.
Departure from this line at higher
Nµ
indicates that interference between mutations
co-segregating in the population is impacting the substitution rate. The deviation is,
however, not large over this range of parameters.
Figure S2. Frequency spectrum of segregating alleles
. The results of two
simulations with
Nµ
= 0.1 (red triangles) and 1 (black circles). The population was
sampled every 10
3generations over the course of 10
5generations. Each point is the
frequency of an allele in the population with a particular frequency ranking. The
most common allele is ranked 1, the second most common ranked 2, etc. The lines
File S2
Compensatory drift and the evolutionary dynamics of dosage-sensitive duplicate genes
The model
Stabilizing selection acts on the total expression of two paralogous genes. The expression levels
of the genes are denoted
p
1and
p
2. The fitness function is:
𝑊 = exp [
−(𝑝1+𝑝2−𝜃)22𝜔2
]
(1)
where
𝜃
is the optimum for the sum
𝑝
1+ 𝑝
2, and
𝜔
2is the width (variance) of the fitness
function, and so larger values imply weaker selection. (Equation (1) can be viewed as an
approximation for a wide range of stabilizing fitness functions, including asymmetric ones, if
𝜔
2is chosen to produce the same curvature along the diagonal. The approximation will be best
when parameters are such that total gene expression stays near the optimum:
𝑝
1+ 𝑝
2≈ 𝜃
). In
graphical form the fitness function looks like this:
We assume that there is a threshold of expression. Above this threshold, a paralog cannot
become a pseudogene or neofunctionalize because the fitness cost to its original function would
be too great. Below the threshold, however, neofunctionalization or pseudogenization is
guaranteed to happen, and it happens on a fast timescale relative to the speed at which the
p
s
change. We denote the threshold as
p
*.
When a mutation that changes expression occurs, one of the two loci is chosen at random
normal with mean 0 and variance
𝜎
𝑚2. The probability that a mutation with an effect
𝛿
on either
p
1or
p
2fixes is denoted
𝑃
𝑓𝑖𝑥(𝛿)
. There is a probability
𝜇
per generation that a mutation affecting
expression will occur at each of the two gene copies at each of the two paralogs. The waiting
time until the next mutation appears in the population is exponentially-distributed with mean
1/(4𝑁𝜇)
. The evolutionary dynamics therefore proceed as a random walk in
p
1and
p
2.
A diffusion approximation
It is useful to work in terms of the sum
A
and the difference
D
in expression at the two loci:
𝐴 = 𝑝
1+ 𝑝
2𝐷 = 𝑝
1− 𝑝
2(2)
There are two reasons for this change of variables. Stabilizing selection acts on
A
but is
indifferent to
D
, and that fact simplifies the derivation below. Second, our data are on
D
(see File
S3), and so this parameterization focuses our attention in the model on the quantity of empirical
interest.
In the absence of boundary conditions (that is, with no neofunctionalization), the density
function for
A
and
D
can be written as the product of independent density functions:
𝑓
𝐴,𝐷= 𝑓
𝐴(𝐴)𝑓
𝐷(𝐷)
(3)
That relation also holds approximately when neofunctionalization does happen if stabilizing
selection is strong relative to drift. Then the value of
A
will stay very close to its optimal value.
The evolutionary dynamics then lie (almost) along a single dimension in which
𝐴 = 𝜃
and the
difference in expression,
D
diverges with time. This is the key approximation to what follows.
We will therefore assume this situation holds, and proceed to develop a partial differential
equation (PDE) for the density function
f
D(). Simulations described in File S1 validate the
accuracy of this approximation over the parameter values of biological interest to us. The PDE
for
D
follows that of simple Brownian motion:
𝜕
𝑡𝑓
𝐷=
12𝜎
𝐷2𝜕
The diffusion coefficient
𝜎
𝐷2determines the evolutionary rate at which
D
will diverge in the
paralogs.
Calculating the diffusion coefficient
The diffusion coefficient is defined as the instantaneous rate of increase in the variance of
D
, the
difference of expression in the paralogs. We calculate that rate as
𝜎
𝐷2= ∫(𝛿 − 𝛿̅)
2[4𝑁𝜇𝑓
𝜇
(𝛿)]𝑃
𝑓𝑖𝑥(𝛿)𝑑𝛿
(5)
where
𝛿̅
is the mean effect of mutations that fix, which is approximately 0. The term in square
brackets represents the number of new mutations with effect
𝛿
entering the population each
generation.
𝑃
𝑓𝑖𝑥(𝛿)
is the probability that a mutation with effect
𝛿
fixes, for which we use
Kimura’s (1964) approximation:
𝑃
fix(𝛿) =
1−exp [−4𝑁𝑠(𝛿)]1−exp [−2𝑠(𝛿)](6)
Here
𝑠(𝛿)
is the relative fitness of a mutation with an effect
𝛿
on expression:
𝑠(𝛿) ≈
𝑊(𝛿)𝑊(0)− 1
(7)
≈ exp [
−𝛿2𝜔22] − 1 ≈
2𝜔−𝛿22(8)
Equation (7) makes use of the earlier assumption that selection is sufficiently strong relative to
drift that
A
is typically very close to
𝜃
.
Combining these expressions gives us
𝜎
𝐷2=
4𝑁𝜇√2𝜋𝜎𝑚
∫ 𝛿
2
exp [
−𝛿2 2𝜎𝑚2] (
exp[𝜔2𝛿2]−1
exp[2𝛿2𝑁
𝜔2 ]−1