Scholarship@Western
Scholarship@Western
Electronic Thesis and Dissertation Repository
12-1-2016 12:00 AM
Development of Design Loads for Transmission Line Structures
Development of Design Loads for Transmission Line Structures
Subjected to Downbursts Using Aero-elastic Testing and
Subjected to Downbursts Using Aero-elastic Testing and
Numerical Modeling
Numerical Modeling
Amal Elawady
The University of Western Ontario
Supervisor
Ashraf El Damatty
The University of Western Ontario
Graduate Program in Civil and Environmental Engineering
A thesis submitted in partial fulfillment of the requirements for the degree in Doctor of Philosophy
© Amal Elawady 2016
Follow this and additional works at: https://ir.lib.uwo.ca/etd
Part of the Civil Engineering Commons, and the Structural Engineering Commons
Recommended Citation Recommended Citation
Elawady, Amal, "Development of Design Loads for Transmission Line Structures Subjected to Downbursts Using Aero-elastic Testing and Numerical Modeling" (2016). Electronic Thesis and Dissertation
Repository. 4242.
https://ir.lib.uwo.ca/etd/4242
This Dissertation/Thesis is brought to you for free and open access by Scholarship@Western. It has been accepted for inclusion in Electronic Thesis and Dissertation Repository by an authorized administrator of
ii
ABSTRACT
The failure of transmission line structures due to severe High Intensity Wind (HIW) events
is one of the major problems facing the electrical utility companies in various places around
the globe including Canada. An extensive research program focusing on this problem
started about fifteen years ago at The University of Western Ontario (UWO). In this Thesis,
two major milestones are achieved leading to the advancement of the knowledge in this
field. The first milestone is conducting, for the first time, a test on an aero-elastic model of
a multi-span transmission system under reduced–scale simulated downbursts. The first
objective of the experimental program is to assess the dynamic response of the conductors
and the towers resulting from the transient nature of both the mean and the fluctuating
components of downbursts. The second objective is to use the experimental results to
validate a numerical model previously developed in-house at UWO for the analysis of
transmission line structures under downbursts.
The second milestone achieved in this Thesis is the development, for the first time, of a set
of load cases that simulates the critical effects of downbursts on transmission line structures
taking into account the variation in the location and size of the wind events. A load case
that is particular for downbursts results in a velocity profile on the line that is non uniform
and unequal along the conductor spans adjacent to the opposite sides of a tower. This leads
to unequal tensions in the two spans adjacent to the tower and the difference in tensions
leads to a force transmitted to the tower along the longitudinal direction of the line. This
force is believed to be the cause of the failure of many towers. A procedure that is simple
iii
through conducting an extensive parametric study for a number of transmission line
systems, a comprehensive and simple procedure for estimating critical downburst loads on
both the tower and the conductors is developed and presented in a simplified manner for
possible implementation in the codes of practice.
Keywords
High Intensity Wind, Downburst, Transmission Line, Transmission Tower, Dynamic
iv
This thesis has been prepared in accordance with the regulations for an Integrated Article
format thesis stipulated by the School of Graduate and Postdoctoral Studies at Western
University. Statements of the co-authorship of individual chapters are as follows
Chapter 2: Aero-elastic Testing of Multi-Spanned Transmission Line Subjected to
Downbursts
All the numerical and experimental work was conducted by A. Elawady under close
supervision of Dr. A. A. El Damatty, Dr. G. Bitsuamlak and Dr. H. Aboshosha and the
guidance of Dr. H. Hangan for the experimental work conducted in the WindEEE facility.
Drafts of Chapter 2 were written by A. Elawady and modifications were done under
supervision of Dr. A. A. El Damatty and Dr. G. Bitsuamlak. A paper co-authored by A.
Elawady, A. A. El Damatty, H. Aboshosha G. Bitsuamlak, H. Hangan, and A Elatar will
be submitted to the Journal of Wind Engineering & Industrial Aerodynamics.
Chapter 3: Aero-Elastic Response of Transmission Line System Subjected to
Downburst Wind: Validation of Numerical Model Using
Experimental Data
All the numerical and experimental work was conducted by A. Elawady under close
supervision of Dr. A. A. El Damatty and Dr. H. Aboshosha. Drafts of Chapter 3 were
written by A. Elawady and modifications were done under supervision of Dr. A. A. El
Damatty and Dr. H. Aboshosha. A paper co-authored by A. Elawady, A. A. El Damatty,
v
All the numerical work was conducted by A. Elawady under close supervision of Dr. A.
A. El Damatty. Drafts of Chapter 4 were written by A. Elawady and modifications were
done under supervision of Dr. A. A. El Damatty. A paper co-authored by A. Elawady and
A. A. El Damatty has been published in the Journal of Engineering Structures.
Chapter 5: Critical Load Cases for Lattice Transmission Line Structures Subjected
to Downbursts: Economic Implications for Design of Transmission
Lines
All the numerical work was conducted by A. Elawady under close supervision of Dr. A.
A. El Damatty. Drafts of Chapter 5 were written by A. Elawady and modifications were
done under supervision of Dr. A. A. El Damatty. A paper co-authored by A. A. El Damatty
vi
To my beloved mother
Thanaa Elshafie
To my sister
Amira
and my brothers
Ahmed and Islam
To my soulmate and my trusted friend
Mary
For patience, support, encouragement, and sharing these years of hard work
To my nephews
Ahmed, Seif, Ibrahim, Mohamed
and my niece
Mariam
For filling my life with joy and happiness
To the soul of my beloved father
Mohamed Kamel Elawady
and the soul
of my beloved brother
Ibrahim
To my supervisor,
Dr. Ashraf A. El Damatty
vii
These few words are a simple yet sincere attribute to express my gratitude to all those
who helped me through the past years, to reach the end of a journey that would have
never been possible without their help.
My utmost gratitude goes to my professor, Dr. Ashraf El Damatty, who taught me far
beyond academics. To him I owe the knowledge and skills I rely on to pursue my career
in academia. I am extremely grateful for all these hours he spent to motivate me and to
sincerely give me as much as he could of his valuable experience.
I would like to thank the to thank Hydro One company, Ontario Centre of Excellence
(OCE), O. H. Ammann Fellowship awarded by ASCE for their kind funding.
The support of my friends in Western is deeply appreciated. Many thanks must go to (M.
Hamada, A. Ansary, A. Musa, A. Ibrahim, A. Hamada, H. Aboshosha, A. El Shaer, I.
Ibrahim, A. Shehata, C. Santos, P. Sultana, N. El Gharably). I am extremely thankful for
the support I received from Dr. Girma Bistuamlak and Dr. Ayman El Ansary who
immensely helped on various aspects of my academic life at Western. I am indebted to the
opportunity that surrounded me with such a group of helpful colleagues. The years I spent
in my PhD couldn’t possibly be any better without you.
Lastly, I would like to thank my sincere friend Mary for her valuable time, support,
patience, and advices during all the stage of my PhD. Words fall short to describe my
gratitude, admiration and adore to my amazing family; my ever loving, caring and
supporting mom, my cheerful siblings. Thanks for your patience and support through this
important period of my life. To my lighthearted niece and nephews, I hope one day you
feel inspired and proud of what I have achieved. To my beloved family, you are everything
viii
ABSTRACT ... ii
CO-AUTHORSHIP ... iv
ACKNOWLEDGMENTS ... vii
TABLE OF CONTENTS ... viii
LIST OF TABLES ... xiv
LIST OF FIGURES ... xvi
LIST OF SYMBOLS ... xxi
CHAPTER 1 ... 1
INTRODUCTION ... 1
1.1 Background ... 1
1.2 Downburst Wind Field ... 6
1.2.1 Downburst Field Measurements ... 6
1.2.2 Experimental Studies for Downburst Wind Field ... 7
1.2.3 Numerical Studies for Downburst Field Characterization ... 7
1.3 Studies on TLs Response to Downbursts ... 10
1.4 Research Conducted at UWO On the Effect of Downbursts on TLs ... 11
1.5 Research Gaps ... 15
1.6 Scope of the Current Study ... 16
1.7 Organization of The Thesis ... 17
1.7.1. Aero-elastic Testing of Multi-Spanned Transmission Line Subjected to Downbursts... 17
1.7.2. Aero-Elastic Response of Transmission Line System Subjected to Downburst Wind: Validation of Numerical Model Using Experimental Data ... 17
ix
1.7.5. Summary and Conclusions ... 19
1.8 References ... 19
CHAPTER 2 ... 25
AERO-ELASTIC TESTING OF MULTI-SPANNED TRANSMISSION LINE SUBJECTED TO DOWNBURSTS ... 25
2.1. Introduction ... 25
2.2. Downburst Simulation at WindEEE ... 33
2.2.1. Mean and fluctuating wind decomposition ... 35
2.2.2. Turbulence intensity... 37
2.2.3. Velocity profile validation ... 39
2.3. Aero-elastic Modeling of Transmission Line System ... 41
2.3.1. Prototype description ... 41
2.3.2. Aero-elastic model scaling parameters ... 45
2.3.2.1. Tower model ... 47
2.3.2.2. Conductor model selection ... 49
2.3.2.3. Support boundary conditions ... 50
2.3.2.4. Instrumentation ... 51
2.3.2.5. Aero-elastic model free vibration test ... 54
2.3.3. WindEEE downburst test plan ... 56
2.3.3.1. Layout 1: Maximum longitudinal loads (Angle of attack ϴ = 90º) ... 58
2.3.3.2. Layout 2: Maximum transverse loads (Angle of attack ϴ = 0 º) ... 58
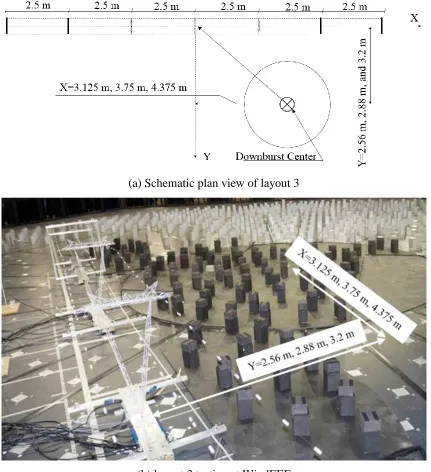
2.3.3.3. Layout 3: Maximum oblique loads (Angle of attack ϴ = 52 º) ... 59
2.4. Results and Discussions ... 61
2.4.1. Identification of Critical Configurations ... 61
2.4.2. Decomposition of the responses ... 62
2.4.3. Quantifying the dynamic effect for different downburst velocities and configurations ... 68
x
2.6. Acknowledgment ... 78
2.7. References ... 79
CHAPTER 3 ... 82
AERO-ELASTIC RESPONSE OF TRANSMISSION LINE SYSTEM SUBJECTED TO DOWNBURST WIND: VALIDATION OF NUMERICAL MODEL USING EXPERIMENTAL DATA ... 82
3.1. Introduction ... 82
3.2. Brief about the numerical tools ... 87
3.2.1. Tower simulation using finite element model (FEM) ... 88
3.2.2. Conductors semi-analytical technique ... 90
3.3. Wind Tunnel Testing at WindEEE ... 91
3.3.1. Downburst wind field ... 91
3.3.2. Aero-elastic transmission line model ... 96
3.3.2.1. Full-scale transmission line system ... 96
3.3.2.2. Aero-elastic modelling of the line system ... 99
3.3.2.3. Instrumentations and data acquisition system ... 99
3.3.3. Experimental Test plan... 100
3.3.3.1. Layout 1: Maximum longitudinal loads (Angle of attack of 90º) ... 102
3.3.3.2. Layout 2: Maximum transverse loads (Angle of attack of 0 º) ... 103
3.3.3.3. Layout 3: Maximum oblique loads (Yaw angles of attack): ... 104
3.4. Variation of peak and mean responses of the aero-elastic model with the downburst location ... 105
3.4.1. Layout 1: Maximum Longitudinal Loading (ϴ=90˚, Fig. 3-17) ... 106
3.4.2. Layout 2: Maximum Transverse Loading (ϴ=0˚, Fig. 3-18) ... 107
xi
3.5.1. Validation of the external forces evaluation: ... 114
3.5.2. Validation of the conductor solution ... 114
3.5.3. Validation of straining action distributions ... 115
3.6. Conclusions ... 117
3.7. Acknowledgment ... 119
3.8. References ... 119
CHAPTER 4 ... 124
LONGITUDINAL FORCE ON TRANSMISSION TOWERS DUE TO NON-SYMMETRIC DOWNBURST CONDUCTOR LOADS ... 124
4.1. Introduction ... 124
4.2. Downburst Wind Field ... 128
4.3. Variation of Longitudinal Force with the Conductor parameters ... 137
4.4. Longitudinal force charts ... 144
4.5. Transverse force ... 149
4.6. Validation ... 150
4.7. Example ... 151
4.8. Conclusion ... 153
4.9. Acknowledgement ... 155
4.10. Appendix A ... 156
4.11. References ... 172
xii
TRANSMISSION LINES... 175
5.1. Introduction ... 175
5.2. Methodology ... 180
5.2.1. Downburst Wind Field ... 180
5.2.2. Modelling Technique and Method of analysis... 183
5.2.3. Structural Characteristics of Analyzed Transmission Line Systems ... 186
5.3. Results and Discussion ... 189
5.3.1. Tower response ... 189
5.3.1.1. Guyed towers ... 190
5.3.1.2. Self-supported towers ... 192
5.3.1.3. Conductor forces... 193
5.3.2. Proposed Downburst Load Cases ... 195
5.3.2.1. Load case#1: R/DJ=1.3, ϴ=90º, DJ=500 m ... 198
5.3.2.2. Load case#2: R/DJ=1.3, ϴ=0º, L/DJ=0.5 ... 199
5.3.2.3. Load case#3: R/DJ=1.6, ϴ=30º, L/DJ=0.5 ... 201
5.3.3. Load Cases Validation ... 202
5.3.4. Economic Implications ... 205
5.4. Conclusion ... 211
5.5. Acknowledgements ... 214
5.6. References ... 214
CHAPTER 6 ... 217
SUMMARY AND CONCLUSIONS ... 217
6.1. Summary ... 217
6.2. Conclusions ... 218
xiv
Table 2-1. Scaling ratio for various physical parameters of the model ... 46
Table 2-2. Frequencies and mode shapes of the full-scale tower and the required frequencies of the aero-elastic model. ... 54
Table 2-3. Dynamic properties of the tested conductors. ... 55
Table 2-4. Test layouts. ... 57
Table 2-5. DAF analysis... 72
Table 3-1. Test layouts ... 101
Table 3-2. Selected test cases for validating the numerical models ... 113
Table 4-1. Conductors used to assess the effect of the conductor’s parameters on RX.. 141
Table 4-2. Group range for the evaluation of RX. ... 145
Table 4-3. Validation for the RX and RY values obtained from the proposed approach 151 Table 5-1. Properties of selected towers ... 187
Table 5-2. Downburst configurations causing maximum RX ... 194
Table 5-3. Results of the economic study ... 208
xvi
LIST OF FIGURES
Fig. 1-1 Guyed transmission tower components... 3
Fig. 1-2 Lattice self-supported transmission line ... 4
Fig. 1-3. Numerical modeling methods of downburst winds... 9
Fig. 2-1. Guyed tower failure in Ontario, (Hydro One Report, 2006). ... 27
Fig. 2-2. Downburst characteristic parameters. ... 27
Fig. 2-3. Schematic of testing chamber and downburst simulation at WindEEE. ... 34
Fig. 2-4. Cobra probe devices. ... 35
Fig. 2-5. Decomposition of the downburst radial velocity at R/D=0.9 and Z/D=0.06. .... 39
Fig. 2-6. Contour lines of Wind field characteristics. ... 39
Fig. 2-7. Peak radial wind profile along the tower height under. ... 41
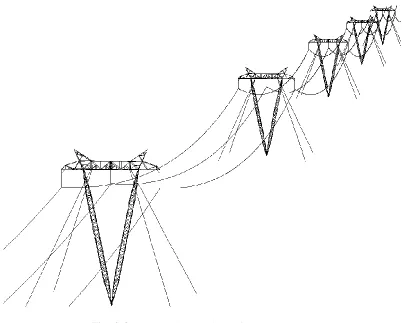
Fig. 2-8. Schematic 3D view of the study line. ... 43
Fig. 2-9. Schematic of the test layout and the names of the tested towers. ... 43
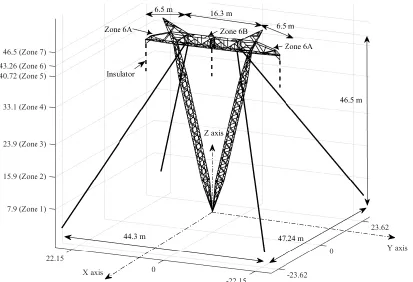
Fig. 2-10. 3D view of the prototype transmission tower. ... 44
Fig. 2-11. Steel angle dimensions of the tower. ... 44
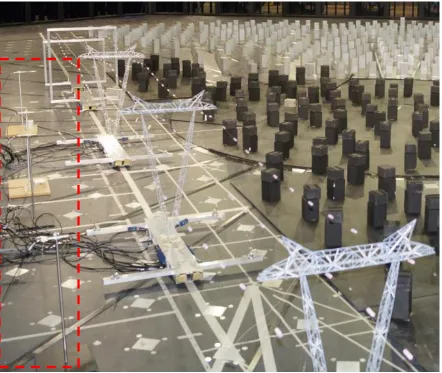
Fig. 2-12. Half-length of the assembled line. ... 45
Fig. 2-13. Pictures of D, E, F, and G frames. ... 45
Fig. 2-14. Test picture of A, B, and C towers. ... 46
Fig. 2-15. (a) Spine dimensions (in mm), (b) Schematic of the full-scale guyed tower... 48
Fig. 2-16. Model boundary conditions details. ... 51
Fig. 2-17. Instrumentations of the tower. ... 52
Fig. 2-18. Accelerometers and strain gauges. ... 53
xvii
Fig. 2-20. Summary of downburst-structure orientations for the considered layouts. ... 57
Fig. 2-21. Test layout 1. ... 58
Fig. 2-22. Test layout 2. ... 59
Fig. 2-23. Test layout 3. ... 60
Fig. 2-24. Base shear comparison for the three tested layouts. ... 62
Fig. 2-25. Response decomposition flow chart. ... 66
Fig. 2-26. Illustration of “no resonance” response case, in Layout 1, R/D = 0.9 and VRD=35 m/s. ... 67
Fig. 2-27. Illustration of “resonance” response case in Layout 2, R/D = 0.9 and VRD=35 m/s. ... 67
Fig. 2-28. Tower responses of Layout 1 at R/D = 0.9 (Cont.). ... 69
Fig. 2-29. Tower responses of Layout 2 at R/D = 0.8. ... 69
Fig. 2-30. Tower responses of Layout 3 at R/D = 0.8 and X/L = 1.25. ... 70
Fig. 2-31. Dynamic amplification factor DAF for the studied layouts. ... 73
Fig. 2-32. Load path... 76
Fig. 3-1. Guyed tower failure (Hydro One report, 2006) ... 85
Fig. 3-2. Downburst characteristic parameters ... 85
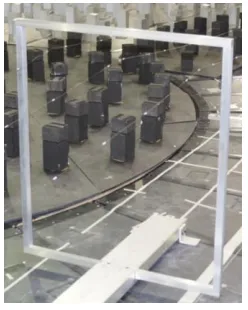
Fig. 3-3.Testing chamber ... 92
Fig. 3-4. Downburst formation snapshot at WindEEE ... 93
Fig. 3-5. Wind Field measurement using cobra probe devices... 95
Fig. 3-6. Repeatability of the downburst wind field ... 95
Fig. 3-7. Evolution of downburst radial profiles at time = 4.84 seconds ... 95
xviii
Fig. 3-9. Schematic of the test layout ... 97
Fig. 3-10. 3-D view of the prototype tower ... 98
Fig. 3-11. Half-length of the assembled line ... 98
Fig. 3-12. Summary of downburst-structure orientations for the considered layouts .... 101
Fig. 3-13. Test layout 1 ... 102
Fig. 3-14. Test layout 2 ... 103
Fig. 3-15. Test layout 3 ... 104
Fig. 3-16 Sample response of the middle tower subjected to downburst loads ... 106
Fig. 3-17. Layout 1 maximum peak responses of the tower B ... 107
Fig. 3-18. Layout 2 maximum peak responses of the tower B ... 108
Fig. 3-19. Layout 3 maximum peak responses of tower B ... 110
Fig. 3-20. Layout 3 maximum mean responses of tower B ... 111
Fig. 3-21. Base shear validation ... 114
Fig. 3-22. Base moment validation ... 114
Fig. 3-23. Free body diagram of the cross arm system under the oblique case ... 115
Fig. 3-24. conductor’s model validation ... 115
Fig. 3-25. Guys tension validations ... 116
Fig. 3-26. center support force validation ... 116
Fig 3-27. Mid-height moment validation... 116
Fig. 4-1. Downburst characteristic parameters. ... 130
Fig. 4-2. Radial velocity profile along the height. ... 131
Fig. 4-3. Vertical velocity profile along the height ... 131
xix
Fig. 4-5. Velocity distribution along multiple spans in the case of an oblique downburst.
... 135
Fig. 4-6. Variations of AD with different downburst diamaters... 136
Fig. 4-7. Location of downburst corresponding to conductor’s maximum longitudinal force. ... 136
Fig. 4-8. Transvsre velocity distribution for the critical oblique load case (R/D=1.6 and ϴ=30° and L/DJ=0.5). ... 137
Fig. 4-9. Distribution of transverse forces on the conductor due to the critical oblique downburst case. ... 140
Fig. 4-10. Variations of RX with h. ... 143
Fig. 4-11. Variations of RX with α. ... 143
Fig. 4-12. Variations of RX with SL. ... 143
Fig. 4-13. Variations of RX with w. ... 143
Fig. 4-14. Flow chart of the interpolation process to obtain the conductor’s longitudinal force under the critical oblique downburst load case. ... 149
Fig. 4-15. Direction of the conductor forces RX and RY. ... 150
Fig. 5-1. Downburst characteristic parameters. ... 179
Fig. 5-2. Radial velocity profile along the height. ... 182
Fig. 5-3. Axial velocity profile along the height. ... 183
Fig. 5-4. Time history of the radial velocity at a point in space ... 183
Fig. 5-5 Transmission Line System (G1) ... 188
Fig. 5-6 Transmission Line System (G2) ... 188
xx
Fig. 5-8. Transmission Line System (S1) ... 189
Fig. 5-9. Transmission Line System (S2). ... 189
Fig. 5-10. Transmission Line System (S3). ... 189
Fig. 5-11. Conductor reactions under downburst wind field. ... 194
Fig. 5-12. Radial velocity distribution along line spans at R/DJ=1.3 and ϴ=0°. ... 197
Fig. 5-13. Radial velocity distribution along tower height- ϴ=90°. ... 198
Fig. 5-14. Radial velocity distribution along tower height ϴ=0°. ... 199
Fig. 5-15. Radial velocity distribution over six conductor spans ϴ=0° ... 200
Fig. 5-16. Downburst span reduction factor ... 200
Fig. 5-17. Radial velocity distribution along tower height at R/DJ=1.5 and L/ DJ=0.5, and ϴ=30°. ... 202
Fig. 5-18. Radial velocity distribution over six conductor spans at R/DJ=1.5 and L/ DJ=0.5, and ϴ=30° ... 202
xxi
Symbol Description
λa Acceleration scaling ratio.
A1 Area under the squared transverse velocity curves for the conductor spans located
on the right side
A2 Area under the squared transverse velocity curves for the conductor spans located
on the left side.
AD Difference between the squared values of A1 and A2 normalized by the length of
three spans of the line: AD= (A12-A22)/3L.
am Model acceleration.
ap Prototype acceleration.
B Background component.
λBM Bending and torsional moment scaling ratio.
CD Drag coefficient.
D WINDEEE downburst diameter.
DAF Dynamic amplification factor.
DJ Downburst jet diameter.
DJm Downburst size in the model-scale.
DJP Downburst size in the full-scale.
dp Single wire projected diameter perpendicular on the transvers direction of the
downburst velocity.
EA Conductor’s axial stiffness factor.
λEA Elastic stiffness scaling ratio.
λEI Elastic stiffness scaling ratio.
F Fluctuating component.
λf Force per unit length scaling ratio.
λF Force scaling ratio.
xxii fcut Cut off frequency.
FDB Peak internal forces due to downburst loading.
Fm Model force.
fmean Mean component of frequencies.
FP Forces from parametric study.
Fp Prototype force.
fshedding Shedding frequency.
h Insulator length.
H Physical height of jet.
λI Mass moment of inertia per unit length scaling ratio.
λI Mass moment of inertia scaling ratio.
Iur Turbulence intensity in radial direction.
L Line span.
λL Length scaling ratio.
Lm Model length.
Lp Prototype length.
m Conductor’s mass.
λm Mass per unit length scaling ratio.
λM Mass scaling ratio.
MCa Moment in cross arms.
Mi1 Moment at mid-height for the first leg.
Mi2 Moment at mid-height for the second leg.
MXb Base moment in X direction.
MYb Base moment in Y-direction.
QX Base shear in X direction.
Qy Base shear in Y direction.
R Distance between the downburst center to the structure of interest center.
xxiii
RX (3-4) Cable longitudinal force corresponds to the selected design group maximum
weight, minimum insulator length, and the line's actual α.
RX (5-6) Cable longitudinal force corresponds to the selected design group minimum
weight, maximum insulator length, and the line's actual α.
RX (7-8) Cable longitudinal force corresponds to the selected design group maximum
weight, maximum insulator length, and the line's actual α.
RX (h max) Cable longitudinal force corresponds to the selected design group maximum
insulator length, the line actual α, and the line's actual w.
RX (h min) Cable longitudinal force corresponds to the selected design group minimum
insulator length, the line's actual α, and the line's actual w.
RX Downburst critical longitudinal unbalanced force based on the proposed design
charts corresponds to the actual insulator length.
RX1 Cable longitudinal force under downburst critical case #3 corresponding to
specific design group (wmin, hmin, αmin).
RX2 Cable longitudinal force under downburst critical case #3 corresponding to
specific design group (wmin, hmin, αmax).
RX3 Cable longitudinal force under downburst critical case #3 corresponding to
specific design group (wmax, hmin, αmin).
RX4 Cable longitudinal force under downburst critical case #3 corresponding to
specific design group (wmax, hmin, αmax).
RX5 Cable longitudinal force under downburst critical case #3 corresponding to
specific design group (wmin, hmax, αmin).
RX6 Cable longitudinal force under downburst critical case #3 corresponding to
specific design group (wmin, hmax, αmax).
RX7 Cable longitudinal force under downburst critical case #3 corresponding to
specific design group (wmax, hmax, αmin).
RX8 Cable longitudinal force under downburst critical case #3 corresponding to
specific design group (wmax, hmax, αmax).
RY Conductor force in the transverse direction.
RZ Reaction at tower of interest in Z direction.
S Percentage of the cable sag divided by line span.
St Strouhal number.
xxiv
TGuy Tension in guys.
Tm Model time period.
tmax Time correspond
Tp Prototype time period.
λv Velocity scaling ratio.
VeqC Equivalent uniform velocity distribution for conductors.
VeqT Equivalent uniform velocity distribution for tower.
VeqTL Equivalent uniform velocity distribution for transmission line.
VJ Downburst jet velocity.
VJm Downburst jet velocity in the model-scale.
VJP Downburst jet velocity in the full-scale.
Vm Model velocity.
Vp Prototype velocity.
VRD The radial (horizontal) component of the downburst velocity.
VRDmax Peak radial velocity.
VTR A component of the radial velocity of the downburst that acts perpendicular to
the conductor’s direction.
VVR The vertical component of the downburst velocity.
w Single wire weight per unit length.
X Distance from jet center in X direction.
X-axis The axis that passes along the line direction (longitudinal direction).
Y Distance from jet center in Y direction.
Y-axis The axis perpendicular to the line direction (transverse direction).
Z Height from ground level.
α The wind pressure (0.5*ρ*VJ2 * dp).
ΔTL The increase in the tension force of the conductors on the left hand side of the
tower of interest due to the downburst loads.
Δtm Time step used in the CFD model.
xxv
ζ Aerodynamic damping.
ϴ Angle between the vertical plane of the transverse direction and the vertical plan connecting the downburst and the structure of interest centers.
λξ Damping scaling ratio.
ρ Air density.
λρ Density scaling ratio.
CHAPTER 1
INTRODUCTION
1.1
Background
Electricity is carried by Transmission Lines (TLs) from the source of generation to the
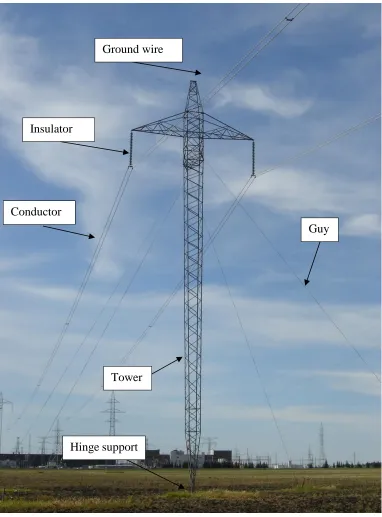
distributing system. A transmission line system consists of support towers, conductors,
insulators and ground wires. The conductors are responsible for transmitting the electricity
and they are attached to the towers using the insulators. The ground wires protect the line
from the lightning strike. Two main structural systems for the towers can be used; a) guyed
towers and b) self-supported towers. Fig. 1-1 shows an example of a guyed lattice
transmission tower and the line components. The figure shows that the support system for
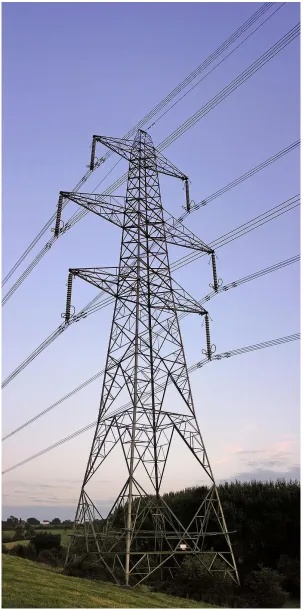
this specific guyed tower consists of four guys and a hinge at the base. Fig. 1-2 shows
another example of self-supported lattice transmission line, where the tower is supported
only at the base of its legs. Other tower systems include H-frame, steel, concrete and wood
poles. The current study focuses on the steel lattice towers systems only.
A downburst is defined as an intensive downdraft air that induces very strong wind in all
directions when striking the ground. Specifically, Fujita (1985) defined a downburst as a
mass of cold and moist air that drops suddenly from the thunderstorm cloud base, impinges
on the ground surface, and then horizontally diverges from the centre of impact. The
ubiquity and full integration of electronics into modern life means that power outages due
to TLs failure are unacceptable because of the associated social and economic losses. In
many countries, past reports highlighted that the main cause of modern transmission line
failures is the extreme High Intensity Wind (HIW) localized events in the form of
the transmission line failures in Australia were induced by downbursts. In southwestern
Slovakia, Kanak et al. (2007) studied a downburst event that occurred in 2003 where at
least 19 electricity transmission towers collapsed. In China, Zhang (2006) reported the
failures of 18 towers belonging to 500 kV lines and 57 towers belonging to 110 kV lines
due to strong wind events such as downbursts, tornadoes and typhoons. Most recently, in
September 2016, 23 transmission towers failed during a series of downburst events in
South Australia (Australian Wind Alliance, 2016). Also, several failures of transmission
line system under downburst events have been reported in Canada such as the failure of 19
transmission towers located near Winnipeg, Manitoba reported by McCarthy and Melsness
(1996), and the failure of two guyed towers belonging to Hydro One, Ontario (Failure
report, 2006).
Despite the recurrence of the transmission line failures during downburst events, no
detailed guidelines are available yet in the current standards to assist practitioners to
adequately consider the effect of those extreme events in designing new towers or in the
rehabilitation of existing ones. ASCE 74 (2010) states that downburst wind speed can be
taken in accordance with the intensity defined for an F2 tornado. ASCE 74 (2010) suggest
considering two or three spans to be affected by the downburst winds. No further details
are provided in this guideline regarding downburst loading. For certain areas in Australia,
AS/NZS:7000 (2010) suggests some modifications in the wind pressure equations in order
to account for the downburst loads. These modifications include a topography factor, span
reduction factor, and terrain-height factor. Again, the guidelines are not detailed enough
and do not address many aspects of the downbursts including the effect of their localized
Fig. 1-1 Guyed transmission tower components (Source: Wikipedia:
https://en.wikipedia.org/wiki/Transmission_tower).
Conductor
Ground wire
Insulator
Guy
Fig. 1-2 Lattice self-supported transmission line (Source: Wikipedia:
According to Hjelmfelt (1988), the diameter of a downburst, DJ, can vary between 500 m
and 2 Km. The typical conductor’s span of a transmission line system varies between 200
m and 500 m and sometimes it exceeds that. This means that the size of the downburst can
be in the same order of magnitude as the conductor span. As a result, the loads experienced
by the tower and the attached conductors would vary depending on the size and the location
of the downburst relative to this specific tower. Depending on the location of the
downburst, the loads on the conductors might not be uniform and might vary from
conductor span to another. This feature characterizes the localized wind events such as
downbursts and tornadoes and does not exist for large scale events such as hurricanes and
typhoons. As a result, it is expected that a number of critical load profiles leading to peak
internal forces in various members of a transmission tower might exist depending on the
downburst location. Determining those critical loading profiles for a general steel lattice
transmission tower is the ultimate goal of this study. In this chapter, a literature review
pertaining to the problem of transmission line structures under downbursts is presented.
The review focuses first on the downburst wind field where field measurement and
numerical studies available in literature are presented. This is followed by coverage for the
studies conducted on the structural response of transmission lines under downbursts. An
extensive research program was conducted on this subject by the research group of the
author’s supervisor at The University of Western Ontario (UWO). The current Thesis
builds on this research and expand it. As such, the progress of research conducted by the
research group at UWO is presented in a separate section. The gaps existing in the literature
are then presented in view of the outlined literature summary. This is followed by
1.2
Downburst Wind Field
1.2.1
Downburst Field Measurements
Because of their localized nature in both space and time, field measurements of downbursts
are quite limited. Those include the measurements conducted by the Northern Illinois
Meteorological Research (NIMROD) and the Joint Airport Weather Studies (JAWS),
which were reported by Fujita (1990) and the FAA/Lincoln Laboratory Operational
Weather Studies (FLOWS) measurement reported by Wolfson et al. (1985). Wilson et al.
(1984) used the Doppler weather radar data from the JAWS project and reported the
horizontal and vertical profiles of the microburst. Holmes and Oliver (2000), Savory et al.
(2001), and Orwig and Schroeder (2007) indicated that the downburst wind speed recorded
during the measured events ranged between 50 m/s to 70 m/s. Lombardo et al. (2014)
analyzed the archived data obtained by Automated Surface Observing System ASOS to
identify a number of downburst thunderstorms and compared them to synoptic wind events.
The results showed that a shorter averaging times (15–60 s) can be used for downbursts
compared to 10 min for synoptic winds. In addition, the study revealed that gust factors
corresponding to those thunderstorm events differ from synoptic winds. Based on the field
measurements at different ports in Europe such as in Genova, Savona, La Spezia, Livorno,
and Bastia, De Gaetano et al. (2014) analyzed the set of data recorded using a semi-
automated procedure to separate different downburst events. The authors stated that
separating the synoptic and non-synoptic events is a hard task due to the presence of
third-class events that has intermediate properties between the main two third-classifications of winds.
Solari et al. (2015) reported the thunderstorms recorded through the ‘‘Wind and Ports”
number of thunderstorm records detected in the Ports of Genoa, La Spezia and Livorno
during the period of 2011 to 2012. Solari et al (2015) reported the mean values and the
coefficient of variation of three wind velocity ratios that are believed to have a significant
effect on structures.
1.2.2
Experimental Studies for Downburst Wind Field
Different approaches were used to simulate the downburst wind field physically inside
wind tunnel laboratories. Donaldson and Snedeker (1971) considered simulating a
small-scale downburst using a jet flow issuing from a circular convergent nozzle and impinging
on a wall. Using a similar set-up, Didden and Ho (1985) utilized a jet of a diameter of
0.0381 m and a wall positioned at a distance of 0.1524 m from the jet.This represented a
height “H” to diameter “DJ” ratio, H/DJ, equal to 4.0. Similar experimental simulations
were conducted and reported by Osegura and Bowles (1988), Lundgren et al. (1992),
Alahyari and Longmire (1994), Yao and Lundgren (1996), Choi (2000), Wood et al. (2001)
and Chay and Letchford (2002) where a jet was impinged normally onto a flat plate in the
laminar boundary layer. The simulation of the wind field in Chay and Letchford (2002)
study considered a 0.5 m jet diameter against a flat wall located at 0.85 m distance. This
represented an H/DJ ratio of 1.7. The study did not represent the transient nature of the
downburst. Simulating the downburst wind-like profile is another experimental approach
that is specially used in structural applications to model the effect of the downburst winds
on structures (Lin et al., 2012).
1.2.3
Numerical Studies for Downburst Field Characterization
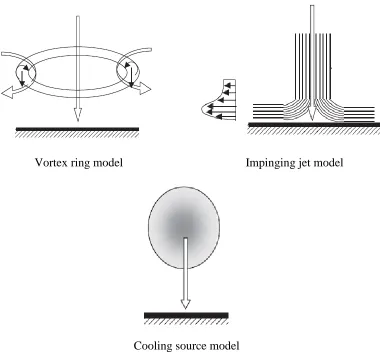
Different studies attempted modelling the downburst wind field numerically using
literature simulated downbursts using one of the following techniques: a) Ring Vortex
Model, b) Impinging Jet (Impulsive Jet) Model, and c) Cooling Source (Buoyancy-Driven)
Model, which are illustrated in Fig. 1-3. The Ring Vortex Model (Zhu and Etkin, 1985;
Ivan, 1986; Vicroy, 1992; Savory et al., 2001) simulates the vortex ring that is formed
during the descent of the downdraft air column. Savory et al. (2001) reported that the Ring
Vortex Model is not accurate in simulating the downburst field near the ground after the
air column touches the ground. The Impinging Jet Model (suggested by Fujita, 1985 and
used in Kim and Hangan, 2007, Sengupta and Sarkar, 2008, Aboshosha et al., 2015,
Hadzˇiabdic´, 2005, Chay et al., 2006, Gant, 2009) is based on the analogy between an
impulsive jet impinging upon a flat surface and a downburst. Mason et al. (2009)
implemented the cooling source method based on a dry, non-hydrostatic, sub-cloud and
axisymmetric model. One year later, Mason et al. (2010) extended this work to a
three-dimensional model. In both studies, the Scale Adaptive Simulation (SAS) method
developed by Menter and Egorov (2005) was used, which is an improvement for the
unsteady Reynolds-Averaged Navier–Stokes (URANS) method employed to predict
unsteady turbulent flow. However, Gant (2009) reported that the SAS method appears to
be over-predicting the turbulent viscosity of jet-type flows. Vermeire et al. (2011)
simulated the downburst using the cooling source approach with Large Eddy Simulation
(LES) and the results showed a good agreement with those reported by Mason et al. (2009)
Vortex ring model Impinging jet model
Cooling source model
Fig. 1-3. Numerical modeling methods of downburst winds.
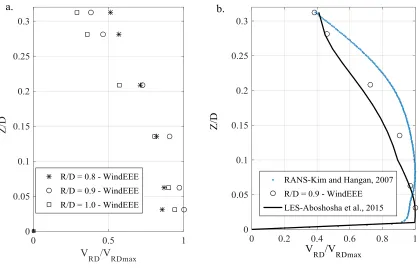
For both the experimental and the numerical studies, the dimensions of the wind field
domain were reported to influence the characteristics of the resulting radial velocities of
the downburst. Previous studies linked the dimensions of the wind field domain in terms
of the height, H, and the downburst diameter, DJ to the ratio H/DJ reported from field
measurements of real downburst events. Hjelmfelt (1988) reported that the physical ratio
H/DJ varies between 1.2 and 6. The numerical simulations conducted by Kim and Hangan
(2007), Vermeire et al. (2011), and Aboshosha et al. (2015) employed an H/DJ of 4.0, 4.0
and 2.0, respectively, to simulate the downburst wind field using the impinging jet method.
of 4.0 and 1.7, respectively. The comparison conducted by Kim and Hangan (2007) for the
peak vertical profile of the radial velocity resulting from different simulations using
different H/DJ ratios indicated that the peak profile of the radial velocity is independent
from the ratio H/DJ.
1.3
Studies on TLs Response to Downbursts
Few number of studies focused on the response of transmission line systems subjected to
downburst winds. Savory et al. (2001) studied the failure of transmission towers under both
tornado and downburst wind loading. In their study, the conductor loads were neglected
and, as a result, failures were only associated with the tornado loading while no failure was
observed with the downburst loading. This is because downbursts are larger in size and are
expected to load a larger portion of the conductors compared to tornadoes. Mara and Hong
(2013) studied the inelastic response of a transmission tower subjected to both a downburst
and a synoptic wind field. The study showed a dependency of the tower capacity on the
wind direction for both wind fields. Wang et al. (2009) studied the dynamic effect of a
downburst on tall transmission towers. The study showed that the size of the downburst
has a negligible effect on the dynamic response of the tower. However, the size of the
downburst event affected the displacement response of the tower. Yang and Zhang (2016)
analyzed two transmission towers under both normal and downburst winds. In their study,
the resultant of the conductor’s forces was calculated and applied on the tower at the
insulator-conductor’s connection. All of the above studies did not account for the spatial
variation of the downburst wind field.
Other studies assessed the dynamic response of the components of transmission line
the dynamic response of TL conductors subjected to synoptic wind using horizontally
distorted conductors to indirectly accommodate the large length of the span into the wind
tunnel lab. The study showed that the response of the conductors was mainly background
response. In a number of cases, the study showed that the resonance contribution may
increase depending on the aerodynamic damping of the conductors. This agreed with the
findings reported by Battista et al. (2003) and Gani and Legeron (2010) who emphasized
on the importance of considering the dynamic effects of the conductors. Lin et al. (2012)
tested a single span aero-elastic model of a guyed lattice tower under both the synoptic and
the downburst winds at a conventional boundary layer wind tunnel lab. In their study, a
number of 57 downburst-like profiles were simulated. The study showed that the resonance
component of the conductor reactions can be as high as the background. It is clear that no
clear definite conclusion about the contribution of the resonant component in the response
of transmission line structures to wind loads in general and downbursts in particular can be
found in the literature.
1.4
Research Conducted at UWO On the Effect of Downbursts on TLs
The research at UWO was initially funded by Manitoba Hydro, Manitoba, Canada, and
then by Hydro One, Ontario, in order to investigate the reasons behind the chain of TLs
failures that occurred in those two Canadian provinces. Shehata et al. (2005) developed a
finite element model that simulates the tower members and the guys using two-nodded
linear three-dimensional frame element with three translational and three rotational degrees
of freedom per node. Each tower member was simulated using one element while each guy
was modeled using five elements. Rigid connections were assumed between the tower
moments. In their study, Shehata et al. (2005) considered a number of six spans per line
where the conductors were simulated using 2-D non-linear consistent beam element
developed by Koziey and Mirza (1994) and modified later by Gerges and El Damatty
(2002) to include the effect of geometric nonlinearity. The model accounted for the
conductor’s pretension force, the conductor’s sag, and the insulator stiffness. In their
model, Shehata et al. (2005) developed a procedure to scale up the model-scale impinging
jet wind field data provided by Hangan et al. (2003) and validated later by Kim and Hangan
(2007). Using the structural analysis model developed by Shehata et al. (2005), Shehata
and El Damatty (2007) conducted a parametric study to investigate the critical downburst
configurations by varying the downburst jet diameter (DJ) and the location of the
downburst center relative to the tower (R). The study considered only the mean component
of the downburst wind field. Shehata et al. (2005) reported that the effective period of the
mean component of the downburst wind speed ranges between 20 and 22 s while the
vibration frequencies for the transmission tower and the conductors were about 0.58 s and
8.25 s, respectively. This means that no strong dynamic effect for the tower would be
expected. The downburst parameters, in terms of the size of the event and its location
relative to the tower, leading to maximum forces in the tower members, were identified.
The study revealed that the critical downburst parameters vary based on the type and
location of the members. Unsurprisingly, the chord members, diagonal members and cross
arm members had different critical downburst configurations. Shehata and El Damatty
(2008) extended their numerical scheme by including a failure model for the tower
members, which was used to study the progressive collapse of the tower failure. An
downburst parameters and the corresponding forces on a transmission line through an
automated procedure. A similar parametric study conducted by Darwish and El Damatty
(2011) focused on assessing the response of a self-supported tower. Shehata and El
Damatty (2007) predicted different failure modes for transmission towers subjected to
downburst winds. One of the critical failure modes, that was also reported by and Darwish
and El Damatty (2011), was found to be due to the significant variation in the longitudinal
tensile forces developing in the conductors adjacent to the tower of interest from both sides.
Shehata et al. (2005) revealed that a longitudinal force transmitting to the tower cross arms
leads to an out-of-plane bending moment in this region. The studies conducted by Shehata
and El Damatty (2007, 2008) and Darwish and El Damatty (2011) agreed that changing
the location of the downburst has a strong effect on the value of the internal forces
developing in tower members.
Later, Ladubec et al. (2012) improved upon the linear analysis conducted by Shehata and
El Damatty (2008) by including the P–Δ effect in the tower’s using nonlinear space frame
elements to simulate the tower members. The study showed an increase of 20% in the peak
axial forces in the chord members of the main legs, as compared to the results from a linear
analysis.
The inclusion of the turbulent component in the structural analysis might magnify the
response due to the combined effects of the fluctuating (background) component and the
resonant component. Darwish et al. (2010) extracted the turbulence from the field
measurements of a downburst conducted by Holmes et al. (2008). They used this
turbulence measurement to study the dynamic response of the conductors. The study found
different loading configurations. Also, the study reported that the resonant component is
negligible due to the large aerodynamic damping of the conductors. This might be
attributed with the assumption made in this study regarding the spatial variation of the
turbulence field. Darwish et al. (2010) utilized the turbulence measured at a single point in
space and assumed that this measurement is the same along six spans of the conductors;
i.e., assumed full correlation. In addition, Darwish et al. (2010) employed Davenport
(1962) expression to calculate the aerodynamic damping of the conductors. This expression
was developed for the case of synoptic winds which does not account for the effect of the
spatial localization of the downbursts. Hamada (2014) assessed the dynamic response of
an aero-elastic model of a transmission line subjected to normal winds. The study reported
a high resonant response of the conductors at low wind speeds as a result of the low
aerodynamic damping of the conductors at those speeds.
The high flexibility and the expected nonlinear behavior of the conductors result in
significant computational time when finite element modeling is used to predict the response
of conductors under downburst loading. This is because a large number of analyses in order
to consider potential size and location of the downburst in estimating the peak structural
response. Aboshosha and El Damatty (2014-a) developed a semi-analytical technique to
analyze multi-spanned conductors under HIW. This technique represents the first
semi-closed form solution for a multi-spanned conductor system under non-uniform loading
taking into account the insulator flexibility. The technique was reported to be
approximately 185 times faster than finite element analysis.
Aboshosha et al. (2015) simulated the downburst wind field using both the impinging jet
exposures using the fractal surface method. Using the turbulent wind field developed by
Aboshosha et al. (2015), Aboshosha and El Damatty (2015) studied the dynamic and the
quasi-static responses of a single span and multi spanned transmission line conductors
under both the synoptic and the downburst loads. For multi-spanned lines, the study
showed that the contribution of the resonant component is in order of 6% of the peak
reactions assuming different wind intensities. However, for single span conductor, the
contribution of the resonant component to the peak responses was higher (in order of 16%)
at low speeds. Aboshosha and El Damatty (2014-b) simulations evaluated the span
reduction factor of the downburst radial velocities along the longitudinal direction. The
study reported that the span reduction factor of the downburst wind field varies between 1
and 0.85. This results agreed with the findings reported by Holmes et al. (2008).
1.5
Research Gaps
Although different components of the numerical model developed by the UWO team were
validated individually, no experimental validation was done for the entire model under
simulated downbursts. Also, no experimental study under simulated downbursts was
conducted to quantify the dynamic effect resulting from the turbulence component of the
downburst for both the tower and the conductors. The recent establishment of the
WindEEE dome provides a unique opportunity for simulating large-scale downbursts.
WindEEE is a one-of-a-kind three-dimensional wind testing chamber with a hexagonal
shape of 25 m in diameter. The facility allows simulating different terrain exposures using
automated roughness elements mounted on the ground floor of the testing chamber. The
bell mouth-opening diameter (D) is 3.2 m while the height of the testing chamber (H) is
also testing of relatively large scale aero-elastic model under simulated downbursts. Such
a test can be used to conduct the needed studies mentioned above involving quantifying
the dynamic effect and validating the numerical models. The research conducted at the
UWO on the effect of downbursts on transmission line structures should lead at the end to
the development of velocity profiles and load cases that can simulate the critical effect of
downbursts on lattice transmission line structures. Those load cases need to be simple
enough, not requiring complicated non-linear analyses, so they can be easily applied by
practitioners.
1.6
Scope of the Current Study
The thesis aims to address the gaps mentioned in the above section. As such, the objectives
of the thesis are:
1. Assess experimentally the dynamic response of lattice transmission lines and their
attached conductors to the downburst induced loads.
2. Assess the effect of downburst spatial variation on the response of transmission
lines.
3. Validate experimentally previously developed numerical models used predict the
response of transmission line structures to downbursts.
4. Identify the critical downburst load cases that can be used to design generic tangent
transmission lines to resist downburst winds.
5. Develop a simple approach that can be used to predict the conductor forces
transmitted from the conductors to the towers as a resulting of a downburst oblique
1.7
Organization of The Thesis
This thesis has been prepared in an “Integrated-Article” format. In Chapter 1, a review of
the studies and approaches related to downburst wind field and the transmission line
response under downbursts is provided. This is followed by achieving the main objectives
of the study. These objectives are addressed in detail in the following four chapters.
1.7.1.
Aero-elastic Testing of Multi-Spanned Transmission Line
Subjected to Downbursts
In this chapter, an aero-elastic multi-spanned TL is designed and tested at the WindEEE
dome in order to assess the dynamic response of a multi-spanned transmission line due to
the downburst-induced loads. The chapter starts by characterizing the downburst wind field
measured at WindEEE using cobra probes devices. The study then provides a detailed
information of the design of the aero-elastic tower and the attached conductors. A number
of test configurations are selected based on the findings of previous numerical studies.
Those configurations cause the peak internal forces in the tower members due to the
downburst loads. The study proposes a decomposition approach to extract the resonance
and the background components from the measured fluctuating responses of the tower and
the conductors. The study shows the Dynamic Amplification Factor (DAF) for different
structural responses of the tower and the conductors subjected to downburst wind loads.
1.7.2.
Aero-Elastic Response of Transmission Line System
Subjected to Downburst Wind: Validation of Numerical Model
Using Experimental Data
In this chapter, the results of the test described in chapter 1 is used to validate the built
in-house numerical models developed by Shehata et al. (2005) and Aboshosha and El Damatty
studies described in chapter 4 and 5. The chapter starts by characterizing the downburst
wind field measured at WindEEE. The study then gives a summary about the aero-elastic
model and the test layouts used. The results of the test are then used to assess the effect of
the spatial variations of the downburst with respect to the tower of interest. A number of
selected test cases are utilized to validate the above mentioned numerical models. The
validation process considers the external force calculations, shielding and drag effect,
forces distribution, and internal force calculations.
1.7.3.
Critical Load Cases for Lattice Transmission Line
Structures Subjected to Downbursts: Economic Implications for
Design of Transmission Lines
This chapter is triggered by the fact that codes of practice and guidelines provide very
limited information regarding the critical load profiles associated with the downbursts and
acting on the towers and conductors of a transmission line system. The complexity of
finding this critical load profiles results from the localized nature of such events which
depends not only on the magnitude of the event but also on its size and its location relative
to the center of the tower. In this chapter, an extensive parametric study is conducted on a
number of real lattice transmission line systems, to evaluate their critical response to
downburst loads. The study considers the variation in the downburst location, the angle of
attack, and the size to understand the effect of changing these parameters on the response
of the transmission line system. At the end of study, a number of critical load cases are
identified for possible implantation in the design codes. The study then assesses the
economic implication of applying the proposed load cases using the increase of the weight
1.7.4.
Longitudinal Force on Transmission Towers due to
Non-Symmetric Downburst Conductor Loads
The objective of this chapter is to develop a simple procedure that can be used by
practitioners to estimate the maximum longitudinal force developing in TL conductors
subjected to downburst. This longitudinal force develops when the downburst winds are
acting on the line with an oblique angle. The oblique configuration of the downburst loads
leads to an uneven and unequal distribution of the wind forces along the conductor spans
located at opposite sides of the tower of interest. This results in a difference between the
tension forces developing in the right and the left hand sides spans adjacent to the tower of
interest. This difference in tension forces will lead to a net longitudinal force acting on the
cross arm of the tower. The regular estimation of this force requires conducting a nonlinear
iterative analyses of the conductors under the variable loading conditions of the downburst,
while taking into account a number of key parameters including the flexibility of the
insulators and the conductor’s pretension force. This force is believed to be the reason for
the failure of a number of towers during downbursts.
1.7.5.
Summary and Conclusions
This chapter presents summary and conclusions of the entire thesis together with
recommendations for further research work.
1.8
References
Aboshosha, H., and El Damatty, A., (2014-a), “Effective technique for the reactions of transmission line conductors under high intensity winds”, Wind and Structures. 18(3), 235-252.
Aboshosha, H., Bitsuamlak, G., El Damatty A., (2015), “Turbulence characterization of downbursts using LES”, Journal of Wind Engineering and Industrial Aerodynamics. 136, 44–61.
Aboshosha, H., El Damatty, A., (2014-b), “Span Reduction Factor of Transmission Line Conductors under Downburst Winds”, Journal of Wind and Engineering 11(1), 13-22.
American Society of Civil Engineers (ASCE), (2010) “Guidelines for electrical transmission line structural loading”, ASCE manuals and reports on engineering practice, No. 74, New York, NY, USA.
Alahyari, A., Longmire, E., (1994), “Particle image velocimetry in a variable density flow: application to a dynamically evolving downburst”, Experiments in Fluids 17, 434– 440.
Australian Standard/New Zealand Standard (AS/NZS) 7000, (2010) “Overhead line design detailed procedures”, Standards Australia Limited/Standards New Zealand, North Sydney, Australia.
Australian Wind Alliance, (2016): http://www.windalliance.org.au/
Battista, R., Rodrigues, R., Pfeil M., (2003), “Dynamic behavior and stability of transmission line towers under wind forces”, J Wind Eng Ind Aerodyn, 91:1051–67.
Chay, M., Albermani, F. and Wilson, R., (2006), “Numerical and analytical simulation of downburst wind loads”, Engineering Structures 28(2), 240-254.
Chay, M., Letchford, C., (2002), “Pressure distributions on a cube in a simulated thunderstorm downburst - part a: stationary downburst observations”, Journal of Wind Engineering and Industrial Aerodynamics 90, 711–732.
Choi, ECC., (2000), “Wind characteristics of tropical thunderstorms”, Journal of Wind Engineering and Industrial Aerodynamics 84, 215–26.
Darwish, M., El Damatty A., and Hangan, H., (2010), “Dynamic characteristics of transmission line conductors and behaviour under turbulent downburst loading”, Wind and Structures 13(4), 327-346.
Darwish, M., and El Damatty, A., (2011), “Behavior of self-supported transmission line towers under stationary downburst loading”, Wind and Structures 14(5), 481-4.
De Gaetano, P., Repetto, MP., Repetto, T., Solari, G., (2014), “Separation and classification of extreme wind events from anemometric records”, J Wind Eng Ind Aerodyn;126:132–43.
Didden, N., and Ho, C., (1985), “Unsteady separation in a boundary layer produced by an impinging jet”, Journal of Fluid Mechanics 160, 235–256.
Donaldson, C., and Snedeker, R., (1971), “A study of free jet impingement, Part 1. Mean properties of free and impinging jets”, Journal of Fluid Mechanics 45, 281–319.
Failure Investigation Report, HYDRO ONE NETWORKS INC. “Failure of towers 610 and 611, circuit X503E – 500 kV guyed towers near the Township of Waubaushene”, Ontario, August 2, 2006”, Line Engineering, 2006.
Fujita, T., (1985), ‘‘The downburst: microburst and macroburst”, SMRP research paper 210. University of Chicago, USA.
Fujita, T., (1990), “Downbursts: meteorological features and wind field characteristics”, Journal of Wind Engineering and Industrial Aerodynamics 36, 75–86.
Gani, F., and Legeron, F., (2010), “Dynamic response of transmission lines guyed towers under wind loading”, Can. J. Civ. Eng., 37(3), 450-465.
Gant, S., (2009), “Reliability issues of LES-related approaches in an industrial context”, Flow, Turbulence and Combustion 84, 325-335.
Gerges, R., and El-Damatty, A., (2002), “Large displacement analysis of curved beams”, Proceedings of the Canadian Society of Civil Engineering Conference, Montreal, Canada, ST 100.
Hadzˇiabdic´, M., (2005), “LES, RANS and Combined Simulation of Impinging Flows and Heat Transfer”, Ph.D. thesis, University of Sarajevo, 185.
Hamada, A., (2014), “Numerical and experimental studies of transmission lines subjected to tornadoes”, Ph.D. thesis, The University of Western Ontario.
Hangan, H., Roberts, D., Xu, Z., and Kim, J., (2003), “Downburst simulation. Experimental and numerical challenges”, Proceedings of the 11th International Conference on Wind Engineering, Lubbock, TX, USA.
Hjelmfelt, M., (1988), “Structure and life cycle of microburst outflows observed in Colorado”, Journal of Applied Meteorology 27, 900–927.
Holmes, J., and Oliver, S., (2000), "An emperical model of a downburst", Engineering Structures 22, 1167-1172.
Holmes, J., (2008), “Recent developments in the specification of wind loads on transmission lines”, Journal of Wind and Engineering 5(1), 8-18.
Ivan, M., (1986), “A ring-vortex downburst model for flight simulations” Journal of Aircraft 23, 232-236.
Kanak, J., Benko, M., Simon, A. and Sokol, A. (2007), "Case study of the 9 May 2003 windstorm in southwestern Slovakia", Atmos. Res., 83, 162-175.
Kim, J. and Hangan, H., (2007), “Numerical simulations of impinging jets with application to downbursts”, Journal of Wind Engineering and Industrial Aerodynamics 95(4), 279-298.
Koziey, B., and Mirza, F., (1994), “Consistent curved beam element”, Computers and Structures 51(6), 643–654.
Ladubec, C., El Damatty, A., and El Ansary, A., (2012), “Effect of geometric nonlinear behaviour of a guyed transmission tower under downburst loading”, Proceedings of the International Conference on Vibration, Structural Engineering and Measurement, Shanghai, China, Trans. Tech. Publications, 1240-1249.
Lin, W., Savory, E., McIntyre, R., Vandelaar, C., and King, J., (2012), “The response of an overhead electrical power transmission line to two types of wind forcing”, Journal of Wind Engineering and Industrial Aerodynamics 100(1), 58-69.
Lombardo F., Smith D., Schroeder J., Mehta K., (2014), “Thunderstorm characteristics of importance to wind engineering”, Journal of Wind Engineering and Industrial Aerodynamics 125, 121–32.
Loredo-Souza, A., and Davenport, A., (2001), “A novel approach for wind tunnel modelling of transmission lines”, Journal of Wind Engineering and Industrial Aerodynamics 89, 1017–1029.
Mara, T., and Hong H., (2013), “Effect of wind direction on the response and capacity surface of a transmission tower”, Engineering Structures 57, 493–501.
Mason, M., Fletcher, D., and Wood, G., (2010), “Numerical simulation of idealized three-dimensional downburst wind fields”, Engineering Structures 32(11), 3558-3570.
Mason, M., Wood, G., Fletcher, D., (2009), “Numerical simulation of downburst winds”, Journal of Wind Engineering and Industrial Aerodynamics 97(11-12), 523-539.
McCarthy, P., Melsness, M., (1996) “Severe weather elements associated with September 5, 1996 hydro tower failures near Grosse Isle”. Manitoba, Canada. Environment Canada, Winnipeg, Canada.
Menter, F., Egorov, Y., (2005), “A scale adaptive simulation model using two- equation models”. Proceedings of 43rd AIAA Aerospace Sciences Meeting and Exhibit, American Institute of Aeronautics and Astronautics.
Orwig K., Schroeder, J., (2007), “Near-surface wind characteristics of extreme thunderstorm outflows”, Journal of Wind Engineering and Industrial Aerodynamics 95, 565–84.
Oseguera R., and Bowles R., (1988) “A simple, analytics 3-dimensional downburst model based on boundary layer stagnation flow” NASATM- 100632. Hampton (VA): NASA Langley Research Center.
Savory, E., Parke, G., Zeinoddini, M., Toy, N., and Disney, P., (2001), “Modelling of tornado and microburst-induced wind loading and failure of a lattice transmission tower”, Engineering Structures 23(4), 365-375.
Sengupta, A., Sarkar, P., (2008) “Experimental measurement and numerical simulation of an impinging jet with application to thunderstorm microburst winds”, Journal of Wind Engineering and Industrial Aerodynamics 96, 345–365.
Shehata, A., Nassef, A., and El Damatty, A., (2008), “A coupled finite element-optimization technique to determine critical microburst parameters for transmission towers”, Finite Elements in Analysis and Design 45(1), 1-12.
Shehata, A., and El Damatty, A., (2007), “Behaviour of guyed transmission line structures under downburst wind loading”, Wind and Structures 10(3), 249-268.