Scholarship@Western
Scholarship@Western
Electronic Thesis and Dissertation Repository
3-29-2017 12:00 AM
Developments in PET-MRI for Radiotherapy Planning Applications
Developments in PET-MRI for Radiotherapy Planning Applications
John Christian Patrick
The University of Western Ontario
Supervisor
Dr. Stewart Gaede
The University of Western Ontario
Graduate Program in Medical Biophysics
A thesis submitted in partial fulfillment of the requirements for the degree in Doctor of Philosophy
© John Christian Patrick 2017
Follow this and additional works at: https://ir.lib.uwo.ca/etd
Part of the Atomic, Molecular and Optical Physics Commons, Medical Biophysics Commons, Nuclear Commons, Oncology Commons, and the Other Analytical, Diagnostic and Therapeutic Techniques and Equipment Commons
Recommended Citation Recommended Citation
Patrick, John Christian, "Developments in PET-MRI for Radiotherapy Planning Applications" (2017). Electronic Thesis and Dissertation Repository. 4535.
https://ir.lib.uwo.ca/etd/4535
This Dissertation/Thesis is brought to you for free and open access by Scholarship@Western. It has been accepted for inclusion in Electronic Thesis and Dissertation Repository by an authorized administrator of
The hybridization of magnetic resonance imaging (MRI) and positron emission tomography
(PET) provides the benefit of soft-tissue contrast and specific molecular information in a
simultaneous acquisition. The applications of PET-MRI in radiotherapy are only starting to
be realised. However, quantitative accuracy of PET relies on accurate attenuation correction
(AC) of, not only the patient anatomy but also MRI hardware and current methods, which are
prone to artefacts caused by dense materials. Quantitative accuracy of PET also relies on full
characterization of patient motion during the scan. The simultaneity of PET-MRI makes it
especially suited for motion correction. However, quality assurance (QA) procedures for
such corrections are lacking. Therefore, a dynamic phantom that is PET and MR compatible
is required. Additionally, respiratory motion characterization is needed for conformal
radiotherapy of lung. 4D-CT can provide 3D motion characterization but suffers from poor
soft-tissue contrast. In this thesis, I examine these problems, and present solutions in the
form of improved MR-hardware AC techniques, a PET/MRI/CT-compatible tumour
respiratory motion phantom for QA measurements, and a retrospective 4D-PET-MRI
technique to characterise respiratory motion.
Chapter 2 presents two techniques to improve upon current AC methods that use a
standard helical CT scan for MRI hardware in PET-MRI. One technique uses a dual-energy
computed tomography (DECT) scan to construct virtual monoenergetic image volumes and
the other uses a tomotherapy linear accelerator to create CT images at megavoltage energies
(1.0 MV) of the RF coil. The DECT-based technique reduced artefacts in the images
translating to improved μ-maps. The MVCT-based technique provided further improvements in artefact reduction, resulting in artefact free μ-maps. This led to more AC of the breast
coil.
In chapter 3, I present a PET-MR-CT motion phantom for QA of motion-correction
protocols. This phantom is used to evaluate a clinically available real-time dynamic MR
images and a respiratory-triggered PET-MRI protocol. The results show the protocol to
perform well under motion conditions. Additionally, the phantom provided a good model for
ii
acquisition methods currently available on hybrid PET/MRI systems. This technique is
validated using the motion phantom presented in chapter 3 with three motion profiles. I
conclude that our 4D-PET-MRI technique provides information to characterise tumour
respiratory motion while using a clinically available pulse sequence and PET acquisition
method.
Keywords
Hybrid Imaging, positron emission tomography (PET), magnetic resonance imaging (MRI),
attenuation correction, megavoltage computed tomography (MVCT), dual-energy computed
tomography (DECT), quality assurance (QA), respiratory motion, phantom,
motion-correction, four dimensional positron emission tomography magnetic resonance imaging
iii
Co-Authorship Statement
Chapter 2 of this thesis is adapted from a technical paper submitted to Medical Physics, “Technical Note: Comparison of Megavoltage, Dual-energy, and Single-energy CT-based µ-maps for a 4 Channel Breast Coil in PET/MRI” by J.C. Patrick, R.T. Thompson, A. So, J.
Butler, D. Faul, R.Z. Stodilka, S. Yartsev, F.S. Prato, and S. Gaede. All authors contributed
to the design of the study, the interpretation of the results, and reviewing the manuscript. S.G.
was also the principal investigator and oversaw the project. In addition to the above, I
performed all off-line data processing, software programming, data analysis, results analysis,
and wrote the manuscript.
Chapter 3 is also adapted from an original research article submitted for publication
to The Journal of Nuclear Medicine. The article is entitled, “Accuracy and Sensitivity of Respiratory-Triggered PET-MRI Evaluated Using a Multi-Modality Motion Phantom”, by
J.C. Patrick, M.A. Tavallaei, H. Biernaski, R.T. Thompson, R.Z. Stodilka, M. Drangova, S.
Gaede. All authors contributed to the interpretation of the results and reviewing the manuscript. In addition to the above contributions, M.A.T. designed and fabricated motion
stage used in study and assisted in the experimental set-up. H.B. assisted in the experimental
set-up and provided technical assistance with operation of the imaging console. R.Z.S., M.D.,
and S.G. made significant contributions to the design of the study and S.G. was principal
investigator and oversaw the project. I contributed to the design of the study, design and
fabrication of phantom, assisted in experimental set-up and operation, data analysis and
related programming, and wrote the manuscript.
Chapter 4 is also adapted from an original research article to be submitted for publication. The article is entitled, “Description and evaluation of an amplitude-based 4D-PET/MRI protocol to characterize tumour respiratory motion”, by J.C. Patrick, J Thiessen, D.
Capaldi, R.T. Thompson, R.Z. Stodilka, M. Drangova, S. Gaede. All authors contributed to the design of the study, the interpretation of the results, and reviewing the manuscript. S.G.
was also principal investigator and oversaw the project. Additionally, I performed all
off-line data processing and related software programming, analyzed data, and wrote the
iv
Acknowledgments
The pursuit of my Ph.D. has been a challenging journey. As with most journeys in life, it is
the encouragement and guidance of others that help us overcome the challenges and reach
our destination. I am fortunate and very grateful to have been surrounded by people who
have provided both forms of support.
First and foremost, I would like to give a heartfelt thanks to my supervisor Dr.
Stewart Gaede. Thank you, not only for your expert advice and providing me with
opportunities to learn and grow but also for your guidance and words of encouragement in
times when I was very discouraged. You have been a mentor and a friend and I am sincerely
grateful to have had the opportunity to learn from you in aspects both professional and
personal.
I would also like to thank my advisory committee members, Dr. Terry Thompson, Dr.
Robert Stodilka, and Dr. Maria Drangova. Thank-you for the many hours you have all taken
out of your busy schedules to meet with me. Whether it was to advise on experiment design,
my mid-level examination, providing feedback on my thesis, or helping me prepare for my
thesis examination, you were always there to provide insightful critiques and input. You have
all demonstrated a level of professionalism and compassion that I aspire to emulate.
I would like to extend my gratitude to Dr. Frank Prato for his years of
encouragement, and positivity. Regardless of how busy you get, you have always been very
generous with your time and invaluable advice. Thank you! I would also like to thank Dr.
Aaron Ward for his inspiring lessons in pedagogy. You have forever changed my
perspective on the skill of teaching and I hope to continue to learn and improve as I move
forward in my career. To Dr. Jerry Battista, thank you for the many insightful discussions.
Your ability to find the perfect analogy to make complicated subjects more intuitive has
brought clarity to many topics.
None of the work within this thesis could have been possible without the skill and
technical knowledge of our PET/MRI medical imaging technologists John Butler and
Heather Biernaski. Thank you! I would also like to thank the administrative staff for their
help with coordinating meetings and managing finances. Barb Barons, Brenda Dubois,
Michele Avon, Shelagh Ross, and Wendy Hough – Thank you for all of the important work
you do to keep the departments running smoothly. Additionally, I would like to thank Jeff
Kempe for his technical support and stimulating lunchtime discussions over the past few
v
Thank you to Dr. Michael Kovacs and Jeff Corsaut of the Nordal cyclotron and PET
radiochemistry facility for providing isotope used in this work. Also, thank you to Dr. David
Faul and Dr. Gerald Moran for providing helpful input and technical guidance, in addition to
Siemens Canada for supplying the four-channel breast coil and E7 tools software package.
Although not directly involved with my thesis work, Dr. Alex Thomas has played an
important role in providing guidance and insight from his many experiences. He has been,
and continues to be, a great mentor and friend. Thank you for your advice, many lessons, and
planting the idea of graduate school in my head. I look forward to many more 'chin-wags'
and scotch-nights.
I would like to thank my lab mates, Matthew Mouawad, Dr. Ilma Xhaferllari, and Dr.
Omar El-Sherif. Much like siblings, we seemed to find a good balance of razzing each other
while always cheering each other on. We have rejoiced in each other’s successes and we
were there to console each other during disappointments. I hope that in the many years to
come, that bond will remain strong. Thank you for the many great memories!
To my brother-in-law, Dr. Eric Sabondjian, you have always been a great friend who
has been generous with both support and advice. As I have continued to follow down the
same career path, you have always been there to offer insight from your experiences. Thank you. You’ll always be a ninja and trailblazer in my books.
To my sister Susan: thank you for always cheering me on, cheering me up, and
looking out for me. To my Dad and Annette: thank you for all of your love and
encouragement. To my Mom: thank you for your unconditional love, support, and unlimited
patience. I love you all!
Lastly, to my wonderful wife Lindsay Patrick, thank you for your love, support, and
patience through all of my graduate studies. Words cannot fully express the gratitude and
vi
Table of Contents
Abstract ... i
Co-Authorship Statement... iii
Acknowledgments... iv
Table of Contents ... vi
List of Tables ... x
List of Figures ... xi
List of Abbreviations ... xvi
Chapter 1 ... 1
1 Introduction ... 1
1.1 Computed Tomography Principles ... 2
1.1.1 CT Artefacts and Reduction Techniques ... 2
1.1.2 Dual-energy Computed Tomography (DECT) ... 10
1.1.3 Megavoltage Computed Tomography (MVCT) ... 11
1.1.4 Iterative Reconstruction (IR) for CT Metal Artefact Reduction ... 13
1.2 MRI Principles ... 13
1.2.1 Magnetic Moment ... 14
1.2.2 Radiofrequency Pulses and Magnetization ... 15
1.2.3 Detection of MR Signal ... 16
1.2.4 MR Relaxation ... 16
1.2.5 Image Acquisition and Spatial-encoding ... 16
1.3 PET Principles ... 19
1.3.1 Quantitative Errors and Correction Techniques ... 22
1.4 Hybrid Imaging ... 29
vii
1.5 Imaging for Radiotherapy Planning ... 32
1.5.1 Motion Management ... 33
1.6 Gaps in knowledge, challenges, questions, and hypothesis ... 37
1.7 Thesis Overview ... 39
1.7.1 A Comparison of Megavoltage, Dual-energy, and Single-energy CT-based µ-maps for a 4 Channel Breast Coil in PET/MRI (Chapter 2) ... 39
1.7.2 Accuracy and sensitivity of respiratory-triggered PET-MRI evaluated using a multi-modality motion platform (Chapter 3) ... 39
1.7.3 Development and evaluation of an amplitude-based 4D-PET/MRI protocol to characterize tumour respiratory motion (Chapter 4) ... 40
1.7.4 Conclusions (Chapter 5) ... 40
1.7.5 References ... 41
Chapter 2 ... 57
2 A Comparison of Megavoltage, Dual-energy, and Single-energy CT-based µ-maps for a 4 Channel Breast Coil in PET/MRI ... 57
2.1 Materials and Methods ... 58
2.1.1 Hybrid PET-MRI System ... 58
2.1.2 Four-channel RF Breast Coil ... 59
2.1.3 Breast Phantoms... 60
2.1.4 Attenuation Correction... 61
2.1.5 PET Acquisition ... 65
2.2 Results ... 67
2.3 Discussion ... 72
2.4 Conclusions ... 75
2.5 References ... 75
viii
Multi-modality Motion Platform... 78
3.1 Materials and Methods ... 79
3.1.1 Phantom Design ... 79
3.1.2 Motion Stage ... 80
3.1.3 Experimental Setup ... 81
3.1.4 Imaging ... 84
3.1.5 Data Analysis ... 86
3.2 Results ... 87
3.2.1 Motion-induced MRI Errors ... 88
3.2.2 Motion-induced PET Errors ... 89
3.2.3 PET-MRI Alignment Errors ... 91
3.3 Discussion ... 92
3.4 Conclusions ... 95
3.5 References ... 95
Chapter 4 ... 100
4 Description and evaluation of an amplitude-based 4D-PET/MRI protocol to characterize tumour respiratory motion ... 100
4.1 Material and Methods ... 101
4.1.1 Motion Phantom Study ... 101
4.1.2 Hybrid PET-MR System ... 104
4.1.3 4D-PET-MRI Technique ... 105
4.1.4 Data analysis ... 108
4.2 Results ... 109
4.3 Discussion ... 117
4.4 Conclusions ... 119
ix
5 Conclusions and Future Work ... 125
5.1 Techniques to Improve Accuracy of MRI Hardware Attenuation Maps in PET-MRI ... 125
5.2 Development of a PET/MRI/CT-Compatible Tumour Respiratory Motion Phantom for Quality Assurance ... 126
5.3 Development of a 4D PET-MRI Protocol to Characterize Respiratory Motion . 127 5.4 Conclusions ... 129
5.5 Future Work ... 130
5.5.1 MVCT-based μ-maps for Additional Hardware Components ... 130
5.5.2 Development of Routine Quality Assurance Procedures... 131
5.5.3 Further Improvements to 4D-PET-MRI Technique ... 131
5.6 References ... 132
x
List of Tables
Table 2-1: Summary of reconstruction scenarios carried out to evaluate both the attenuation
of the breast coil and the three proposed CT-based methods to correct for MR hardware
attenuation. ... 66
Table 2-2: Mean and standard deviation of the percent activity difference calculated between
the reference standard (PET_REF) and each of the four AC scenarios (PET_NAC,
PET_SECT, PET_DECT, and PET_MVCT) performed on PET data collected in the
presence of the breast coil. ... 72
Table 3-1: Summary of imaging and motion magnitudes evaluated ... 85
Table 3-2: Sphere diameter measurements in respiratory-triggered BLADE-TSE images.
Measurements were taken in the direction of motion (S/I) and orthogonal to direction of
motion (L/R) in static images and in images acquired during 1.5 cm and 3.0 cm of motion. 89
Table 4-1: Pearson correlation coefficient values between measured centroid displacement
xi
List of Figures
Figure 1-1: Ring artefact in a pelvic CT. Image was adapted from Boas et al. (2012).5 ... 3
Figure 1-2: Reconstruction-based artefacts. A) Windmill artefact streaks around
cholecystectomy clips. Image adapted from Boas et al. (2012),5 B) Cone beam artefacts shown around a Teflon rod positioned with a 70 mm offset form scanner isocenter, C) Stair
step artefact in a sagittal reformatted image from an axial CT with 5 mm collimation and
reconstruction interval, D) Zebra artefacts shown in a maximum intensity project image from
a thoracic helical CT. Images for B-D adapted from Barrett et al. (2004).6 ... 5
Figure 1-3: Patient-based artefacts. A) Streaking artefact in CT from incomplete projections
caused by patient’s arms being placed at their side but outside the FoV. B) Motion artefact
caused by respiration during CT scan. Images adapted from Barrett et al. (2004).6 ... 6
Figure 1-4: A) Streaking artefacts caused by photon starvation in CT of shoulder phantom,
B) Arrow pointing to aliasing caused by undersampling in CT of Teflon block phantom in
water. Images adapted from Barrett et al. (2004).6 ... 8
Figure 1-5: Physics-based artefacts. A) Cupping artefact due to beam hardening in CT image
of cylindrical uniform water phantom. Adapted from Barrett et al. (2004),6 B) Streaking due to beam hardening in CT image of hip replacements. Adapted from Boas et al. (2012).5 ... 9
Figure 1-6: Dual-energy CT source configurations. A) Single tube configurations rapidly
switch between low and high voltages, B) Dual-source CT configurations use two separate
x-ray tubes, operating at different voltages to achieve dual-energy imaging. ... 10
Figure 1-7: Plot showing linear relationship between the electron densities of various
high-density materials and their respective CT numbers from MVCT images. Adapted from
Rogers et al. (2005).24 ... 12
Figure 1-8: Axial images of an anaplastic medulloblastoma in A) noncontrast CT, B)
T2-weighted MRI, C) T1-T2-weighted MRI, and D) contrast-enhanced T1-T2-weighted MRI. Adapted
xii
directions, A) x-gradient coils, B) y-gradient coils, C) z-gradient coils, and D) all three sets
of coils. ... 17
Figure 1-10: A gradient echo pulse sequence diagram. The horizontal axis shows the timing
of basic hardware activity as they are incorporated into the pulse sequence. ... 19
Figure 1-11: A typical arrangement of detector blocks in a PET scanner. Inset upper left
corner, is an example of a detector block configuration with scintillator crystal and PMTs.
Inset bottom right corner, shows the beta + decay of a radioactive isotope, the path of the
emitted positron, and its annihilation with an electron, which results in the emission of two
gamma photons. ... 20
Figure 1-12: A 'true' coincidence event. The line-of-response connecting the two coincidence
events correctly reflects the location of the positron annihilation. ... 22
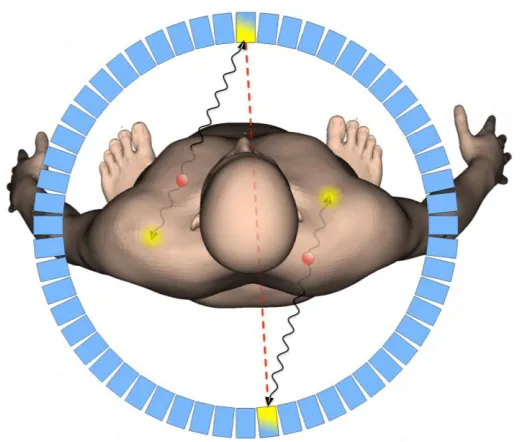
Figure 1-13: A 'random' coincidence event, resulting in a line-of-response (red dotted line)
for a non-existent annihilation, while failing to account for the two actual annihilations. This
false line-of-response contributes incorrect positional information to the image data. ... 24
Figure 1-14: A 'scattered' coincidence event. The scattered gamma-photon provides incorrect
positional information for the positron annihilation event. ... 26
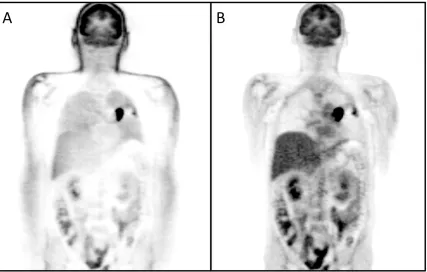
Figure 1-15: A comparison of two reconstructions of the same PET data. A) Image
reconstruction without correction for photon attenuation from patient tissues, B) Image
Reconstruction with CT-based attenuation correction. ... 27
Figure 2-1: The MR-BI320-PA four-channel breast coil assembly with 2-channel pad coil on
top and 2-channel insert plate coil, located in the lower part of the all fiberglass frame. ... 60
Figure 2-2: Experimental setups. (A) Setup for acquisition in the presence of the RF breast
coil with two breast phantoms positioned within the coil using a polystyrene rigid foam
fixture made in- house. (B) Setup for acquisition without the breast coil present. A replica
of the breast coil base was made to position the breast phantoms identical to their position
xiii
with eight tissue-simulating plugs and three plugs made in-house: A) aluminum, B) copper,
and C) stainless steel. ... 64
Figure 2-4: Axial, coronal, and sagittal views of a µ-map composed of manufacturer’s table
µ-map, the SECT-based breast coil µ-map, and the phantom µ-map fused into a single
volume... 66
Figure 2-5: ROIs used to calculate relative percent difference images. (A) Axial view of
breast phantom with ROIs. (B) Coronal view of breast phantom showing the range of
transverse slices (49 – 75) used for plotting each ROI. ... 67
Figure 2-6: Breast phantom PET images in axial, coronal, and sagittal views for each
reconstruction scenario. (A) Breast phantom only (PET_REF). (B) Breast phantom and
breast coil without coil AC (PET_NAC). (C) Breast phantom with breast coil and
SECT-based coil AC (PET_SECT). (D) Breast phantom with breast coil and DECT-SECT-based coil AC
(PET_DECT). (E) Breast phantom with breast coil and MVCT-based coil AC. ... 69
Figure 2-7: Relative difference of PET images measured in percent. (A) Relative difference
between the reference standard (PET_REF) and with the breast coil but without coil AC
(PET_NAC). (B) Relative difference between PET_REF and with breast coil and
SECT-based AC. (C) Relative difference between PET_REF and with breast coil and DECT-SECT-based
AC (PET_DECT). (D) Relative difference between PET_REF and with breast coil and
MVCT-based AC (PET_MVCT). ... 70
Figure 2-8: ROI comparison of relative percent difference images. Plots show the relative
percent difference between mean ROI values for PET_REF vs. (A) PET_NAC, (B)
PET_SECT, (C) PET_DECT, and (D) PET_MVCT. ... 71
Figure 2-9: A comparison of high-density components in three different µ-maps. The
SECT-based µ-map is shown in (A) Axial, (B) Sagittal, and (C) Coronal views. Dotted lines
represent intersecting planes shown in frames outlined in matching color. A close-up of high
density components in the breast coil (green rectangle in frame A) are shown in the (D)
xiv
respiratory bellows and a foam block were attached adjacent the motion stage carriage to
provide a trigger for the MRI scans. In the configuration shown four lesion compartments
were imaged simultaneously as they underwent S/I motion. All materials are MRI
compatible. ... 82
Figure 3-2: Simulated breathing waveforms for 1.5 cm peak-to-peak motion and 3.0 cm
peak-to-peak motion. ... 83
Figure 3-3: Comparison of expected and measured centroid displacements for 28 and 10 mm
diameter lesion compartment during a) 1.5 cm peak motion; and b) 3.0 cm
peak-to-peak motion in real-time TrueFISP MR images. ... 88
Figure 3-4: (a) Mean voxel intensity of each sphere diameter in PET images during static, 1.5
cm, and 3.0 cm (S/I) motion. Error bars represent the standard deviations. (b) Maximum
voxel intensity within in each sphere during each of the three cases. (c) Contrast-to-Noise
ratios for each of sphere and motion magnitudes. (d) Segmented volumes for each sphere
diameter and motion. ... 90
Figure 3-5: Coronal images of (a) PET, (b) MRI, and (c) fused PET-MR of the phantom
without motion (static) are shown above. Similarly, coronal images taken from a gated PET
with respiratory-triggered BLADE-TSE MRI acquisition during simulated respiratory motion
of the lesion compartments with a magnitude of 1.5 cm in the S/I direction are shown in (d)
and (e) respectively, and for 3.0 cm of S/I motion are shown in (g) and (h). Fused image of
(d) and (e) is shown in (f), and fusion of (g) and (h) can be seen (i). ... 92
Figure 4-1: Side (a), and top (b) views of the experimental setup. The respiratory bellows
and a foam block were attached adjacent the motion stage carriage to provide a trigger for the
MRI scans. In the configuration shown four lesion compartments were imaged
simultaneously as they underwent S/I motion. All materials are MRI compatible. ... 102
Figure 4-2: Respiratory motion profiles for A) RMP-Pat1, B) RMP-Pat2, and C) RMP-Sim.
xv
MRI from dynamic 2D images, B) Calculation of 4D-μ-map, and C) 4D-PET construction.
... 108
Figure 4-4: Five frames of 4D-PET/MRI: Sagittal view of A) amplitude-sorted 4D-MRI, B)
corresponding 4D-PET volumes, and C) MR-based μ-maps of 28 mm diameter sphere. ... 110
Figure 4-5: Contrast-to-noise-ratios of the 10 mm, 17 mm, 22 mm, and D) 28 mm diameter
spheres for 4D-PET, single gate PET, and ungated PET volumes acquired during RMP-Pat1,
RMP-Pat2, and RMP-Sim motion profiles. ... 111
Figure 4-6: Volume measurements of segmented spheres in PET reconstructions for 10 mm,
17 mm, 22 mm, and 28 mm diameter spheres for 4D, gated, and ungated PET acquired
during RMP-Pat1, RMP-Pat2, and RMP-Sim motion profiles. ... 112
Figure 4-7: Mean voxel intensity of each sphere diameter in PET images Pat1,
RMP-Pat2, and RMP-Sim motion profiles. Error bars represent the standard deviations between
phases of 4D-PET. ... 113
Figure 4-8: RMP-Pat1 centroid measurements in each frame of 4D PET, MRI, and μ-map
volumes for the A) 10 mm diameter sphere, B) 17 mm diameter sphere, C) 22 mm diameter
sphere, and D) 28 mm diameter sphere. ... 114
Figure 4-9: RMP-Pat2 centroid measurements in each frame of 4D PET, MRI, and μ-map
volumes for A) 10 mm, B) 17 mm, C) 22 mm, and D) 28 mm diameter spheres. ... 115
Figure 4-10: RMP-Sim centroid measurements in each frame of 4D PET, MRI, and μ-map
xvi
List of Abbreviations
176Lu 176Lutetium
18F 18Fluorine
18F-FDG 18F-Fluorodeoxyglucose
2D Two-Dimensional
3D Three-Dimensional
4D Four-Dimensional
68Ge 68Germanium
A-P Anterior-Posterior
AC Attenuation Corrected
APD Avalanche Photodiode
B0 Main static magnetic field
BGO Bismuth Germanium Oxide
Bq Becquerel
CNR Contrast-to-Noise Ratio
cps counts per second
CT Computed Tomography
DECT Dual-Energy Computed Tomography
DSCT Dual-Source Computed Tomography
FBP Filtered Back-Projection
FoV Field of View
GFrequency Frequency-encoding gradient
GPhase Phase-encoding gradient
GSlice Slice-encoding gradient
HU Hounsfield Unit
IGRT Image-Guided Radiation Therapy
iPAT integrated Parallel Acquisition Technique
IR Iterative Reconstruction
keV kilo electron Volt
kV kilovoltage
xvii
MeV Mega electron Volt
MnCl2·4H2O Manganese(II) Chloride Tetrahydrate
MRAC Magnetic Resonance Attenuation Correction
MRI Magnetic Resonance Imaging
MV Megavoltage
MVCT Megavoltage Computed Tomography
NAC Non-Attenuation Corrected
NaCl Sodium Chloride
NBAC Narrow Beam Attenuation Coefficient
NEMA National Electrical Manufacturers Association
NSCLC Non-Small Cell Lung Cancer
OP-OSEM Ordinary-Poisson Ordered Subsets Expectation Maximization
PDF Probability Distribution Function
PET Positron Emission Tomography
PMT Photomultiplier Tube
PROPELLER Parallel Lines with Enhanced Reconstruction
PTV Planning Target Volume
PVE Partial Volume Effect
RF Radiofrequency
ROI Region of Interest
RT Radiation Therapy
S-I Superior-Inferior
SECT Single-Energy Computed Tomography
TE Echo Time
TR Repetition Time
TrueFISP True Fast Imaging with Steady-state Precession
TSE Turbo Spin Echo
TurboFLASH Turbo Fast Low Angle Shot
VIBE Volumetric Interpolated Breath-hold Examination
VOI Volume of Interest
xviii
𝛾
𝛾𝐶𝑜−60 Cobalt-60 gamma photon
μ Linear attenuation coefficient
𝜔 Larmor frequency
Chapter 1
1
Introduction
The effectiveness of cancer treatment is increasingly dependent on imaging for diagnosis,
intervention planning, and assessment of treatment response. Among the modalities
commonly used for intervention planning, X-ray Computed Tomography (CT) is the
standard of care and the basis from which nearly all radiotherapy treatments are planned.
Complementary to CT, which provides detailed anatomical information about therapy
targets and surrounding tissues, Positron Emission Tomography (PET) can provide
biological information through the visualization of radiotracer distribution within the
patient. The hybridization of these two modalities as PET-CT has not only become a
powerful tool in cancer detection but also allows for improved target volume definition
when used in radiotherapy planning. Magnetic Resonance Imaging (MRI) has also been
increasingly used in radiotherapy treatment planning due to its superior soft-tissue
contrast, and in recent years, its hybridization with PET has attracted the attention of the
radiation oncology community. As with most new technologies, work with PET-MRI is
an ongoing area of research in an effort to improve, and expand its applications. This
thesis examines several methods to improve the utility of PET-MRI for radiotherapy
treatment planning applications. The work herein includes a description and comparison
of CT-based techniques to correct PET signal attenuation due to the presence of MRI
radiofrequency coils, the development of a PET/MRI/CT-compatible tumour respiratory
motion phantom for use in quality assurance and/or development of protocols designed to
correct or characterize respiratory motion, and lastly, the description and evaluation of a
four-dimensional (4D) PET-MRI technique for the characterization of tumour motion
that can complement 4D-CT based radiation treatment planning. In this first chapter, I
will discuss the principles of each imaging modality used in subsequent chapters, some
of the challenges associated with the hybridization of those modalities including issues
related to attenuation correction, investigate various techniques used to mitigate the
effects of motion during imaging, techniques used to characterize motion, and provide
some motivation behind this work. Finally, I will provide an overview of the thesis
1.1 Computed Tomography Principles
X-ray computed tomography (CT) is a non-invasive high-resolution anatomic imaging
modality that has been commonly used for clinical diagnostic purposes since the early
1970’s. Today it is among the most important imaging technologies for both oncologic
diagnosis and intervention planning. In a technique described by Hounsfield in 1972,
and later by Ambrose in 1973, a CT scanner uses a rotating x-ray source to take
attenuation measurements over a large number of angles to reconstruct a
two-dimensional (2D) cross-sectional image, usually in the transverse plane.1,2 The CT
scanner acquires many of these image sections of a patient, usually in the longitudinal
direction, to construct a three-dimensional (3D) image volume of the patient’s internal
organs. Comprehensive technical descriptions of CT scanners can be found in various
scientific publications and textbooks.3,4
1.1.1
CT Artefacts and Reduction Techniques
In general terms, an image artefact is any feature within an image that is not present in
that actual subject being imaged. In CT, there are many different sources of artefacts, all
of which may mimic or obscure pathology. Fortunately, the mechanisms behind these
artefacts have been studied and methods for avoidance and reduction can be taken to
ensure good quality images. The majority of CT artefacts can be grouped into one of
four categories, based on their source: Hardware-based, reconstruction-based,
patient-based, and physics-based. The next four sub-sections will describe the various artefacts
that can be derived from these sources, the mechanisms behind each of these, and
strategies designed to avoid or reduce their presence in images.
1.1.1.1
Hardware-based Artefacts
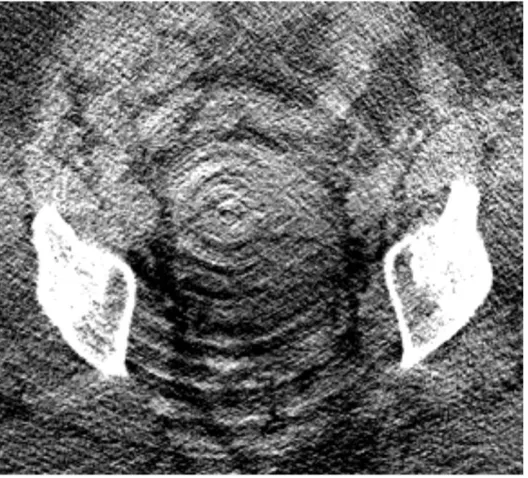
Ring artefacts are characterized by rings of dark or bright voxels centered on the point of
rotation of the CT gantry. This is caused by a defective or uncalibrated detector on a
third generation scanner and is more likely to be visible through a uniform medium like
air or a uniform phantom. Although ring artefacts are less visible against the
heterogeneity of clinical scans, their presence is more likely to negatively impact the
artefacts can be avoided with a calibration scan and adjusting the detector gain to match
the other detectors. In the case where calibrations fail, repairing or replacing the faulty
detector should solve the problem.
Figure 1-1: Ring artefact in a pelvic CT. Image was adapted from Boas et al. (2012).5
1.1.1.2
Reconstruction-based Artefacts
In a helical CT scan, the reconstruction process involves a helical interpolation. In a
single-row detector system, when a high contrast edge falls between two acquired image
slices, the reconstruction algorithm alternates between measurements from a single
acquired row and interpolated values between two acquired rows all while the table is
advancing during the scan. Some projection angles have greater contributions from the
high-density feature, while other angles have more contributions from the low-density
feature. This results in alternating light and dark bands radiating outwards from the
center of the transverse image. If you are to scroll through the image slices, these bands
will appear to rotate, giving them their name ‘windmill artefacts’. In a multi-row detector
CT, this interpolation process can complicate windmill artefacts even further. This is
because there is now the potential for several detector rows to fall on that high contrast
more detector rows cross the high contrast edge during a rotation. Therefore, lowering
the pitch, using a 180-degree versus a 360-degree interpolation, or using thinner
acquisition slices can minimize windmill artefacts.
Cone beam artefacts are also reconstruction-based. As the number of detector
rows acquiring data during a scan increases, as in the case of cone beam, wider
collimation is required. However, the collected data is no longer contained within a flat
plane. Instead, it is contained within the intersecting volume between cones. Features
located further from the central axis experience artefacts that are similar to partial
volume. This increases in detectors located in the outer rows, where x-rays detected
correspond less with their planar location. Although reconstructions will require more
time, using appropriate multi-row detector geometry within a specific cone beam
reconstruction strategy, rather than a standard reconstruction technique, can reduce
resulting artefacts.
Stair step artefacts appear as serrations at the edges of structures on coronal or
sagittal CT images. Although less severe in helical scans, stair step artefacts can occur in
multi-row and 3D reformatted images within non-overlapping reconstruction intervals of
scans using wide collimators. Today’s multi-row CTs have greatly reduced stair step
artefacts due to the thinner sections of data that are acquired.
Another artefact that can result from the helical interpolation process is zebra
artefact. This appears as faint alternating stripes of more or less noise along the
z-direction of the image and is more pronounced along the outer portions of the image as
you move away from the rotation axis of the CT. Again, this type of artefact can be
reduced with thinner sectioned data acquisition. Figure 1-2 highlights the various types
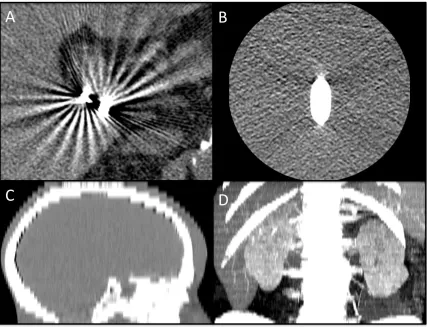
Figure 1-2: Reconstruction-based artefacts. A) Windmill artefact streaks around
cholecystectomy clips. Image adapted from Boas et al. (2012),5 B) Cone beam
artefacts shown around a Teflon rod positioned with a 70 mm offset form scanner
isocenter, C) Stair step artefact in a sagittal reformatted image from an axial CT
with 5 mm collimation and reconstruction interval, D) Zebra artefacts shown in a
maximum intensity projection image from a thoracic helical CT. Images for B-D
adapted from Barrett et al. (2004).6
1.1.1.3
Patient-based Artefacts
Incomplete projections cause shading or streaking artefacts across the transverse plane of
CT images. This patient-based artefact happens when part of the patient lies outside of
the scanner’s field of view (FoV). Incomplete projections can also be caused by highly
attenuating items such as equipment coming in between the beam and detectors of the CT
the FoV or equipment lay in the beam’s path, some scanners are able to detect
inconsistencies in reference data channels to avoid using suspicious reference data.
Some systems are also designed with reference detectors on the tube side (or ray path
within the gantry) to eliminate any interference with reference data.6
Patient motion is another potential source of artefact in CT. Some patient motion
can be avoided through shortened scan times, immobilization devices, and in some cases
sedation. However, some motion is involuntary and cannot be avoided during a scan.
This results in slice misregistration artefacts appearing as streaks or shading throughout
the image. Some CT scanners have built-in motion artefact reduction features. Some of
these features involve either scanning more than 360 degrees of a bed position or
excluding some of the CT projections from the reconstruction to either average out the
motion or exclude projections with the maximum discrepancy respectively. Some
systems also make use of gating to capture a single phase of the cardiac or respiratory
cycle. I will explore more of these motion management methods in the context of
radiotherapy planning in section 1.5.1.1. Figure 1-3 highlights examples of patient-based
CT artefacts.
Figure 1-3: Patient-based artefacts. A) Streaking artefact in CT from incomplete
projections caused by patient’s arms being placed at their side but outside the FoV.
B) Motion artefact caused by respiration during CT scan. Images adapted from
It is not uncommon for a patient to have metal on or inside of them. Whether in
the form of an aneurism clip, artificial joint or dental implant, metal produces artefacts in
CT images that appear as bright and dark streaks projecting outward from the metal
object. This is caused by the metal’s density, which lay outside of the normal range that
the CT system was designed to calculate. In some cases, metal can be removed from the
FoV, and some scanners are equipped with metal artefact reduction software.7 This
software may reduce or remove the streaks associated with metal but often at the cost of
losing detail locally. Even though metal artefacts can often be considered a patient-based
problem, the mechanisms by which they occur are physics-based. I examine some of
these mechanisms of metal artefact in more detail in the following section, 1.1.1.4.
1.1.1.4
Physics-based Artefacts
Aside from the averaging of CT number values of materials within a single voxel, partial
volume effect can result in shading artefacts caused by inconsistencies between detector
views. This happens when an object lies within the beam at one point of rotation, but
outside of the beam at the opposite point of rotation. Fortunately, this type of artefact
can be avoided by acquiring with thin acquisition sections.
Photon starvation occurs in highly attenuating regions within a patient’s body or
with certain dense materials. The inadequate number of photons making their way
through the object to the detectors causes noisy projections, making streaks in the
images. Increasing the tube current can minimize this particular artefact. However, a
consequence of increasing tube current is an increased patient dose from the x-ray beam.
To avoid increasing current, some CTs are capable of automatically varying the tube
current in a process called milliamperage modulation. Another method to reduce
artefacts from photon starvation is through adaptive filtration. Here software is used to
smooth attenuation profiles in areas that are highly attenuated prior to image
reconstruction.
Another physics-based artefact can result from undersampling. This can happen
when intervals between projections are too large, causing view aliasing appearing as thin
aliasing, which appears as stripes that are close to the object being imaged. View
aliasing can be resolved by increasing the number of projections per rotation and ray
aliasing can be resolved by increasing resolution through methods like quarter-detector
shift or flying focal spot. Figure 1-4 highlights streaking artefacts and aliasing in CT.
Figure 1-4: A) Streaking artefacts caused by photon starvation in CT of shoulder
phantom, B) Arrow pointing to aliasing caused by undersampling in CT of Teflon
block phantom in water. Images adapted from Barrett et al. (2004).6
The final type of physics-based artefact I will discuss happens as a beam passes
through a medium and lower energy photons are absorbed more readily than higher
energy photons. This causes the mean beam energy to increase, in other words get
‘harder’. This causes cupping artefacts and/or dark streaks to appear to be projecting
from dense objects, which can be seen in Figure 1-5. Cupping can occur in objects with
rounded cross-sectional profiles. The edge of the object will often have a higher CT
number than the middle of the object, even when it may be composed of homogenous
material. This is now typically corrected with a simple beam hardening correction,
commonly built into current CT systems. Streaking artefacts from beam hardening can
occur in bone, contrast medium, or in other highly attenuating materials. This can be
improved with the use of filtration, calibration correction, or beam hardening correction
software. Filtration is used to harden the beam prior to it passing through the object of
interest. This is often accomplished with a metallic filter. Bow tie filters can also be
patient. Calibration correction is used to determine an appropriate compensation for
anatomy specific scans. Beam hardening correction software uses an iterative approach
to reduce dark bands and blurring in soft-tissue/bone interfaces. This is primarily used
when imaging bony anatomy. However, the above strategies are often insufficient when
attempting to correct for materials with much higher electron densities like metals. One
method to reduce the effects of beam hardening from materials with densities greater
than bone is by scanning with two different energy spectra, using a dual energy CT
(DECT) scanner. Information taken from the two energy spectra can be used to calculate
virtual monochromatic images of the subject, which have substantially reduced
beam-hardening artefacts. Another method of reducing the effects of beam beam-hardening from
materials with densities greater than bone is to make the beam itself harder, or in other
words, scan at higher energies. These higher energy photons are less likely to be
absorbed by high atomic number objects, resulting in reduced artefacts. A third method
to reduce streaking artefacts in CT, caused by high-density materials is iterative
reconstruction. I explore both DECT and imaging with higher energy x-rays in the
following two sections, followed by a very brief section on the use of iterative
reconstruction techniques for metal artefact reduction in CT.
Figure 1-5: Physics-based artefacts. A) Cupping artefact due to beam hardening in
CT image of cylindrical uniform water phantom. Adapted from Barrett et al.
(2004),6 B) Streaking due to beam hardening in CT image of hip replacements.
1.1.2
Dual-energy Computed Tomography (DECT)
DECT uses two different photon energy spectra, each composed of a bremsstrahlung
spectra and characteristic peaks of target materials, with maximum photon energy being
determined by the x-ray tube voltage. Although dual-energy images can be acquired
sequentially, by either taking two separate helical scans at different voltages or single
rotations at alternating tube voltages, several manufacturers have taken various design
approaches to achieving DECT in a timelier and less motion artefact prone way. Some
systems use a single x-ray tube and achieve two different energy spectra by quickly
switching between low and high voltages.8-10 Another approach often referred to as
dual-source CT (DSCT), involves a CT gantry equipped with two detector arrays and two
x-ray tubes operating at two different voltages.11,12 To minimize the amount of spectral
overlap when using standard x-ray tubes, 80 and 140 keV are the most commonly used
energies in DECT. In DSCT scanners, this spectral overlap can be further minimized
with the use of tin filters. Figure 1-6 characterizes DECT and DSCT.
Figure 1-6: Dual-energy CT source configurations. A) Single tube configurations
rapidly switch between low and high voltages, B) Dual-source CT configurations
use two separate x-ray tubes, operating at different voltages to achieve dual-energy
Data acquired at two different tube potentials allows us to extract various forms
of spectral information, depending on the type of post-processing used. The most
common approach is to first reconstruct the CT images from each energy dataset.
Spectral information can then be extracted based on differences calculated from the two
image sets. There are mainly three types of information that are extracted with these
image-based algorithms: material differentiation, material quantification, and image
optimization.
Algorithms used to differentiate specific materials like calcium and magnesium
from uric-acid, as in the case of locating kidney stones, are based on the photoelectric
effect within specific density ranges. Here, a slope is defined between density values at
each spectra and a different colour is assigned to either side of the slope.14-16
Quantifying a substance, such as contrast medium, within an image volume can
also be calculated. This can be achieved using an algorithm called ‘three material
decomposition’. Density measurements can be interpreted as a value’s displacement
from normal tissue densities in relation to values defined by the photoelectric effect of
the contrast material used.17-19
The third type of post-processing algorithm is used for image optimization. One
type of image optimization is called nonlinear blending. This algorithm creates an
optimum contrast image by combining high iodine contrast with low noise.20 Another
image optimization algorithm is able to calculate virtual monoenergetic image volumes
from the manipulation of either projection data21 or image data22 from each of the two
energy spectrums. This technique is particularly useful for reducing beam-hardening
artefacts in images containing materials with higher electron densities like iodinated
contrast agents.23
1.1.3
Megavoltage Computed Tomography (MVCT)
As mentioned previously, one method of reducing CT artefacts produced from
high-density materials is to make the beam itself harder, or in other words increase the average
emitted from Cobalt-60 source (𝛾𝐶𝑜−60 = 1.25 MeV) and a linear accelerator (linac)
(mean x-ray = 1.3 MeV) are not as susceptible to absorption through photoelectric effect.
Instead, photons at megavoltage energies are more likely to interact with high-density
material through Compton scattering, providing better photon penetration. This results in
images that are less artefact prone than images produced in the kilovoltage energy
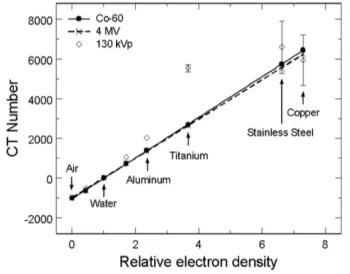
range.24 It was also noted that MVCT images show a linear relationship between the
Hounsfield values of the imaging volumes and the electron densities of the corresponding
materials in those volumes (Figure 1-7).25
Figure 1-7: Plot showing linear relationship between the electron densities of
various high-density materials and their respective CT numbers from MVCT
images. Adapted from Rogers et al. (2005).25
A helical tomotherapy unit (Accuray Inc., Sunnyvale, CA) has a 6 MV linac
mounted opposite to a detector array, on a ring gantry. The ring gantry assembly rotates
continuously while the patient couch translates through the gantry. Work done by
1.1.4
Iterative Reconstruction (IR) for CT Metal Artefact Reduction
High-density materials, such as metals, cause a lack of projection data due to high photon
absorption, particularly of the lower energy photons in the x-ray spectrum.27-30 This
produces a corrupted sinogram, which is missing data. The common CT reconstruction
technique is an analytical algorithm called filtered back-projection (FBP). FBP is not
designed to account for these inconsistencies in the data. Several algorithms have been
proposed to reduce these streaking artefacts caused by metal, and have had limited
success.27-31 These methods attempt to repair the corrupted sinogram data through
replacing with intact data or a linear interpolation through the corrupt region.
Interestingly, iterative reconstruction (IR) algorithms have been around for many
years in CT but due to the higher computational demands of IR compared to analytical
methods like FBP, were abandoned when the volume of data increased. More recently,
the availability of powerful computing resources has helped bring about renewed interest
in IR techniques for quality improvement of CT images,32-34 dose reduction, and artefact
reduction.35,36 IR techniques inherently perform better at metal artefact reduction than
analytical techniques because IR methods approach a solution to fit the data that was
measured, whereas FBP assumes the measured data is complete and exact. This
assumption cannot be made when imaging in the presence of metal. However, due to
limited clinical availability, IR is seldom used.
1.2 MRI Principles
Despite the widely adopted applications of CT, MRI provides much greater soft-tissue
contrast. MRI allows tissues to be imaged with a wide variety of contrast mechanisms,
from both endogenous tissue properties and exogenous contrast mediums. Figure 1-8
highlights the superior soft-tissue contrast of MRI over CT, using three different contrast
mechanisms. The differences in CT and MR images arise from the different contrast
mechanisms they use. Where CT images are based solely on electron densities, MR
images are based on subtle changes in magnetic relaxation within tissues. More
specifically, MRI most often relies on the signal derived from hydrogen nuclei (protons)
basic principles of how these interactions are used to create images are discussed in the
subsequent six sections.
Figure 1-8: Axial images of an anaplastic medulloblastoma in A) noncontrast CT,
B) T2-weighted MRI, C) T1-weighted MRI, and D) contrast-enhanced T1-weighted
MRI. Adapted from Eran et al. (2010).37
1.2.1
Magnetic Moment
Hydrogen protons are frequently used as the basis for MR images because of their
abundance in tissues and their strong magnetic moment. For simplicity, I will describe
the motion of these magnetic moments using classical mechanics. The strong magnetic
moment is due to the spin of this positively charged particle, the proton. The strength of
an internal axis. At this level, each proton acts like a very small magnetic bar with a
north and south-pole. Ordinarily, the magnetic moments of protons in tissues are
oriented in random directions. The result is no net magnetization. However, when a
strong external magnetic field is applied the protons will begin to precess about the
direction of the applied external magnetic field in either a parallel or antiparallel state.
These states only refer to the longitudinal components of a proton’s magnetic moment
and the relative proportion of each state is dependent upon the magnitude of the applied
external magnetic field. The Larmor frequency, or in other words the frequency with
which the protons precess is directly proportional to the strength of the external magnetic
field according to the equation,
𝜔 = 𝛾Β0, (1)
where 𝛾 is the gyromagnetic ratio, which is equal to 42.576 MHz/Tesla for hydrogen
protons, and Β0 is the strength of the external magnetic field. Thus, in a 3 Tesla
magnetic field the precession frequency of hydrogen protons will be ≈ 128 MHz.
The total magnetization from all proton magnetic moments within tissues can be
represented as a simple vector that has only a net longitudinal component.
1.2.2
Radiofrequency Pulses and Magnetization
The detection of MRI signal is made possible by exploiting the resonant absorption and
dissipation of energy. The resonant absorption of energy is achieved through the
transmission of RF electromagnetic field pulses or excitation pulses. The frequency of this RF field pulse must be identical to the precession frequency of the protons, which is
calculated using the Larmor formula, shown as equation 1 in section 1.2.1. The RF field
causes the net magnetization to rotate into the transverse plane and away from the
longitudinal direction of the main external magnetic field. The strength and duration of
1.2.3
Detection of MR Signal
This transverse component of the magnetic precession is responsible for the detectable
signal, which is captured by the MRI receiver coils. The MRI receiver coils are
essentially a pair of electrically conductive loops that are placed within close proximity
to the patient and behave as the ‘antenna’ of the MRI system. A voltage is induced in the
receiver coils as the protons in the patient’s tissues relax from their transverse
magnetization back to their equilibrium state along the direction of the main magnetic
field.
1.2.4
MR Relaxation
The equilibrium state of protons while in the main magnetic field has only a net
longitudinal component. In this state, the net transverse component is equal to zero.
When the RF pulse is applied, the energy added to the protons’ spin states pushes it out
of equilibrium, increasing the transverse component of magnetization. When the RF
pulse is stopped, their spins relax back to their equilibrium state through the gradual
decay of the transverse component. MR relaxation is the combination of two different
mechanisms, the recovery of the longitudinal magnetization (T1) and the decay of the
transverse magnetization (T2) caused by the dephasing of spins. These T1- and T2
-relaxation times differ between tissues types, both healthy and diseased. It is these
differences that form the basis for contrast in MR images.
1.2.5
Image Acquisition and Spatial-encoding
As mentioned in section 1.2.2, the resonant absorption of energy is achieved through the
transmission of RF pulses at a frequency that is equal to the precession frequency of the
protons in the subject being imaged. When a patient is placed within the main magnetic
field, every proton within the patient’s tissues that lay within the MRI’s field of view has
the same precession frequency. As such, there is no spatial information about the signals
being received during the protons’ relaxation.
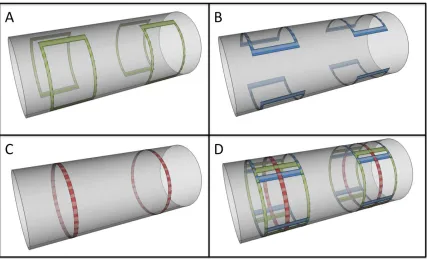
Gradient coils are used to spatially-encode these signals through the application
magnetic field (Figure 1-9). The dynamic application of these spatially varying magnetic
fields is made possible by three sets of gradient coils, each corresponding to one of the
main orthogonal directions. Gradient coils are designed to produce a linear spatial
variation of the magnetic field, which in turn creates spatial variation of resonant
frequencies. Each of the magnetic field gradients is positioned such that there is no
additional contribution to the main field at the isocenter (x=0, y=0, z=0). Here, the
x-axis represents the left/right direction, y-x-axis the anterior/posterior direction, and z-x-axis
the superior/inferior direction. Gradient coils and the magnetic field gradients they
create help to facilitate the three major processes of forming an image dataset. These
processes are slice selection, phase-encoding, and frequency-encoding.
Figure 1-9: Simplified configuration of gradient coils for the three main orthogonal
directions, A) x-gradient coils, B) y-gradient coils, C) z-gradient coils, and D) all
three sets of coils.
Slice selection is the process of selectively exciting protons that lie within a
desired slice of a sample/patient. Selective excitation is achieved by applying a gradient
applied with a frequency that matches the precession frequency of the protons in the
desired slice. The precession frequency of this slice (𝜔𝑆𝑙𝑖𝑐𝑒) is given by:
𝜔𝑆𝑙𝑖𝑐𝑒 = 𝛾(𝐵0 + 𝑧𝐺𝑆𝑙𝑖𝑐𝑒) , (2)
where 𝐺𝑆𝑙𝑖𝑐𝑒 is the strength of the gradient magnetic field at the position 𝑧 of our slice.
Within this slice, the two remaining spatial axes can be encoded by using phase-encoding
and frequency-encoding.
The process of phase-encoding requires the application of a second linear
gradient magnetic field along one of the two remaining directions within the slice plane
after the excitation pulse. This phase-encoding gradient (GPhase) is applied only briefly,
causing a spatially dependent phase shift along the direction of the applied gradient. A
different intensity phase-encoding gradient must be applied after each excitation pulse
and a separate excitation pulse must be applied for each row of voxels in the
phase-encoding direction. To ensure an adequate amount of longitudinal relaxation occurs
between excitation pulses, a delay called the repetition time (TR) is included. The TR
multiplied by the number of phase-encoding steps defines the total time needed to
acquire an image.
The final spatial dimension is encoded by applying a third linear gradient
magnetic field while acquiring data. Similar to how the slice selection gradient creates a
spatially dependent variation of proton precession frequencies during excitation, the
frequency-encoding gradient (GFrequency) creates a spatially dependent variation of proton
precession frequencies in the frequency-encode direction while receiving the RF signal.
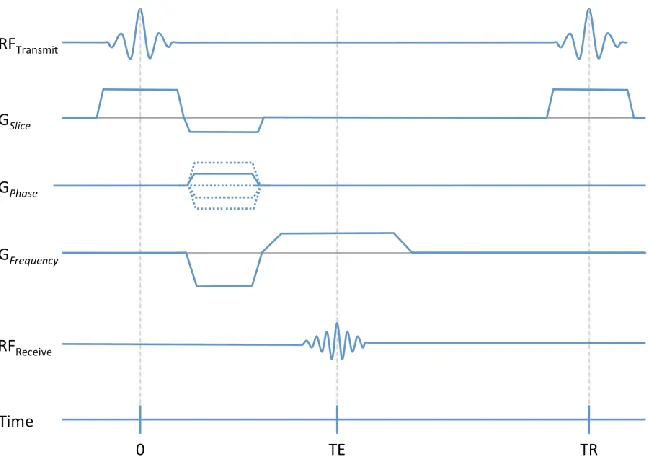
A simple pulse diagram of a gradient echo sequence shows each of the
above-described events in relation to each other over time (Figure 1-10). The sequence of RF
excitation pulses and magnetic field gradients combine to produce an image where each
voxel can be characterized by a specific phase and frequency within the selectively
Figure 1-10: A gradient echo pulse sequence diagram. The horizontal axis shows the
timing of basic hardware activity as they are incorporated into the pulse sequence.
To reconstruct a 2D image from of the selected slice, a Fourier transform is used
to convert the frequency-encoded data into frequency projects. Those frequency
projections are then converted into the final 2D image by applying second Fourier
transform.
1.3 PET Principles
Positron emission tomography (PET) is a nuclear medicine, molecular imaging technique
used to track and quantify the distribution of molecular processes in the body. This is
achieved by injecting a positron-emitting radioactive tracer into a patient. Tracers are
often designed to have specific biological interactions, which influence the distribution of
the tracer throughout the body. For example, 18F-fluorodeoxyglucose (18F-FDG) is a
tracer in the form of a glucose analogue. 18F-FDG can be used to image the distribution
of tissue metabolism throughout a patient’s body based on its correlation with glucose
uptake. This tracer is most commonly used for cancer imaging. The hypermetabolic
properties of cancer cells cause 18F-FDG to accumulate in tumours. The positrons
emitted from PET tracers annihilate with electrons within the patient’s tissues. Each of
directions and it is these gamma-photons that are detected by the PET scanner.38 One of
the main strengths of PET is its sensitivity. Although PET typically measures
radiotracers in nanomolar concentrations, it is possible to measure radiotracers present in
picomoles.39
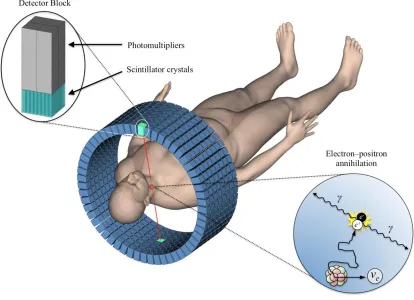
A PET scanner has detector blocks that are designed to detect these 511keV
photons. Each detector block consists of an inorganic scintillator crystal attached to an
array of photomultiplier tubes (PMTs). Circular arrays or axially stacked rings of
detector blocks within the PET scanner face inwards to surround an imaging volume (see
Figure 1-11).
Figure 1-11: A typical arrangement of detector blocks in a PET scanner. Inset
upper left corner, is an example of a detector block configuration with scintillator
crystal and PMTs. Inset bottom right corner, shows the beta+ decay of a
radioactive isotope, the path of the emitted positron, and its annihilation with an
The scintillator crystal of the detector block absorbs the gamma-photons and
through the photoelectric process converts them in an optical fluorescent signal. This
signal can then be detected by the PMT and translated into an electrical signal. Prior to
the 1990’s, a commonly used scintillator was Bismuth Germanium Oxide (BGO) due to
its good characteristics for 511 keV gamma-photon detection. However, the superior
count rate capability of lutetium oxyorthosilicate (LSO) has made it the scintillator of
choice today, despite it featuring a decay of natural 176Lu itself.
A square array of PMTs is attached to the back of the scintillator crystal. A PMT
is a vacuum tube, containing a photocathode, a series of dynodes, and an anode. It
allows weak light signals in the ultraviolet to near-infrared range to be detected. When
gamma-photons strike the scintillator crystal, all PMTs simultaneously detect the same
flash of light to varying degrees, depending on their position relative to the individual
event. The photons emitted from the scintillator strike the photocathode in each of the
PMTs. When this happens the photocathode ejects electrons. These electrons are
multiplied millions of times through series of dynodes, allowing for the detection of even
individual photons. The arrangement of PMTs of the detector block in combination with
accompanying circuitry, allows the system to locate what region of the scintillator
absorbed the photon by detecting the relative amount of light sensed by the array.
Based on the knowledge that PET radiotracer annihilations simultaneously emit
two 511 keV photons in opposite directions, a PET scanner uses information from
gamma-photons detected in near time-coincidence (using a typical temporal window of 6
to 12 nanoseconds, and as low as 400 picoseconds for ‘time-of-flight’ capable systems
40-42). If two detected events are registered as coincident, it is then possible to locate the
annihilation event from which they originated as lying somewhere along a line joining
the detected events. This line joining detected events is called a line-of-response (LoR).
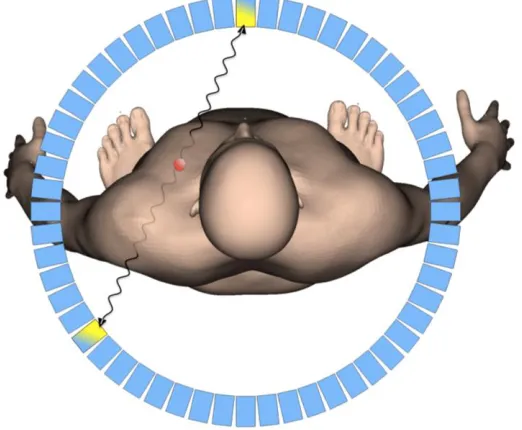
When the LoR correctly represents the paths of the annihilation photons, and thus the
location of the annihilation event, the detected event is called a ‘true coincidence’ event
(see Figure 1-12). A 3D image of radiotracer distribution inside a patient can be
Figure 1-12: A 'true' coincidence event. The line-of-response connecting the two
coincidence events correctly reflects the location of the positron annihilation.13
1.3.1
Quantitative Errors and Correction Techniques
Quantitative measurement of radiotracer distribution in PET imaging is not trivial, as the
physical processes of photon scatter and attenuation, must be factored into the calculation
of spatial location and even the detection of events. Additionally, the PET scanner has
limitations in terms of photon count rate capabilities, and determining the location of
detected events. Each of these processes and limitations must be accounted for during
image reconstruction, and in the following sections I will discuss how this is
accomplished through the use of detector normalization, and corrections for dead time,
random and scattered coincidences, as well as the attenuation gamma-photons.
1.3.1.1
Normalization
The efficiency of gamma-photon conversion into an electrical signal can vary from one
block detector to another. Small variations in scintillator crystal dimensions and
differences in the quality of their optical coupling to the array of PMTs can cause these
differences in efficiency, leading to variations in resolution and sensitivity throughout the
FoV. We can account for these variations by recording the number of counts detected by