Available Online atwww.ijcsmc.com
International Journal of Computer Science and Mobile Computing
A Monthly Journal of Computer Science and Information Technology
ISSN 2320–088X
IJCSMC, Vol. 3, Issue. 11, November 2014, pg.680 – 685
REVIEW ARTICLE
RAMAN SPECTROSCOPY: A REVIEW
Nisha Ahlawat
M.Tech, Banasthali Vidyapith, Rajasthan ernishaahlawat@gmail.com
Abstract: Raman spectroscopy is a spectroscopic technique used to observe vibrational, rotational, and other low-frequency modes in a system. It relies on inelastic scattering, or Raman scattering, of monochromatic light, usually from a laser in the visible, near infrared, or near ultraviolet range. The laser light interacts with molecular vibrations, phonons or other excitations in the system, resulting in the energy of the laser photons being shifted up or down. The shift in energy gives information about the vibrational modes in the system. This paper describes raman spectroscopy, its types and discusses some of its major applications.
Keywords: raman spectroscopy
I. INTRODUCTION
The Raman spectroscopy is based on an inelastic light scattering by molecules (the Raman effect). In the Raman scattering process, a photon interacts momentarily with a molecule and is then scattered into surroundings in all directions. During the brief interaction with molecule, photon loses or gains energy which is then detected and analyzed.
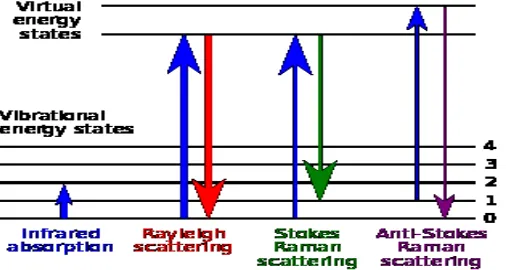
Fig 1. Energy-level diagram showing the states involved in Raman signal.
The Raman effect occurs when electromagnetic radiation impinges on a molecule and interacts with the polarizable electron density and the bonds of the molecule in the phase (solid, liquid or gaseous) and environment in which the molecule finds itself. For the spontaneous Raman effect, which is a form of inelastic light scattering, a photon (electromagnetic radiation of a specific wavelength) excites (interacts with) the molecule in either the ground rovibronic state or an excited rovibronic state. This results in the molecule being in a so-called virtual energy state for a short period of time before an inelastically scattered photon results. The resulting inelastically scattered photon which is "emitted"/"scattered" can be either of higher (anti-Stokes) or lower (Stokes) energy than the incoming photon. In Raman scattering the resulting rovibronic state of the molecule is a different rotational or vibrational state than the one in which the molecule was originally, before interacting with the incoming photon (electromagnetic radiation). The difference in energy between the original rovibronic state and this resulting rovibronic state leads to a shift in the emitted photon's frequency away from the excitation wavelength, the so-called Rayleigh line. The Raman effect is due to inelastic scattering and should not be confused with emission (fluorescence or phosphorescence) where a molecule in an excited electronic state emits a photon of energy and returns to the ground electronic state, in many cases to a vibrationally excited state on the ground electronic state potential energy surface.
II. TYPES OF RAMAN SPECTROSCOPY
There are a number of advanced types of Raman spectroscopy, including surface-enhanced Raman, resonance Raman, tip-enhanced Raman, stimulated Raman (analogous to stimulated emission), transmission Raman, spatially offset Raman, and hyper Raman.
intensities are proportional to the electric field, there is large increase in the measured signal (by up to 1011). This effect was originally observed by Martin Fleischmann but the prevailing explanation was proposed by Van Duyne in 1977.[1]
2. Resonance Raman spectroscopy – The excitation wavelength is matched to an electronic transition of the molecule or crystal, so that vibrational modes associated with the excited electronic state are greatly enhanced. This is useful for studying large molecules such as polypeptides, which might show hundreds of bands in "conventional" Raman spectra. It is also useful for associating normal modes with their observed frequency shifts.[2]
3. Hyper Raman – A non-linear effect in which the vibrational modes interact with the second harmonic of the excitation beam. This requires very high power, but allows the observation of vibrational modes that are normally "silent". It frequently relies on SERS-type enhancement to boost the sensitivity.[3]
4. Tip-enhanced Raman spectroscopy (TERS) – Uses a metallic (usually silver-/gold-coated AFM or STM) tip to enhance the Raman signals of molecules situated in its vicinity. The spatial resolution is approximately the size of the tip apex (20–30 nm). TERS has been shown to have sensitivity down to the single molecule level and holds some promise for bioanalysis applications.[4]
5. Stimulated Raman spectroscopy – A spatially coincident, two color pulse (with polarization either parallel or perpendicular) transfers the population from ground to a rovibrationally excited state, if the difference in energy corresponds to an allowed Raman transition, and if neither frequency corresponds to an electronic resonance. Two photon UV ionization, applied after the population transfer but before relaxation, allows the intra-molecular or inter-molecular Raman spectrum of a gas or inter-molecular cluster (indeed, a given conformation of molecular cluster) to be collected. This is a useful molecular dynamics technique.
6. Transmission Raman – Allows probing of a significant bulk of a turbid material, such as powders, capsules, living tissue, etc. It was largely ignored following investigations in the late 1960s (Schrader and Bergmann, 1967) but was rediscovered in 2006 as a means of rapid assay of pharmaceutical dosage forms. There are also medical diagnostic applications.
7. Spatially offset Raman spectroscopy (SORS) – The Raman scattering beneath an obscuring surface is retrieved from a scaled subtraction of two spectra taken at two spatially offset points.
III. APPLICATIONS
1. Raman spectroscopy is commonly used in chemistry, since vibrational information is specific to the chemical bonds and symmetry of molecules. Therefore, it provides a fingerprint by which the molecule can be identified. For instance, the vibrational frequencies of SiO, Si2O2, and Si3O3 were identified and assigned on the basis of normal coordinate analyses using infrared and Raman spectra.[4] The fingerprint region of organic molecules is in the (wavenumber) range 500–2000 cm−1. Another way that the technique is used is to study changes in chemical bonding, as when a substrate is added to an enzyme.
2. Raman gas analyzers have many practical applications. For instance, they are used in medicine for real-time monitoring of anesthetic and respiratory gas mixtures during surgery. 3. In solid state chemistry and the bio-pharmaceutical industry, Raman spectroscopy can be
used to not only identify (ID) active pharmaceutical ingredients (APIs), but in the case of multiple polymorphic forms, it can also be used to identify the polymorphic form of the API. For example there are 4 different polymorphic forms of the API (aztreonam) in Cayston, a drug marketed by Gilead Sciences for cystic fibrosis[citation needed]. Both infrared and Raman spectroscopy can be used to identify and characterize the API which is used in the formulation of Cayston. In bio-pharmaceutical formulations, one must use not only the correct molecule, but the correct polymorphic form, as different polymorphic forms have different physical properties, for example, solubility, melting point, and Raman/infrared spectra.
4. In solid-state physics, spontaneous Raman spectroscopy is used to, among other things, characterize materials, measure temperature, and find the crystallographic orientation of a sample. As with single molecules, a given solid material has characteristic phonon modes that can help an experimenter identify it. In addition, Raman spectroscopy can be used to observe other low frequency excitations of the solid, such as plasmons, magnons, and superconducting gap excitations. The spontaneous Raman signal gives information on the population of a given phonon mode in the ratio between the Stokes (downshifted) intensity and anti-Stokes (upshifted) intensity.
5. Raman scattering by an anisotropic crystal gives information on the crystal orientation. The polarization of the Raman scattered light with respect to the crystal and the polarization of the laser light can be used to find the orientation of the crystal, if the crystal structure (to be specific, its point group) is known.
6. Raman spectroscopy is the basis for Distributed Temperature Sensing (DTS) along optical fibers, which uses the Raman-shifted backscatter from laser pulses to determine the temperature along optical fibers.
nanotubes. In nanotechnology, a Raman microscope can be used to analyze nanowires to better understand the composition of the structures.
IV. CONCLUSION
Raman spectroscopy, a molecular spectroscopy which is observed as inelastically scattered light, allows for the interrogation and identification of vibrational (phonon) states of molecules. As a result, Raman spectroscopy provides an invaluable analytical tool for molecular finger printing as well as monitoring changes in molecular bond structure (e.g. state changes and stresses & strains). In comparison to other vibrational spectroscopy methods, such as FT-IR and NIR, Raman has several major advantages. These advantages stem from the fact that the Raman effect manifests itself in the light scattered off of a sample as opposed to the light absorbed by a sample. As a result, Raman spectroscopy requires little to no sample preparation and is insensitive to aqueous absorption bands. This property of Raman facilitates the measurement of solids, liquids, and gases not only directly, but also through transparent containers such as glass, quartz, and plastic.
REFERENCES
[1] Jeanmaire DL, van Duyne RP (1977). "Surface Raman Electrochemistry Part I. Heterocyclic, Aromatic and Aliphatic Amines Adsorbed on the Anodized Silver Electrode". Journal of Electroanalytical Chemistry (Elsevier Sequouia S.A.) 84: 1–20. doi:10.1016/S0022-0728(77)80224-6.
[2] Chao RS, Khanna RK, Lippincott ER; Khanna; Lippincott (1974). "Theoretical and experimental resonance Raman intensities for the manganate ion". J Raman Spectroscopy 3 (2– 3): 121. Bibcode:1975JRSp....3..121C. doi:10.1002/jrs.1250030203.
[3] Kneipp K et al. (1999). "Surface-Enhanced Non-Linear Raman Scattering at the Single Molecule Level". Chem. Phys. 247: 155–162.
[4] Hermann P, Hermeling A, Lausch V, Holland G, Möller L, Bannert N and Naumann D. (2011). "Evaluation of tip-enhanced Raman spectroscopy for characterizing different virus strains". Analyst 136 (2): 1148–1152.
[5] Chou, K.C. (1984) Low-frequency vibration of DNA molecules. Biochemical Journal, 221, 27–31.
[6] Chao RS, Khanna RK, Lippincott ER; Khanna; Lippincott (1974). "Theoretical and experimental resonance Raman intensities for the manganate ion". J Raman Spectroscopy 3 (2– 3): 121. Bibcode:1975JRSp....3..121C. doi:10.1002/jrs.1250030203.
[8] Khanna, R.K. (1981). "Raman-spectroscopy of oligomeric SiO species isolated in solid methane". Journal of Chemical Physics 74 (4): 2108. Bibcode:1981JChPh..74.2108K. doi:10.1063/1.441393.
[9] Wall M.H., De Noble L., Hartman R., Spectroscopy, 2005.
[10] Proietti Zaccaria, R; Alabastri, A; De Angelis, F; Das, G; Liberale, C; Toma, A; Giugni, A; Razzari, L; Malerba, M; Sun, Hong Bo; Di Fabrizio, Enzo (2012). "Fully analytical description of adiabatic compression in dissipative polaritonic structures". Physical Review B 86 (3): 035410. Bibcode:2012PhRvB..86c5410P. doi:10.1103/PhysRevB.86.035410.