© 2014, IJCSMC All Rights Reserved
348
Available Online atwww.ijcsmc.comInternational Journal of Computer Science and Mobile Computing
A Monthly Journal of Computer Science and Information Technology
ISSN 2320–088X
IJCSMC, Vol. 3, Issue. 12, December 2014, pg.348 – 360
RESEARCH ARTICLE
Performance Analysis of Efficient
Interference Avoidance Approaches for
WPAN and WLAN Devices
Ms. R.Saranya
1, Dr. R.Pugazendi
21
M.Phil Scholar, Department of Computer Science, K.S.Rangasamy College of Arts and Science (Autonomous),
Tiruchengode, TamilNadu, India
2
Associate Professor & Head, Department of Computer Science, K.S.Rangasamy College of Arts and Science
(Autonomous), Tiruchengode, TamilNadu, India
1
[email protected],
2[email protected]
Abstract --- Wireless communication is the fastest growing segment of the communication industry and it has already captured the enormous attention of the media and the imagination of the people. The growth of Wireless networks and devices has been increased over the last decade. Cellular phone is an important business equipment and most essential part of human life. Among the different wireless devices or networks, each one has separate functionalities and criteria. The coexistence of two of any wireless network is very much helpful for end users for accessing or sharing the resources effectively in broad range. The coexistence mechanisms of Wi-Fi and ZigBee are investigated and novel interference avoidance approaches are proposed in this paper. These approaches are compared to Cooperative Carrier Signaling (CCS)
approach and the simulation results are taken using NS2 simulator.
Keywords--- Wireless Communication, ZigBee, Wi-Fi, Cooperative Carrier Signaling (CCS), Interference Avoidance, Coexistence mechanisms
© 2014, IJCSMC All Rights Reserved
349
I. INTRODUCTION
Wireless communication is one of the most important and emerging research area in the present era due to the enormous
growth of modern communication technologies. It is the transfer of information between two or more access points which are
not linked by an electrical medium. Radio technology is the one of the most common wireless technologies. Radio technology
encompasses different categories of fixed and portable applications such as two way radios, cellular telephones, Personal Digital
Assistants (PDA’s) and Wireless networking. Cordless telephones, paging systems, cellular telephone systems, Garage car
opener, Remote controllers for home entertainment equipment, hand held walkie talkies, Wireless keyboard and mouse and
wireless LAN router, Input transducer, transmitter, channel, receiver, output transducer are some of the components of
communication systems [7].
Radio spectrum is the technology which is commonly used to provide the communication services for users. Its functionality
is based on satellite communication. It is also a collection of radio bands. These radio bands have radio frequencies up to 250
MHZ. Based on the area either it may be rural or urban, spectrum is classified into 2G, 3G and 4G. The spectrum applications
have various types like Broadcasting, Air, Marine, Amateur Radio, Industrial, Scientific, Medical (ISM) spectrum and RADAR.
Among them, ISM spectrum is considered in this paper. The industrial, scientific and medical (ISM) radio bands are radio
bands reserved internationally for the use of radio frequency (RF) energy for industrial, scientific and medical purposes other
than telecommunications. Due to the increment in the users and devices there is a demand in the ISM spectrum [8].
The coexistence process of WLAN and WPAN devices achieve great improvement regarding network performance in ISM
spectrum. Both ZigBee (WPAN) and Wi-Fi (WLAN) have individual techniques and functionalities. Wi-Fi technology is very
useful for particular area which is measured in kilo meters whereas ZigBee provides several benefits within home infrastructure.
Combining these two networks will help in improving the functionalities of both of these networks such as resource sharing,
network life time, access time and so on. During the combining process of these two networks, Interference may occur. By
avoiding this interference only, the performance of coexistence process of WLAN and WPAN devices will increase. Many
research persons have been introduced several concepts to overcome the interference issue. But they did not satisfy the
requirements of Wireless devices efficiently. For that, Xinyu Zhang et al proposed CCS method in 2013 [9]. To overcome the
issues of CCS method, Hybrid encryption, node throughput model and Genetic Algorithm based network monitoring are
proposed in this paper and compared also with existing Carrier Signaling Method (CCS) using NS 2 Simulator in terms of
performance metrics such as Throughput, End to End Delay, Collision rate and Signaler power. The proposed method is
explained in detail in Section II.
II. PROPOSED SYSTEM
Security, network throughput and monitoring of the network are the tasks which are considered to improve the network performance. Hybrid encryption, node throughput model and Genetic Algorithm based network monitoring are proposed
respectively.
© 2014, IJCSMC All Rights Reserved
350
2.1 Network Monitoring
Network monitoring is an efficient evaluation system that constantly monitors a computer network for slow or failing
components and that notifies the network administrator (via email, SMS or other alarms) in case of outages. To improve the
network performance network monitoring is an important concept and so Genetic Algorithms is introduced to optimize the
network. Genetic Algorithms (GAs) has innumerable applications through the optimization techniques and network
optimization, which is included in its part. SNMP (Simple Network Management Protocol) is used as the basic network protocol
for monitoring the network activities & health of the systems [5] [1]. This work deals with adding “Intelligence” to the various
aspects of SNMP by adding optimization techniques derived out of genetic algorithms, which enhances the performance of
SNMP processes like routing.
Basically there are three operators that dominate the functions of the genetic algorithms, which are selection, Crossover
and Mutation. Selection operator grabs an individual from the present generation’s population for inclusion in the next
generation’s population. Crossover works on Crossover Probability to create an offspring by exchanging and combing partial
solutions from two or more individuals. Crossover operator can be subdivided into one-point and uniformcrossovers. Mutation
works by slightly disturbing the recombination solutions with the alteration of small percentage of genes in the given list of
individuals.
2.1.1 Genetic algorithm for network monitoring
Step 1: Initialization
Initialize the required SNMP variables. Generate initial network connectivity P at random or with prior knowledge.
Step 2: Network Connectivity Fitness Evaluation.
Evaluate the connectivity fitness for the entire member in the given network P.
Fitness=∑ //
Step 3: Selection
Select a set of promising network connectivity S from P.
Step 4: Crossover
Apply crossover to the connectivity (routing) pool S for generating a set of routings set O.
Step 5: Mutation
Apply mutation to the routings set O for obtaining its perturbed set OΔ.
Step 6: Replacement
Replace the current network connectivity P with the set of offspring OΔ.
Step 7: Termination
If the termination criteria are not met, go to Step 2.
This algorithm takes five different QoS (SNMP variables) parameters viz., Bandwidth, Latency, Delay, Throughput,
Dropped Packets Measure and Transmission Time. For every node in the network, these parameters are computed and compute
the fitness value. Based on the fitness value, the promising network is selected. After that, performs the three operations such as
© 2014, IJCSMC All Rights Reserved
351
the best solution is identified. High network performance, High Throughput and Less packet drop rate. The result is improved
by using the Genetic based network monitoring method. This method includes the SNMP variables such as Bandwidth, Latency,
Delay, Throughput, Dropped Packets Measure and Transmission Time. So, the network performance is improved.
2.2 Interference and node throughput model
The transmit power and the carrier sense threshold are two major MAC/PHY parameters in CSMA/CA wireless
networks. The problem of transmit power control has been extensively studied in the context of graph-theoretic topology control
and maintenance. In turn which is not be studied in the effect of signal to interference plus noise ratio (SINR) on the topology
and the network capacity sustained under the physical model. In order to remedy the deficiency of conventional topology
control [3] [2] [4] (as a result of neglecting the physical SINR effect) and to further improve network performance, to present a
joint control framework for determining the transmit power control and the carrier sense threshold.
To show that there exists an abrupt increase in the collision probability as the carrier sense threshold increases, and that
this transition can be efficiently identified by observing the collision probability. Thus, to maximize the node throughput, each
node may increase the carrier sense threshold as long as the collision probability is below a reasonable threshold. So, to
introduce a new method called Interference and node throughput model.
1. Initialize the set of nodes in the network 2. While
3. // Compute received power
4.
// Where denotes the distance between nodes i and j, denote the transmit power of node i
5. For the receiver r(i) to correctly decode the symbols, should be larger than or equal to the receive threshold
6.
7. The SINR is computed as,
8.
. // Where ∑
where is the ambient noise, and s called the
SINR threshold of the receiver r (i).
9. Collision setof receiver r (i) denoted by
10. { |
} { | } // Where denote the carrier sense threshold of node I,
(
)
11. denote the carrier sense setof node i,
12. { | }
© 2014, IJCSMC All Rights Reserved
352
In this algorithm, the nodes are initialized in the network. Each and every node in the network, the received power is
computed. Then the received power at r(i) can be expressed as
where denotes the distance between nodes i and
j. As a necessary condition for the receiver r(i) to correctly decode the symbols, should be larger than or equal to the
receive threshold of r(i), denoted by ,
---
The transmission range which is the maximum Of satisfying the equation, can be obtained as,
. In addition to (1), the received power should be large enough so that the interference from other
nodes does not prevent the receiver from correctly decoding the symbols. This condition can be expressed as,
---
Here is given as ∑ where is the ambient noise, and s called the SINR
threshold of the receiver r (i). The collision set of receiver r (i) denoted by is defined as the set of nodes whose
simultaneous transmission with node i will prevent r(i) from correctly decoding the symbols of node i, i.e.,
{ |
} { | }---
Where, (
) . Let denote the carrier sense threshold of node i. If the signal strength perceived
at node i is larger/smaller than , the channel is considered busy/idle by node i. For a given node i, let denote the carrier sense setof node i, which is defined as,
{ | } ---
Where = is termed as the carrier sense range. Hence, node i will be silenced if any node in
transmits. Less interference, high Throughput, Secure communication, High network performance are the benefits of this
method.
2.3 Hybrid Hiding Encryption Method
In order to provide security hybrid hiding encryption algorithm is proposed. This encryption algorithm is based on
hiding a number of bits from plain text message into a random vector of bits. The locations of the hidden bits are determined by
a key known to the sender and receiver [6]. The name demonstrates the two basic operations of this algorithm. These are
operations include inserting part of the plaintext bits into a cover to hide it from recognition.
The basic idea of the proposed encryption algorithm is hiding a number of bits from plain text message into a random
victor of bits. The location of the hiding bits are determined by a pre agreed-upon key by the sender and the receiver. The
Hybrid Hiding Encryption Algorithm is shown below.
1
2
3
© 2014, IJCSMC All Rights Reserved
353
Given a plain text message M and Key matrix where,
{ ---
The aim of the algorithm is hiding a number of bits from plain text message (M) into a random vector (V) of bits. The locations
of the hidden bits are determined by the key
Input: M [plain text message], [Kay array]
First: in a plain text file, each character is sequentially replaced by its binary value.
i=0
m: = first digit in M file
While (m i= i mod L
Generate 8-bits randomly and set them in V vector
If (K[I,1] then For j= K[i,1] to K[i,2]
If ( m then do V [j] =m
M: =next m in M file
End do
Next j
Else
For j= K [I, 1] down to K [I, 2]\
If (m then do V [j] =m
M: = next m in M file
End do
Next j
Save V in output file
i:= i+1
End while
Output: encrypted file
In this algorithm, when the sender wants to send a message to the receiver, it determines the key at first and every
character from the message is replaced by a binary value. An eight-bit octet is generated randomly and set in a temporary vector
V. the bits in the vector V from position K [1,1] to position K[1,2] are replaced by bits from the secret message. Then the
resulting vector V is stored in a file.
For decrypting the received encrypted file the following steps are taken. An octet is read from the encrypted binary
plain text message EBPM file, then it is set in a temporary vector V, from this vector, bits are extracted from position K(1,1) to
position K(1,2) and set in a BPM file.
© 2014, IJCSMC All Rights Reserved
354
Since the EBPM file is nonetheless not empty, the next octet is read from the EBPM file and then it is set in a temporary vector
V. From this vector, bits are extracted from position K (2, 1) to position K (2, 2) and added to the binary plain text message
BPM file. The above steps are repeated over and over again until the EBPM file becomes empty. Every octet form the BPM file
is transformed to the corresponding character, and then it is put in the plaintext file. When the EPBM is empty the plaintext file
becomes the message. In case that the key length is not enough to cover the whole message during the decryption process, the
key will be reapplied over and over again till the decryption of the whole message is completed. These proposed techniques and
their performances are analyzed and compared to the CCS method. Analyzed results are discussed in Section III.
III. EXPERIMENTAL RESULTS AND DISCUSSION
Network Simulator version 2 (NS-2) is a free and open source discrete event network simulator, where the advance of time
depends on the timing of events which are maintained by a scheduler. NS-2 works under Linux, Mac, and Windows. NS-2 has a
large and rich library of network and protocol objects. It covers a large part of applications (Web, FTP, CBR. .) protocols
(transport and routing protocols), network types (Satellite links, wired and wireless LAN), network elements (mobile nodes,
wireless channel models, link and queue models,. . . ) and traffic models (exponential, uniform, . . . ).
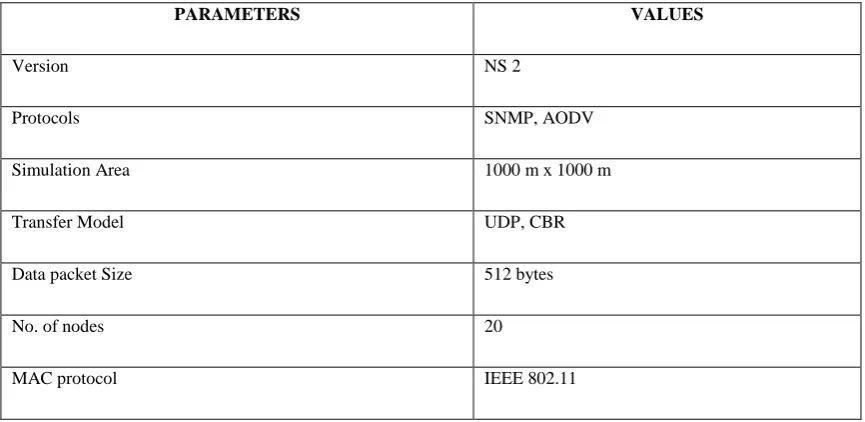
NS-2also allows to add and test new protocols and applications and/or to modify existing ones. The parameters and their
respective value representations are shown in Table 1. The parameters and their formulae are shown in Table 2.
Table 1: NS-2 Configuration Settings
PARAMETERS VALUES
Version NS 2
Protocols SNMP, AODV
Simulation Area 1000 m x 1000 m
Transfer Model UDP, CBR
Data packet Size 512 bytes
No. of nodes 20
© 2014, IJCSMC All Rights Reserved
355
Table 2: Parameters with its FormulaePERFORMANCE METRICS
FORMULAE
Collision Rate No of Data packet collisions ________________________ Specified period of simulation time
End to End Delay ∑ (arrive time – send time) / ∑ Number of connections
Throughput
Transmission Time = File Size / Bandwidth (sec)
Throughput = File Size / Transmission Time (Kbps)
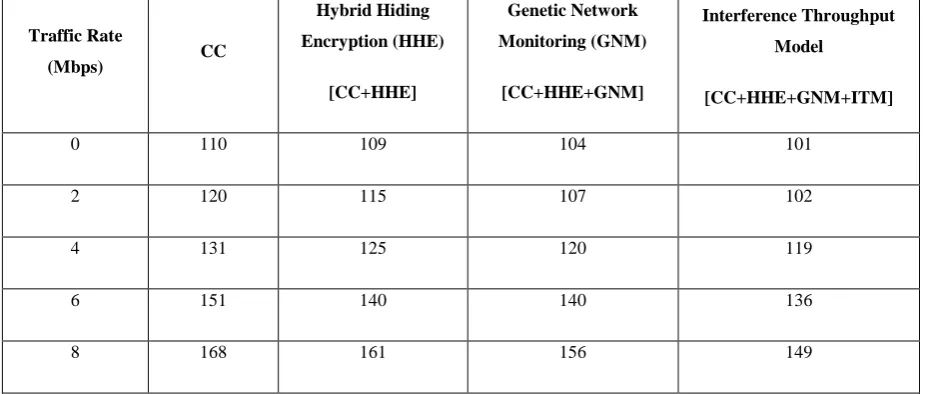
The collision rate values for interference avoidance methods such as CCS, Genetic Algorithm based network
monitoring, Interference node throughput model and Hybrid hiding Encryption method are given in Table 3 for various traffic
rate values and the respective pictorial representation of graph is shown in Graph 1.
Table 3: Collision rate (%) of Interference Avoidance methods
Traffic Rate
(Mbps) CC
Hybrid Hiding
Encryption (HHE)
[CC+HHE]
Genetic Network
Monitoring (GNM)
[CC+HHE+GNM]
Interference Throughput
Model
[CC+HHE+GNM+ITM]
0 110 109 104 101
2 120 115 107 102
4 131 125 120 119
6 151 140 140 136
© 2014, IJCSMC All Rights Reserved
356
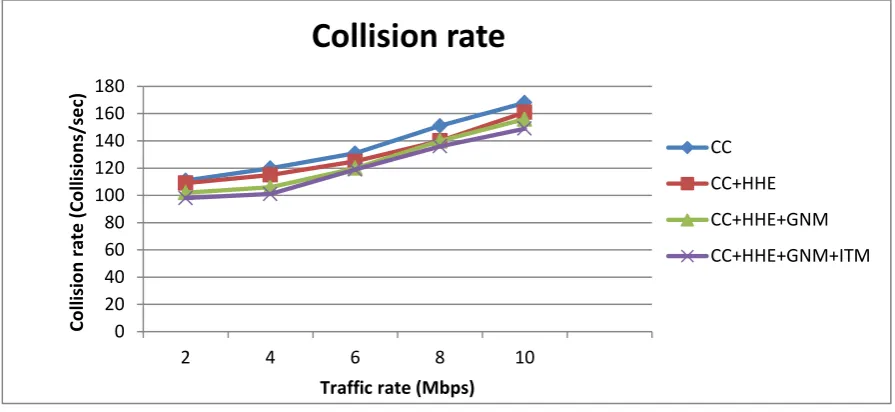
Graph 1: Average Collision rate for 12 nodes
From the results above, it is concluded that the existing interference avoidance method CCS has high collision rate. But
the proposed methods like GA based monitoring, Interference node throughput model and Hybrid hiding Encryption achieves
significant improvement in avoiding collision rate. Among them, GA based monitoring has low collision rate and so it is
considered as best one.The graph also clearly shows that if the traffic rate will increase then the collision rate also will increase.
End to End Delay values are tabulated in Table 4 for Carrier Signaling, HHE, GNM, ITM methods and their respective Graph is
shown in Graph 2.
Table 4: End to End Delay (ms) of Interference Avoidance methods
Traffic Rate
(Mbps) CC
Hybrid Hiding
Encryption (HHE)
[CC+HHE]
Genetic Network
Monitoring (GNM)
[CC+HHE+GNM]
Interference Throughput
Model
[CC+HHE+GNM+ITM]
2 40.55 39.00 38.24 36.22
4 49.01 47.48 44.61 42.01
6 54.06 52.77 52.14 50.74
8 62.57 60.50 59.11 56.57
10 70.09 68.16 67.24 66.01
0 20 40 60 80 100 120 140 160 180
2 4 6 8 10
Co
lli
si
o
n
r
ate
(
Co
lli
si
o
n
s/se
c)
Traffic rate (Mbps)
Collision rate
CC
CC+HHE
CC+HHE+GNM
© 2014, IJCSMC All Rights Reserved
357
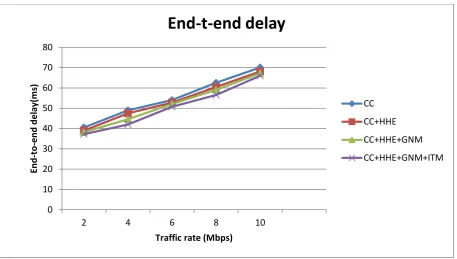
Graph 2: Average End to End Delay (ms) for 12 nodesGraph 2 shows the end-to-end delay. In the X-axis traffic rate (mbps) is taken. Y-axis end-to-end delay is taken. In the
existing system, a cooperative carrier signaling (CCS) is used. In the proposed system, Optimizing network and Providing
Secure communication with interference and throughput model is introduced. This graph clearly shows that if the number of
nodes is increases the end-to-end delay is increased in the existing system. But in the proposed system, there is less end-to-end
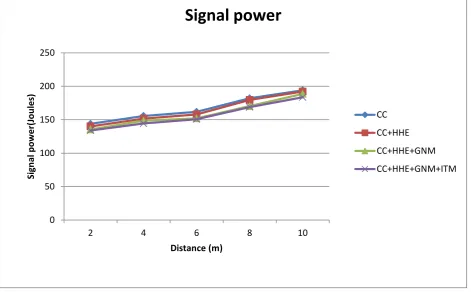
delay. The Signal power values and its pictorial representation are shown in Table 6 and Graph 3 respectively.
Table 6: Signal Power (watts) of Interference methods
Distance
(meters)
CC
Hybrid Hiding
Encryption (HHE)
[CC+HHE]
Genetic Network
Monitoring (GNM)
[CC+HHE+GNM]
Interference
Throughput Model
[CC+HHE+GNM+ITM]
2 143.84 139.99 135.44 132.94
4 155.64 151.64 148.60 144.41
6 161.81 157.92 152.03 150.76
8 182.06 179.54 170.46 168.86
10 194.01 192.10 188.67 183.60
2 143.84 139.99 135.44 133.94
0 10 20 30 40 50 60 70 80
2 4 6 8 10
En
d
-to
-e
n
d
d
e
lay
(m
s)
Traffic rate (Mbps)
End-t-end delay
CC
CC+HHE
CC+HHE+GNM
© 2014, IJCSMC All Rights Reserved
358
Graph 3: Average Signal Power (watts) for 12 nodesAccording to the simulation results, it is analyzed that GA with monitoring method has high signal power because it
only achieves nearly optimal network performance than others. After that Hybrid hiding encryption achieves better results.
Interference and node throughput model obtains next level of signal power whereas existing CCS method has very low signal
power. The following Table 7 has the Throughput values and Graph 4 contains its pictorial representation.
Table 7: Throughput (bps) of Interference Avoidance methods
Distance
(meters)
CC
Hybrid Hiding
Encryption (HHE)
[CC+HHE]
Genetic Network
Monitoring (GNM)
[CC+HHE+GNM]
Interference
Throughput Model
[CC+HHE+GNM+ITM]
2 275.42 280.62 286.92 288.18
4 321.92 328.87 333.61 338.88
6 373.99 381.98 389.81 393.75
8 451.18 456.11 461.35 466.36
10 542.74 548.32 544.64 550.36
0 50 100 150 200 250
2 4 6 8 10
Si
gn
al
p
o
we
r(J
o
u
le
s)
Distance (m)
Signal power
CC
CC+HHE
CC+HHE+GNM
© 2014, IJCSMC All Rights Reserved
359
Graph 4: Average Throughput (bps) for 12 nodesBy analyzing these throughput simulation results, it is revealed that when transmission time increases throughput also
get increases. Among them, the proposed GA with monitoring interference avoidance method shows very high improvement
than others. Interference node throughput model and Hybrid encryption method achieves next levels of performances
respectively and CCS method achieved very low throughput values.
The performance is evaluated for the existing cooperative carrier signaling (CCS) method and the proposed Optimizing
network and Providing Secure communication with interference and throughput model. When compared to the existing
method, in the proposed method there is high throughput and less interference.
IV. CONCLUSION AND FUTURE ENHANCEMENTS
The coexistence process of WLAN and WPAN devices, Interference avoidance mechanisms, network monitoring, and
security are considered and also analyzed in this paper. The performance of proposed Interference avoidance mechanisms such
as Genetic Network Monitoring (GNM), Interference Throughput Model and Hybrid Hiding Encryption Method are evaluated
as well as compared with Cooperative Carrier Signaling (CCS) method finally. The NS2 simulator is used to evaluate these
methods by using the performance metrics like Throughput, collision rate, signaler power and End to End Delay. Results
revealed that Genetic Network Monitoring achieves best result in providing less interference during the coexistence of WLAN
and WPAN devices in ISM spectrum. In future, researchers may develop the methods for interference avoiding using improved
carrier signals which will also competent with high frequency channels.
0 100 200 300 400 500 600
2 4 6 8 10
Th
ro
u
gh
p
u
t
(K
b
yte
s/se
c)
Distance (m)
Throughput
CC
CC+HHE
CC+HHE+GNM
© 2014, IJCSMC All Rights Reserved
360
REFERENCES
[1] D. Goldberg, “Genetic Algorithms in Search, Optimization and Machine learning”, Addison-Wesley Longman Publishing Co., MA, USA, 1989.
[2] V. Rodoplu and T. Meng, “Minimum energy mobile wireless networks”, IEEE International Conference on Communications, Atlanta, GA, vol.3, pp. 1633 – 1639, Jun. 1999
[3] R. Ramanathan and R. Rosales-Hain, “Topology control of multihop wireless networks using transmit power adjustment”, Nineteenth Annual Joint Conference of the IEEE Computer and Communications Societies, Tel Aviv, ISSN: 0743-166X, vol. 2, pp. 404-413, Mar. 2000.
[4] R. Wattenhofer, L. Li, P. Bahl, and Y.-M. Wang, “Distributed topology control for power efficient operation in multihop wireless ad hoc networks”, Twentieth Annual Joint Conference of the IEEE Computer and Communications Societies, Anchorage, AK, vol. 3, pp. 1388-1397, Apr. 2001.
[5] Chang Wook Ahn and Ramakrishna, R. S., “A genetic algorithm for shortest path routing problem and the sizing of populations”. IEEE Transactions on Evolutionary Computation, ISSN: 1089-778X, vol. 6, no. 6, pp. 566 – 579, Dec. 2002.
[6] Mahmoud Shaar, Magdy Saeb, Usama Badawi,” A Hybrid Hiding Encryption Algorithm (HHEA) For Data Communication Security”, Cairo, 46th Midwest Symposium on Circuits and Systems,, ISSN :1548-3746, Vol. 1, pp. 476 – 478, Dec. 2003.
[7] Andrea Goldsmith, “Wireless Communications”, Reference material, copyright by Cambridge University Press, 2005.
[8] B.KiranKumar, R.VishnuMurthy, Srivatsava, B.V.Tata Reddy Karri, MDV Prasad, “Latest Trends in Wireless Mobile Communication (3G to 4G Technologies)”, International Journal of Computer Science and Information Technologies, ISSN: 0975-9646, Vol. 3, No. 1, pp. 3000 – 3005, 2012. [9] Xinyu Zhang and Kang G. Shin, “Cooperative Carrier Signaling: Harmonizing Coexisting WPAN and WLAN Devices”, IEEE/ACM Transactions on
Networking (TON), ISSN: 1063-6692, Vol. 21, No. 2, pp. 426-439, Apr. 2013.
AUTHOR’S BIOGRAPHY
Ms.R.Saranya received her M.Sc (Computer Technology) degree from Sri Krishna College of Engineering and Technology, Affiliated to Anna University, Coimbatore in 2012 and B.ed., degree in Computer Science from the Tamilnadu Teachers Education University, Chennai in 2013. She is pursuing M.Phil (Computer Science) degree Under the Supervision of Dr. R. Pugazendi in K.S.Rangasamy College of Arts and Science College, Tiruchengode. Her Area of interest is Computer Networks.