A Psychoacoustic “NofM”-Type Speech Coding
Strategy for Cochlear Implants
Waldo Nogueira
Laboratorium f¨ur Informationstechnologie, Universit¨at Hannover, Schneiderberg 32, 30167 Hannover, Germany Email:[email protected]
Andreas B ¨uchner
Department of Otolaryngology, Medical University Hanover, Carl-Neuberg-Strasse 1, 30625 Hannover, Germany Email:[email protected]
Thomas Lenarz
Department of Otolaryngology, Medical University Hanover, Carl-Neuberg-Strasse 1, 30625 Hannover, Germany Email:[email protected]
Bernd Edler
Laboratorium f¨ur Informationstechnologie, Universit¨at Hannover, Schneiderberg 32, 30167 Hannover, Germany Email:[email protected]
Received 1 June 2004; Revised 10 March 2005
We describe a new signal processing technique for cochlear implants using a psychoacoustic-masking model. The technique is based on the principle of a so-called “NofM” strategy. These strategies stimulate fewer channels (N) per cycle than active electrodes (NofM;N < M). In “NofM” strategies such as ACE or SPEAK, only theNchannels with higher amplitudes are stimulated. The new strategy is based on the ACE strategy but uses a psychoacoustic-masking model in order to determine the essential components of any given audio signal. This new strategy was tested on device users in an acute study, with either 4 or 8 channels stimulated per cycle. For the first condition (4 channels), the mean improvement over the ACE strategy was 17%. For the second condition (8 channels), no significant difference was found between the two strategies.
Keywords and phrases:cochlear implant, NofM, ACE, speech coding, psychoacoustic model, masking.
1. INTRODUCTION
Cochlear implants are widely accepted as the most effective means of improving the auditory receptive abilities of people with profound hearing loss. Generally, these devices consist of a microphone, a speech processor, a transmitter, a receiver, and an electrode array which is positioned inside the cochlea. The speech processor is responsible for decomposing the in-put audio signal into different frequency bands or channels and delivering the most appropriate stimulation pattern to the electrodes. When signal processing strategies like contin-uous interleaved sampling (CIS) [1] or advanced combina-tional encoder (ACE) [2,3,4] are used, electrodes near the base of the cochlea represent high-frequency information,
This is an open access article distributed under the Creative Commons Attribution License, which permits unrestricted use, distribution, and reproduction in any medium, provided the original work is properly cited.
whereas those near to the apex transmit low-frequency infor-mation. A more detailed description of the process by which the audio signal is converted into electrical stimuli is given in [5].
Envelope detection
Select largest amplitudes Audio Pre-emp
& AGC
BPF 1
BPF 2
BPFM Bandpass
filters
Filter bank Envelope detection Envelope detection
Sampling & selection
Mapping Frame sequence .
. .
. . .
Figure1: Block diagram illustrating ACE.
user preference over conventional CIS-like strategies [6,7,8]. However, speech recognition for cochlear implant recipi-ents in noisy conditions—and, for some individuals, even in quiet—remains a challenge [9, 10]. To further improve speech perception in cochlear implant users, the authors de-cided to modify the channel selection algorithm of the ACE speech coding strategy.
This work therefore describes a new method for select-ing the N bands used in “NofM” strategies. As outlined above, conventional “NofM” strategies select the N bands with the largest amplitudes from theMfilter outputs of the filter bank. In the new scheme theN bands are chosen us-ing a psychoacoustic-maskus-ing model. The basic structure of this strategy is based on the ACE strategy but incorporat-ing the above-mentioned psychoacoustic model. This new strategy has been named the psychoacoustic advanced com-bination encoder (PACE). Psychoacoustic-masking models are derived from psychoacoustic measurements conducted on normal-hearing persons [11,12,13] and can be used to extract the most meaningful components of any given audio signal [14,15]. Those techniques are widely used in common hi-fi data reduction algorithms, where data streams have to be reduced owing to bandwidth or capacity limitations. Well-known examples of these techniques are the adaptive trans-form acoustic coding (ATRAC) [16] coding system for mini-disc recorders and the MP3 [17,18] compression algorithm for transferring music via the Internet. These algorithms are able to reduce the data to one-tenth of its original volume with no noticeable loss of sound quality.
“NofM” speech coding strategies have some similarities to the above-mentioned hi-fi data reduction or compression algorithms in that these strategies also compress the audio signals by selecting only a subset of the frequency bands. The aim in introducing a psychoacoustic model for channel se-lection was to achieve more natural sound reproduction in cochlear implant users.
Standardized speech intelligibility tests were conducted using both the ACE and the new PACE strategy, and the scores compared in order to test whether the use of a psy-choacoustic model in the field of cochlear implant speech coding can indeed yield improved speech understanding in the users of these devices.
The paper is organized as follows. InSection 2, a review of the ACE strategy is presented. Furthermore, the psychoa-coustic model and how it has been incorporated into an “NofM” strategy is described. Section 3gives the results of the speech understanding tests with cochlear implant users and finally, in Sections4and5, a discussion and the conclu-sions are presented respectively.
2. METHODS
2.1. Review of the ACE strategy
Several speech processing strategies have been developed over the years. These strategies can be classified into two groups: those based on feature extraction of the speech sig-nals and those based on waveform representation. The ad-vanced combinational encoder (ACE) [2, 3] strategy used with the Nucleus implant is an “NofM”-type strategy be-longing to the second group. The spectral peak (SPEAK) [4] strategy is identical in many aspects to the ACE strategy, but different in rate.Figure 1shows the basic block diagram il-lustrating the ACE strategy.
The signal from the microphone is first pre-emphasized by a filter that amplifies the high-frequency components in particular. Adaptive-gain control (AGC) is then used to limit distortion of loud sounds by reducing the amplification at the right time.
Afterwards, the signal is digitized and sent through a filter bank. ACE does not explicitly define a certain filter bank approach. The frequency bounds of the filter bank are linearly spaced below 1000 Hz, and logarithmically spaced above 1000 Hz.
Envelope detection
Select largest amplitudes Digital
audio FFT
x(n)
r(j) a(z) a(zi)
li Mapping
Frame sequence
Sampling & selection Filter bank
Figure2: Block diagram illustrating research ACE.
Table1: Number of FFT bins, center frequencies, and gains per filter band forM=22.
Band numberz 1 2 3 4 5 6 7 8 9 10 11
Number of bins 1 1 1 1 1 1 1 1 1 2 2
Center freqs. (Hz) 250 375 500 625 750 875 1000 1125 1250 1437 1687
Gainsgz 0.98 0.98 0.98 0.98 0.98 0.98 0.98 0.98 0.98 0.68 0.68
Band numberz 12 13 14 15 16 17 18 19 20 21 22
Number of bins 2 2 3 3 4 4 5 5 6 7 8
Center freqs. (Hz) 1937 2187 2500 2875 3312 3812 4375 5000 5687 6500 7437
Gainsgz 0.68 0.68 0.65 0.65 0.65 0.65 0.65 0.65 0.65 0.65 0.65
The bandwidth of a cochlear implant is limited by the number of channels (electrodes) and the overall stimula-tion rate. The channel stimulastimula-tion rate represents the tem-poral resolution of the implant, while the total number of electrodesMrepresents the frequency resolution. However, onlyNout ofMelectrodes (N < M) are stimulated in each cycle, therefore a subset of filter bank output samples with the largest amplitude is selected. IfNis decreased, the spec-tral representation of the audio signal becomes poorer, but the channel stimulation rate can be increased, giving a bet-ter temporal representation of the audio signal. Conversely, if the channel stimulation rate is decreased, N can be in-creased, giving a better spectral representation of the audio signal.
Finally, the last stage of the process maps the amplitudes to the corresponding electrodes, compressing the acoustic amplitudes into the subject’s dynamic range between mea-sured threshold and maximum comfortable loudness level for electrical stimulation.
2.2. Research ACE strategy used
A research ACE strategy [3] was made available by Cochlear Corporation for the purpose of deriving new speech coding strategies. However, the research ACE strategy is designed to process signals that are already digitized. For this reason, the pre-emphasis filter and adaptive-gain controls (AGC) incor-porated at the analogue stage are not included in this set-up. Figure 2shows a basic block diagram illustrating the strategy. A digital signal sampled at 16 kHz is sent through a filter bank without either pre-amplification or adaptive-gain con-trol. The filter bank is implemented with an FFT (fast Fourier transform). The block update rate of the FFT is adapted to the rate of stimulation on a channel (i.e., the total implant rate divided by the number of bands selectedN). The FFT is performed on input blocks of 128 samples (L = 128) of
the previously windowed audio signal. The window used is a 128-point Hann window [19]
w(j)=0.5
1.0−cos
2π j
L
, j=0,. . .,L−1. (1)
The linearly-spaced FFT bins are then combined by sum-ming the powers to provide the required number of fre-quency bandsM, thus obtaining the envelope in each spectral banda(z) (z=1,. . .,M). The real part of the jth FFT bin is denoted withx(j), and the imaginary part y(j). The power of the bin is
r2(j)=x2(j) +y2(j), j=0,. . .,L−1. (2)
The power of the envelope of a filter bandzis calculated as a weighted sum of the FFT bin powers
a2(z)=
L/2
j=0
gz(j)r2(j), z=1,. . .,M, (3)
wheregz(j) are set to the gainsgz for a specific number of
bins and otherwise zero. This mapping is specified by the number of bins, selected in ascending order starting at bin 2, and by the gainsgzas presented inTable 1[3,20].
The envelope of the filter bandzis
a(z)=
L/2
j=0
gz(j)r2(j), z=1,. . .,M. (4)
In the “sampling and selection” block, a subset ofN(N <
M) filter bank envelopesa(zi) with the largest amplitude are
Envelope detection
Selection algorithm Digital
audio
FFT Mapping
Frame sequence
Sampling & selection Filter bank
Psychoacoustic model
Figure3: Block diagram illustrating an “NofM” strategy incorporating a psychoacoustic model for selecting theNbands. The strategy may be termed the psychoacoustic ACE strategy.
The “mapping” block, determines the current level from the envelope magnitude and the channel characteristics. This is done by using the loudness growth function (LGF) which is a logarithmically-shaped function that maps the acoustic envelope amplitudea(zi) to an electrical magnitude
pzi=
log1 +ρazi−s/m−s
log(1 +ρ) , s≤a
zi≤m, 0, azi< s,
1, azi≥m.
(5)
The magnitude p(zi) is a fraction in the range 0 to 1
that represents the proportion of the output range (from the thresholdTto the comfort levelC). A description of the pro-cess by which the audio signal is converted into electrical stimuli is given in [21]. An input at the base-levelsis mapped to an output at threshold level, and no output is produced for an input of lower amplitude. The parametermis the in-put level at which the outin-put saturates; inin-puts at this level or above result in stimuli at comfort level. If there are less than
Nenvelopes above base level, they are mapped to the thresh-old level. The parameterρcontrols the steepness of the LGF, the selection of a suitable value forρis described in [20].
Finally, the channelszi, are stimulated sequentially with
a stimulation order from high-to-low frequencies (base-to-apex) with levels:
li=T+ (C−T)pi. (6)
2.3. “NofM” strategy using a psychoacoustic model: the psychoacoustic ACE (PACE) strategy
Based on the general structure of the research ACE strategy (Figure 2) but incorporating a psychoacoustic model, a new approach was designed in order to select the N (N < M) bands in “NofM” strategies. A basic block diagram illustrat-ing the proposed PACE strategy is presented inFigure 3.
Both the filter bank and the envelope detection pro-cess are identical to those in the research ACE strategy. A psychoacoustic-masking model—as opposed to a peak-picking algorithm—is then used to select theNbands. Con-sequently, the bands selected by this new approach are not necessarily those with the largest amplitudes (as is the case
in the ACE strategy) but the ones that are, in terms of hear-ing perception, most important to normal-hearhear-ing people. Afterwards, the bands selected are mapped to electrical im-pulses and sent to the electrode array following exactly the same process as in the research ACE strategy.
In the following paragraphs the psychoacoustic model and the selection algorithm will be explained.
2.3.1. Psychoacoustic model
There are different classes of psychoacoustic models, the one referred to in this manuscript being a psychoacoustic-masking model. Such models describe psychoacoustic-masking effects that take place in a healthy auditory system. Psychoacoustic mod-els have been successfully used within the field of audio cod-ing in order to reduce bandwidth requirements by removcod-ing the less perceptually important components of audio signals. Because “NofM” speech coding strategies only select certain spectral elements of the audio signals, it can be speculated that a psychoacoustic model may ensure more effective se-lection of the most relevant bands than is achieved by merely selecting the spectral maxima, as with the ACE strategy.
Psychoacoustic-masking models are based on numerous studies of human perception, including investigations on the absolute threshold of hearing and simultaneous mask-ing. These effects have been studied by various authors [11,12,13,22].
The absolute threshold of hearing is a function that gives the required sound pressure level (SPL) needed in order that a pure tone is audible in a noiseless environment. The effect of simultaneous masking occurs when one sound makes it difficult or impossible to perceive another sound of similar frequency.
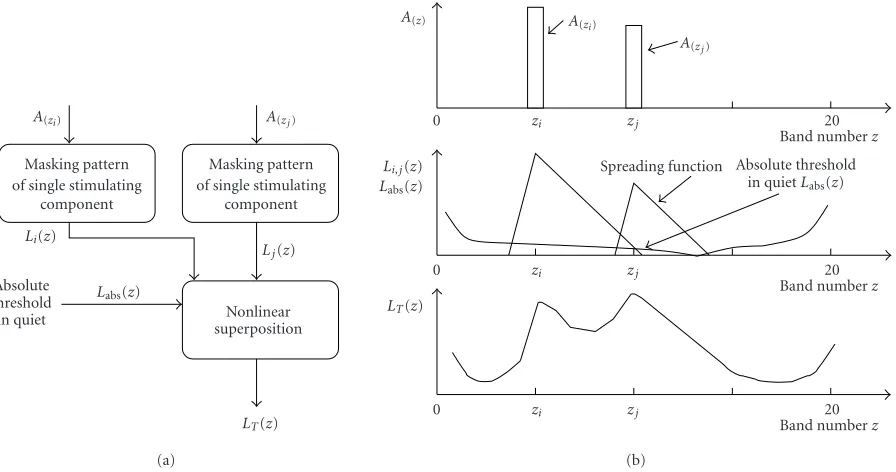
Masking pattern of single stimulating
component
Masking pattern of single stimulating
component
Nonlinear superposition Absolute
threshold in quiet
Labs(z) Li(z)
LT(z)
Lj(z)
A(zi) A(zj)
(a)
Spreading function Absolute threshold in quietLabs(z)
Band numberz Band numberz Band numberz
0 zi zj 20
0 zi zj 20
0 zi zj 20
LT(z)
Li,j(z)
Labs(z)
A(z) A(zi)
A(zj)
(b)
Figure4: (a) Block diagram. The input comprises the envelope values of the bands chosen by the selection algorithm. The output is the overall masked threshold. (b) Associated levels over the frequency band numberz.
L
ev
el
(dB
SPL)
0 1000 3000 5000 7000 9000 11 000
F(Hz) 0
10 20 30 40 50 60 70
Tabs(f)
(a)
(dB)
0 5 10 15 20
Speech level vowel “A”
Band numberz
0 10 20 30 40 50 60
∼50 dB
Labs(z)
(b)
Figure5: (a) Threshold in quiet over the frequency in Hz. (b) Threshold in quiet approximation over the band numberzand spectral level when the vowel “A” is uttered.
2.3.1.1. Threshold in quiet
A typical absolute threshold expressed in terms of dB SPL is presented inFigure 5a[23].
The functionLabs(z) representing the threshold in quiet in each frequency bandzis obtained by choosing one repre-sentative value of the function presented inFigure 5aat the centre frequency of each frequency band (Table 1). However, as the authors have no a priori knowledge regarding playback levels (SPL) of the original audio signals, a reference had to be chosen for setting the level of the threshold in quiet. It is known that the threshold in quiet lies at around 50 dB below
dB
0 1 2 3 4 5 6
Band numberz 0
10 20 30 40 50 60 70 80
av
A(zi)
Li(z)
Slope
sl
Slope
sr
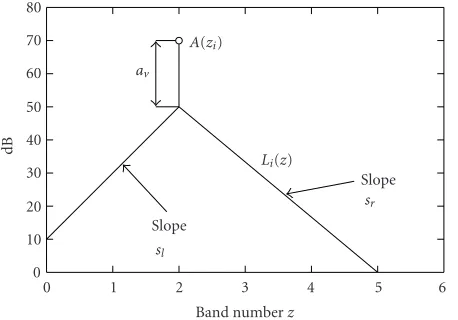
Figure6: Spreading functionLi(z) of one masker componentA(zi) at the bandzi. The left and right slopes of the spreading function are indicated asslandsr. The attenuation of the maximum relative to the masker level is denoted byav.
2.3.1.2. Masking pattern of single stimulating component
For each selected band, a function is calculated that models the masking effect of this band upon the others. This func-tion familiar in the field of psychoacoustics as the so-called spreading function, expressed with the same dB units as in Figure 5b, is presented inFigure 6.
The spreading function is described by three parameters: attenuation, left slope, and right slope. The amplitude of the spreading function is defined using the attenuation param-eterav. This parameter is defined as the difference between
the amplitude of the selected bandA(zi) and the maximum of the spreading function in dB units. The slopes sl andsr
correspond to the left and right slopes, respectively, in the unit “dB/band.” As presented in [15], the spreading function belonging to a band zi with amplitudeA(zi) in decibels is
mathematically represented byLi(z):
Li(z)=
Azi−av−sl·zi−z, z < zi,
Azi−av−sr·z−zi, z≥zi,
(7)
where
(i) zdenotes the frequency band number at the output of the filter bank, 1≤z≤M,
(ii) i denotes that the band selected is zi (i.e., masker
band).
In the model description of [15], z denoted the criti-cal band rate [11, 24] or equivalently critical band num-ber [12,13]. Because the bandwidths of the frequency bands used in the filter bank in the ACE and PACE schemes are ap-proximately equal to the critical bands, the frequency band number corresponds approximately to the critical band rate. Therefore, in the implementation of the masking model in the present study, it was opted to define the masking patterns as a function of the frequency band number instead of the critical band rate.
2.3.1.3. Nonlinear superposition
The sound intensitiesIabs(z) andIi(z) are calculated from the
decibel levels by
Iabs(z)=10Labs(z)/10,
Ii(z)=10Li(z)/10. (8)
Threshold components should be combined in a way that reflects the characteristics of human auditory percep-tion. Certain approaches have been based on linear addition of the threshold components [25]. However, further results proved that linear models fail in most cases where threshold components exhibit spectral overlapping [25,26]. A nonlin-ear model was thus proposed to reproduce the significantly higher masking effects obtained in the overlapping threshold components by linear models [27]. Differences of the masked thresholds resulting from a linear and nonlinear superposi-tion are discussed in [15]. Results indicate that significant improvements are possible using a nonlinear model.
A “power-law model,” as described in 1995 by Baumgarte [15], was therefore used for the superposition of different masked thresholds in order to represent the nonlinear super-position. The “power-law model” is defined by the parameter
αwhere 0< α≤1. Ifαis 1, the superposition of thresholds is linear; ifαis lower than 1, the superposition is carried out in a nonlinear mode. A description of different values ofαcan be also obtained from [15]. The nonlinear superposition of masking thresholds defined byIT(z) is
IT(z)=
Iabs(z)
α
+
i
Ii(z)α
1/α
. (9)
The level in decibels of the superposition of the individ-ual masking thresholds denoted byLT(z) is
LT(z)=10 log10
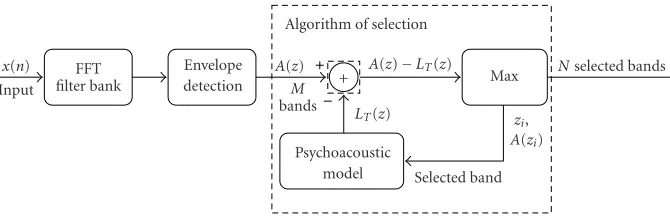
Envelope detection
Psychoacoustic model
x(n) A(z)
M
bands L T(z)
A(zi)
zi,
A(z)−LT(z) Max Algorithm of selection
FFT filter bank Input
Selected band
Nselected bands +
Figure7: Selection algorithm: the audio samples are the input and theNbands selected are the output. A psychoacoustic model is used to select the bands in each iteration.
2.3.2. Selection algorithm
This algorithm is inspired by the analysis/synthesis loop [14] used in the MPEG-4 parametric audio coding tools “har-monic and individual lines plus noise” (HILN) [28]. The se-lection algorithm loop chooses theNbands iteratively in or-der of their “significance” (Figure 7).
The amplitude envelopes of the M bands A(z) (z = 1,. . .,M) are obtained from the filter bank. For the first iter-ation of the algorithm there is no masking threshold and the threshold in quiet is not considered; the first band selected is therefore the one with the largest amplitude. For this band, the psychoacoustic model calculates its associated masking thresholdLT(z) (z=1,. . .,M).
In the next iteration the bandziis selected out of the
re-mainingM−1 bands for which the following difference is largest:
zi=argmaxA(z)−LT(z), z=1,. . .,M. (11)
The individual masking threshold of this band Li(z)
is calculated and added to the one previously determined. The masking threshold LT(z) for the actual iteration is
then obtained and used to select the following band. The loop (Figure 7) is repeated until the N bands are selected. Therefore, at each step of the loop, the psychoacoustic model selects the band that is considered as most significant in terms of perception.
2.3.3. Application to the ACE strategy
The psychoacoustic model has been incorporated into a re-search ACE strategy made available by Cochlear Corpora-tion as a Matlab “toolbox,” designated the nucleus implant communicator (NIC). However, this ACE strategy does not incorporate the pre-emphasis and adaptive-gain control fil-ters described inSection 2.1. The new strategy based on psy-choacoustic masking has been termed the psypsy-choacoustic ACE (PACE) strategy as explained in Section 2.3. The NIC allows the ACE and the PACE to be configured using diff er-ent parameters: the rate of stimulation on a channel (channel stimulation rate), the number of electrodes or channels into which the audio signal is decomposed (M), and the num-ber of bands selected per cycle (N). At the same time, the psychoacoustic model can be modified according to the pa-rameters that define the spreading function (Figure 6). In the
following paragraphs we will describe the rationale for set-ting the parameter values that are used in the experiments.
2.3.3.1. Parameter setting for the PACE strategy
The parameter set that defines the spreading function should describe the spectral masking effects that take place in a healthy auditory system. Such effects depend strongly on the type of components that are masking and being masked [11]. However, they can be reduced to two general situations: masking of pure tones by noise and masking of pure tones by tones [11]. Furthermore, the first scenario should iden-tify the type of masking noise, that is, whether it is broad-band, narrowbroad-band, lowpass or highpass noise. For the sec-ond scenario, it should also be specified which kind of tone is having a masking effect, that is, whether it is pure tone or a set of complex tones. For each of these situations a dif-ferent parameter set for the spreading function should be defined, depending on the frequencies and amplitudes of the masker and masked components. For example, in audio compression algorithms such as the MPEG1 layer 3 (MP3) [17] usually only two situations are considered [23]: noise-masking tone (NMT) and tone-noise-masking noise (TMN). For each scenario, a different shape for the spreading function based on empirical results is defined.
dB
0 5 10 15 20
Band numberz 0
10 20 30 40 50 60
(a)
dB
0 5 10 15 20
Band numberz 0
10 20 30 40 50 60
(b)
Figure8: (a) Frequency band decomposition of one frame coming from a token of the vowel “a.” (b) Selected bands using the ACE strategy for one frame coming from a token of the vowel “a.”
test different masking effects: (left slope=12 dB/band, right slope=7 dB/band) and (left slope=40 dB/band, right slope
=30 dB/band). Furthermore, outcomes from previous stud-ies demonstrated that the value ofavdefining the attenuation of the spreading function with regard to the masker level is highly variable, ranging between 4 dB and 24 dB depending on the type of masker component [23]. For this reason, the value ofav was set to 10 dB, which lies between the values
mentioned above. The parameterαwhich controls the non-linear superposition of individual masking thresholds was set to 0.25, which is in the range of values proposed in [15,27]. Finally, the threshold in quiet was set to an appropriate level as presented in Section 2.3.1.1.
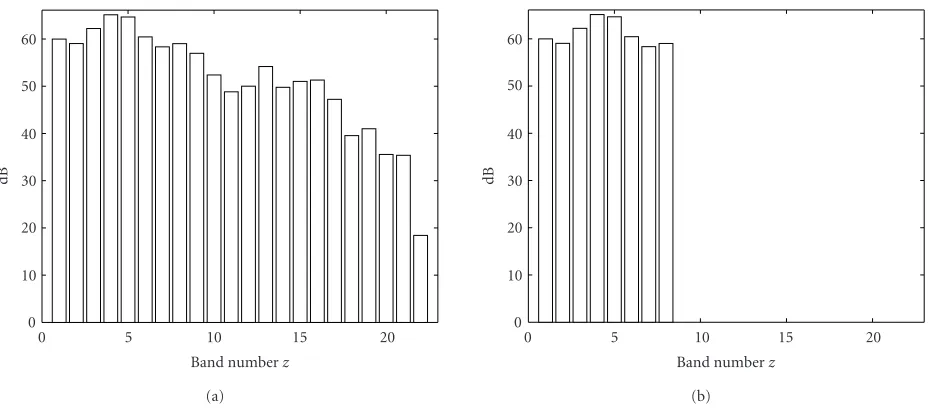
2.3.3.2. Objective analysis
The NIC software described permits a comparison between the ACE strategy and the psychoacoustic ACE strategy. Figure 8ashows the frequency decomposition of a speech to-ken processed with both strategies. The toto-ken is the vowel introduced in Section 2.3.1.1. The filter bank used for both strategies decomposes the audio signal into 22 bands (M =
22). Eight of the separated-out bands are selected (N =8). The bands selected differ between the two strategies, as diff er-ent methods of selecting the amplitudes were used.Figure 8b gives the bands selected by the ACE strategy. Figures9a,9b, 10a, and10b, respectively, illustrate the bands selected by the PACE strategy and the spreading functions used in the psy-choacoustic model.
The spreading function presented inFigure 10bis steeper than that demonstrated in Figure 9b. Thus, using the psy-choacoustic model based on the spreading function in Figure 9b, any frequency band will have a stronger mask-ing effect over the adjacent frequency bands than with the psychoacoustic model based on the spreading function in
Figure 10b. The psychoacoustic models based on the spread-ing function shown in Figures9band10bare referred to in the following sections as psychoacoustic models 1 and 2, re-spectively.
Looking at Figures8,9, and10it can be observed that the bands selected using a psychoacoustic model are dis-tributed broadly across the frequency range, in contrast to the stimulation pattern obtained with the simple peak-picking “NofM” approach used in the standard ACE strat-egy. The ACE strategy tends to select groups of consecu-tive frequency bands, increasing the likelihood of channel interaction between adjacent electrodes inside the cochlea. In the PACE strategy, however, the selection of clusters is avoided owing to the masking effect that is exploited in the psychoacoustic model. This feature can be confirmed by an experiment that involves counting the number of clusters of different lengths selected by the ACE and PACE strategies during the presentation of 50 sentences from a standard-ized sentence test [29]. For the PACE the test material was processed twice, the first time using psychoacoustic model 1 and then using psychoacoustic model 2. The 50 sentences were processed using a channel stimulation rate of 500 Hz and selecting 8 bands in each frame for both strategies. This means that the maximum possible cluster length is 8, when all selected bands are sequenced consecutively across the fre-quency range as demonstrated inFigure 8b. The minimum possible cluster length is 1, which occurs when all selected bands are separated from each other by at least one channel. Table 2 presents the number of clusters of different lengths (1–8) for the ACE, PACE 1 (using psychoacoustic model 1) and PACE 2 (using psychoacoustic model 2) strategies that occur during the 50 sample sentences.
dB
0 5 10 15 20
Band numberz 0
10 20 30 40 50 60
(a)
dB
0 5 10 15 20
Band numberz 0
5 10 15 20 25 30 35
(b)
Figure9: (a) Selected bands using the PACE strategy for one frame coming from a token of the vowel “a.” (b) Spreading function used in the psychoacoustic model (left slope=12 dB/band, right slope=7 dB/band,av=10 dB).
dB
0 5 10 15 20
Band numberz 0
10 20 30 40 50 60
(a)
dB
0 5 10 15 20
Band numberz 0
5 10 15 20 25 30 35
(b)
Figure10: (a) Selected bands using the PACE strategy for one frame coming from a token of the vowel “a.” (b) Spreading function used in the psychoacoustic model (left slope=40 dB/band, right slope=30 dB/band,av=10 dB).
whereas the PACE strategy with the psychoacoustic model 1 selects only 33 and the PACE strategy with the psychoa-coustic model 2 selects 405. The fact that the PACE 1 selects fewer clusters of 8 bands than the PACE 2 is attributable to the masking effect of the first psychoacoustic model being stronger than the second, as defined by the spreading func-tions of Figures9band10b.
2.4. Speech intelligibility tests
2.4.1. Test environment
The strategies programmed within the NIC environment were tested with patients using a Nucleus 24 implant manu-factured by Cochlear Corporation. The NIC software permits
Table2: Number of times that consecutive frequency bands or clus-ters are selected for different group lengths for the ACE and PACE strategies (using psychoacoustic model 1) and PACE (using psy-choacoustic model 2).
Cluster Number of Number of Number of length ACE clusters PACE 1 clusters PACE 2 clusters
1 60 564 370 161 186 338
2 34 248 107 057 114 201
3 20 557 21 449 46 124
4 15 382 3509 18 314
5 12 671 1424 8356
6 15 287 943 3129
7 17 153 566 1382
8 3607 33 405
The Nucleus 24 implant can use up to a maximum of 22 electrodes. However, only 20 electrodes were used by all of our test subjects as their speech processor in everyday use, the “ESPrit 3G,” only supports 20 channels and the testees were accustomed to that configuration. For this reason, the two most basal channels were dropped from the original filter bank presented inSection 2.2and thus could not be selected for stimulation.
2.4.2. Subjects
Eight adult users of the Nucleus 22 cochlear implant system participated in this study. The relevant details for all subjects are presented inTable 3. All test subjects used the ACE strat-egy in daily life and all were at least able to understand speech in quiet.
2.4.3. Study design
The test material used was the HSM (Hochmair, Schulz, Moser) sentence test [29]. Together with the Oldenburger sentence test [30], this German sentence test is well accepted among German CI centres as a measure of speech percep-tion in cochlear implant subjects. It consists of 30 lists, each with a total of 106 words in 20 everyday sentences consist-ing of three to eight words. Scorconsist-ing is based on “words cor-rect.” The test was created to minimize outcome variations between the lists. A study involving 16 normal-hearing sub-jects in noisy conditions (SNR= −10 dB) yielded 51.3% cor-rectly repeated words from the lists, with a small range of only 49.8% to 52.6% [29]. The test can be administered in quiet and noise. The noise has a speech-shaped spectrum as standardized in CCITT Rec. 227 [31], and is added keeping fixed the overall output level of the test material.
In order to find suitable parameters of the spreading function in the PACE strategy, HSM test material was pro-cessed using two different parameter settings for the spread-ing function, as described in Section 2.3.3.1. Test signals were then delivered to the implants and the subjects reported which samples sounded clearer and more comfortable. The signals were presented in both quiet and noise. The channel stimulation rate was adapted to the needs of each user and
Matlab ACE PACE
Hardware board Personal computer Hard disk
Audio signal Software
Interface
Speech processor
Implant
Figure11: Research hardware made available by cochlear corpora-tion.
both 4 and 8 maxima were tried. This procedure was carried out on 3 subjects over a period of several hours. All 3 sub-jects reported that the sound was best when using the spread-ing function shown inFigure 10b(psychoacoustic model 2). This particular spreading function was subsequently used for all 8 test subjects listed inTable 3.
All tests had to be conducted on an acute basis as the de-scribed research environment does not permit any chronic use, that is, take home experience. In generating the sub-ject’s program, the same psychophysical data measured in the R126 clinical fitting software were used in both the ACE and PACE programs. The parameters that define the loud-ness growth function (seeSection 2.2): the base level of the loudnessS, the saturation levelM, and the steepness param-eterρwere set for all the patients to 33.86 dB, 65.35 dB, and 416.2063, respectively, which are the default parameters in the clinical fitting software [2,20]. However, theS andM values were converted to the linear amplitudessandmin or-der to be inserted in (5) according to the scaling described inSection 2.3.1. Using these values guaranteed that the level of the HSM sentence test was correctly mapped into the dy-namic range defined by SandM. The threshold and max-imum comfortable levels were adjusted to the needs of each patient. Before commencing actual testing, some sample sen-tences were processed using both the ACE and PACE strate-gies. The test subjects spent some minutes listening to the processed material, using both strategies, in order to become familiarized with them. At the same time, the volume was adjusted to suit the needs of the subjects by increasing or de-creasing the value of the comfort and threshold levels.
Table3: Subject demographics.
Patient id Age Duration of deafness
(y) Cause of deafness
Implant experience
(Nucleus 24) (y) Electrode type Usual strategy
P1 65 0.75 Unknown 8 Straight ACE 8 of 20
1080 pps
P2 42 0.08 Temporal 4 Straight ACE 8 of 20
bone fracture 1080 pps
P3 67 11 Otosclerosis 1 Contour ACE 8 of 20
900 pps
P4 39 1.21 Unknown 6 Straight ACE 8 of 20
500 pps
P5 49 2.16 Sudden 1.5 Contour ACE 8 of 20
hearing loss 900 pps
P6 64 0.66 Infection 0.6 Contour ACE 8 of 20
900 pps
P7 68 1.3 Unknown 2 Contour ACE 8 of 20
1200 pps
P8 55 0.08 Sudden 0.08 Contour ACE 8 of 20
hearing loss 900 pps
was randomized and the subjects had to repeat each sentence without knowing which strategy they were listening to (ACE or PACE).
As both strategies were tested on the same hardware and are based on the same psychophysical parameters, the tests permitted a fair comparison.
3. RESULTS
All subjects reported that the sound experienced using both strategies was understandable and not very different from what they were used to hearing through their everyday ACE strategy. Subjects 4 and 8 were only presented with sentences in quiet, as they were unable to understand speech in noise. Subject 1 reported that he could not perceive any difference between the two strategies. The other 7 subjects reported that the auditory sensations perceived using the new strategy were more melodious and clearer than those with the ACE, although the everyday speech-coding strategy used by their clinical speech processors was ACE. Subjects 6 and 8 had the impression that the person talking spoke more rapidly when using ACE—a common finding when cochlear implant users are having difficulties in understanding the test material.
Figures12and13present the averaged scores obtained by each subject for the different tests performed under two con-ditions, that is, stimulating either 4 or 8 of a total of 20 chan-nels in each cycle. The tests were carried out in noise, with a signal-to-noise ratio of 15 dB (unless otherwise stated).
The results obtained show that all 8 subjects obtained better or equal scores using the PACE strategy when 4 elec-trodes were stimulated in each frame. When 8 elecelec-trodes were stimulated, only subject 7 obtained a better score us-ing the ACE strategy than with the PACE strategy. Subject 2
achieved a better result using 4 electrodes with PACE than when using 8 electrodes with the ACE strategy. However, this may be due to a degree of variability within the test material or simply because of the subjects’ diminished concentration at the end of the test session.
The scores show that the difference between the aver-aged groups becomes more marked when 4 electrodes are selected in each cycle instead of 8. In the former case, as fewer electrodes are stimulated, it becomes more important to select the most relevant amplitudes for each cycle. It was also observed that, when using PACE, performance using 4 electrodes matched that achieved with 8. That indicates that PACE may be able to generate the same scores as ACE while using only half as many electrodes. No significant difference could be found between the 8-channel ACE and 8-channel PACE condition. The above results are supported by the sta-tistical analysis described below.
The program used for the analysis was SPSS V 12; the re-sults were subjected to the Wilcoxon test [32].Table 5shows the outcome of the statistical analysis.
The statistical results show that the PACE strategy was found to yield a significant advantage only when 4 channels were selected for stimulation in each cycle. When 8 channels were selected, no significant difference was found between the ACE and PACE strategies.
4. DISCUSSION
Table4: Test details for each patient.
Patient id Number of lists tested Number of electrodes Channel stimulation Noise or quiet
for each condition selected rate conditions
P1 6 4 1080 Noise
P2 2 4 1080 Noise
P2 2 8 1080 Noise
P3 4 4 900 Noise
P4 3 4 500 Quiet
P5 2 4 900 Noise
P5 2 8 900 Noise
P6 2 4 900 Noise
P6 2 8 900 Noise
P7 2 4 1200 Noise
P7 2 8 1200 Noise
P8 2 4 900 Quiet
P8 2 8 900 Quiet
P 1 P 2 P 3 P 4 P 5 P 6 P 7 P 8 Average
ACE PACE
0 10 20 30 40 50 60 70 80 90 100
4 of 20 Quiet
Quiet
49 49 47 87 51 29 41 49 50
49 77 59 94 71 53 59 69 67
Figure12: Score by subject (average and standard deviation). Unless otherwise specified, scores were obtained in noise conditions with a signal-to-noise ratio of 15 dB. The tests were performed using 4 electrodes in each cycle of stimulation.
the ACE strategy when 8 electrodes were stimulated in each cycle of stimulation. The mean score obtained with 4 elec-trodes stimulated was 67% using the psychoacoustic model and 50% for the ACE strategy. Results were only statistically significant under the 4-channel condition; it is, however, pos-sible that future studies with larger sample sizes may yield significant results for the 8-channel condition as well. Inter-estingly, performance using PACE was virtually the same re-gardless of whether 4 or 8 electrodes were used. Therefore, a considerable energy saving could be made using the PACE strategy as it is able to generate the same scores as the ACE strategy while stimulating only half as many electrodes.
Another advantage is that the bands selected using a psy-choacoustic model are more widely separated over the fre-quency domain. It can be speculated that interaction between channels could therefore be reduced. Additionally, the choice
of bands is not merely a matter of selecting the largest ampli-tudes (as with the ACE); this means that smaller electrical currents are required, resulting in power savings.
P2 P5 P6 P7 P8 Average ACE
PACE 0 10 20 30 40 50 60 70 80 90 100
8 of 20
Quiet
60 61 41 69 54 57
68 72.5 58.5 59 68 65
Figure13: Score by subject (average and standard deviation). Unless otherwise specified, scores were obtained in noise conditions with a signal-to-noise ratio of 15 dB. The tests were performed with 8 electrodes in each cycle of stimulation.
Table5: Statistical analysis.
Condition 1 Condition 2 Test p-value
4-channel ACE 4-channel PACE Wilcoxon Significantp=0.017
8-channel ACE 8-channel PACE Wilcoxon Not significantp=0.138
4-channel PACE 8-channel PACE Wilcoxon Not significantp=0.786
4-channel ACE 8-channel ACE Wilcoxon Significantp=0.043
The choice of the parameters that define the spreading function requires more thorough investigation in the future. The spreading function determines how much one channel masks the adjacent frequency bands. As this is not a long-term study and subjects’ attention span during speech per-ception tests is limited, only two different parameter sets are investigated in this paper. The spreading function de-termined by the first parameter set presented a stronger masking effect than the spreading function determined by the second parameter set. First experiments with cochlear implant subjects revealed that stronger masking effect re-sults in poorer speech perception. One explanation for this might be that important speech cues are being left out by the wider masking curves, which then become inaudible to the subject. Nevertheless, the results obtained thus far are en-couraging and indicate the usefulness of a psychoacoustic-masking model in the field of cochlear implants. As the opti-mal parameter set might vary among subjects, further stud-ies are planned to determine the optimal parameter set for the psychoacoustic-masking model. There are also plans to incorporate masking effects whose occurrence may be due
to overlapping of the electrical fields inside the cochlea. The excitation of a subset of neurons that are being stimulated by adjacent electrodes can be determined by measurements using the neural response telemetry (NRT) capabilities of the Nucleus 24 implant [33]. The data derived from such tests can be used to determine the degree of channel interac-tion [34] and this knowledge could be addiinterac-tionally exploited in a future version of our masking model. There is, how-ever, currently only relatively limited data on electrical mask-ing in cochlear implant subjects, and this influenced the au-thors’ decision to initially concentrate on a psychoacoustic-masking model for which fundamental knowledge was al-ready available.
filter is absent, and high-frequency components are impor-tant for speech understanding. The PACE strategy may al-ready account partially for the lack of pre-emphasis by in-troducing the absolute threshold in quiet function where the higher-frequency parts of a white-noise signal are more above threshold than the low-frequency parts. For this rea-son the effect of the pre-emphasis may work differently for the PACE strategy than for the ACE strategy.
Another important aspect is the complexity of the new PACE strategy. As presented in Section 3, this strategy uses the same block structure as the ACE strategy but incorporates a psychoacoustic model to select the bands. This allowed the major blocks of the ACE strategy to be adopted for the PACE strategy. Our implementation of PACE on a personal com-puter was not specifically optimized in terms of computa-tional efficiency. However, it is worth mentioning that the PACE strategy has been already implemented in a commer-cial speech processor for chronic investigations not posing any challenge in terms of computational demands.
The selection of the appropriate signal components is obviously of great importance. The introduction of simple “NofM” approaches in the 1990s already represented a sig-nificant improvement over conventional CIS-like strategies by stimulating fewer electrodes per frame but increasing the channel rate in each channel [6,7,35]. However, the stimu-lation rate may not be the only factor contributing to better hearing with “NofM”-type strategies, as researchers have also observed that these strategies have advantages over CIS-like speech coding using comparable stimulation rates [6,7,8]. The close relationship between “NofM”-type strategies and psychoacoustic masking has been already been mentioned in [35].
Advances in the field of speech coding mean that under-standing in quiet is no longer a major problem for most re-cipients, although hearing in noisy conditions is still severely limited [36,37]. Nevertheless, technical progress in this field has in the recent past led to remarkable performance en-hancements in device users. Moreover, intelligent new speech coding strategies such as transient emphasis spectral max-ima (TESM), which emphasize certain cues in the audio sig-nal, have demonstrated improvement in terms of speech per-ception [38]. However, the electrode-nerve interface that is intended to substitute for the hair cells inside the cochlea is clearly not remotely as sophisticated as a fully functional cochlea. With today’s systems we are attempting to mimic thousands of nerve fibres using crude electrode arrays that contain 8 to 22 electrode contacts at most. Bearing these lim-itations in mind, it becomes apparent that the way in which these few electrodes are selected and stimulated plays a key role in helping cochlear implant subjects understand speech in difficult hearing situations.
5. CONCLUSIONS
The results of the PACE strategy, as described above, suggest that psychoacoustic masking is also applicable to cochlear implant recipients. The idea behind the PACE strategy was
to present to users of such devices only those signal com-ponents that are most clearly perceived by normal-hearing people. In so doing, the limited resolution of the cochlear implant and the electrode-nerve interface can be used more effectively. Results obtained with device users showed signif-icant improvement in speech perception when 4 electrodes were selected using the PACE strategy. No significant im-provement was found when 8 electrodes were selected.
One important final comment: it can be expected that the adoption of a psychoacoustic model in speech processors for chronic use may result in even higher scores using the new PACE strategy. The implementation of a psychoacous-tic model increases the complexity of simpler “NofM” ap-proaches. However, its implementation is clearly viable in commercial speech processor for cochlear implants. We are currently setting up a long-term study on the PACE strat-egy which will be conducted using a commercially available speech processor, thus utilizing the usual analogue front end (with AGC and pre-emphasis filter) and giving users take-home experience.
REFERENCES
[1] B. S. Wilson, C. C. Finley, D. T. Lawson, R. D. Wolford, D. K. Eddington, and W. M. Rabinowitz, “Better speech recognition with cochlear implants,”Nature, vol. 352, no. 6332, pp. 236– 238, 1991.
[2] “ACE Speech Coding Strategy,” Nucleus Technical Reference Manual, Z43470 Issue 3, Cochlear Corporation, Lane Cove, New South Wales, Australia, December 2002.
[3] “ACE and CIS DSP Strategies,”Software Requirements Speci-fication, N95287F Issue 1, Cochlear Corporation, Lane Cove, New South Wales, Australia, October 2002.
[4] P. M. Seligman and H. J. McDermott, “Architecture of the spectra 22 speech processor,”Annals of Otology, Rhinology and Laryngology, vol. 104, suppl. 166, pp. 139–141, 1995. [5] P. C. Loizou, “Signal-processing techniques for cochlear
im-plants,”IEEE Eng. Med. Biol. Mag., vol. 18, no. 3, pp. 34–46, 1999.
[6] J. Kiefer, S. Hohl, E. Sturzebecher, T. Pfennigdorff, and W. Gstoettner, “Comparison of speech recognition with different speech coding strategies (SPEAK, CIS, and ACE) and their re-lationship to telemetric measures of compound action poten-tials in the nucleus CI 24M cochlear implant system,” Audiol-ogy, vol. 40, no. 1, pp. 32–42, 2001.
[7] M. W. Skinner, L. K. Holden, L. A. Whitford, K. L. Plant, C. Psarros, and T. A. Holden, “Speech recognition with the nucleus 24 SPEAK, ACE, and CIS speech coding strategies in newly implanted adults,”Ear & Hearing, vol. 23, no. 3, pp. 207–223, 2002.
[8] H. N. Kim, Y. J. Shim, M. H. Chung, and Y. H. Lee, “Benefit of ACE compared to CIS and SPEAK coding strategies,” Ad-vances in Oto-Rhino-Laryngology, vol. 57, pp. 408–411, 2000. [9] M. F. Dorman, P. C. Loizou, and J. Fitzke, “The identification
of speech in noise by cochlear implant patients and normal-hearing listeners using 6-channel signal processors,” Ear & Hearing, vol. 19, no. 6, pp. 481–484, 1998.
[11] E. Zwicker and H. Fastl,Psychoacoustics: Facts and Models, Springer, Berlin, Germany, 1990.
[12] B. C. J. Moore,An Introduction to the Psychology of Hearing, Academic Press, London, UK, 3rd edition, 1989.
[13] B. C. J. Moore, D. A. Vickers, C. J. Plack, and A. J. Ox-enham, “Inter-relationship between different psychoacoustic measures assumed to be related to the cochlear active mech-anism,”Journal of the Acoustical Society of America, vol. 106, no. 5, pp. 2761–2778, 1999.
[14] B. Edler, H. Purnhagen, and C. Ferekidis, “ASAC— analysis/synthesis codec for very low bit rates,” 100th Au-dio Engineering Society Convention, Copenhagen, Denmark, preprint 4179, May 1996.
[15] F. Baumgarte, C. Ferekidis, and H. Fuchs, “A nonlinear psy-choacoustic model applied to the ISO MPEG layer 3 coder,” 99th Audio Engineering Society Convention, preprint 4087, New York, NY, USA, October 1995.
[16] K. Tsutsui, H. Suzuki, O. Shimoyoshi, M. Sonohara, K. Ak-agiri, and R. Heddle, “ATRAC: adaptive transform acoustic coding for minidisc,”93rd Audio Engineering Society Con-vention, preprint 3456, San Francisco, Calif, USA, October 1992.
[17] ISO/IEC, JTC1/SC29/WG11 MPEG, “Information technology—coding of moving pictures and associated audio for digital storage media at up to about 1.5 Mbit/s-part 3: audio,” IS11172-3, 1992, (“MPEG-1”).
[18] Website of the Fraunhofer institute on MPEG Audio:
http://www.iis.fraunhofer.de/amm/techinf/layer3/index.html. [19] F. J. Harris, “On the use of windows for harmonic analysis with the discrete Fourier transform,”Proc. IEEE, vol. 66, no. 1, pp. 51–83, 1978.
[20] “Nucleus MATLAB Toolbox 2.11,” Software User Manual, N95246F Issue 1, Cochlear Corporation, October 2002. [21] P. C. Loizou, “Mimicking the human ear,”IEEE Signal
Process-ing Mag., vol. 15, no. 5, pp. 101–130, 1998.
[22] B. C. J. Moore and B. R. Glasberg, “A model of loudness perception applied to cochlear hearing loss,”Auditory Neu-roscience, vol. 3, pp. 289–311, 1997.
[23] T. Painter and A. Spanias, “Perceptual coding of digital audio,” Proc. IEEE, vol. 88, no. 4, pp. 451–515, 2000.
[24] J. D. Johnston, “Transform coding of audio signals using per-ceptual noise criteria,”IEEE J. Select. Areas Commun., vol. 6, no. 2, pp. 314–323, 1988.
[25] D. M. Green, “Additivity of masking,”Journal of the Acoustical Society of America, vol. 41, no. 6, pp. 1517–1525, 1967. [26] R. A. Lutfi, “Additivity of simultaneous masking,”Journal of
the Acoustical Society of America, vol. 73, no. 1, pp. 262–267, 1983.
[27] R. A. Lutfi, “A power-law transformation predicting masking by sounds with complex spectra,”Journal of the Acoustical So-ciety of America, vol. 77, no. 6, pp. 2128–2136, 1985.
[28] H. Purnhagen and N. Meine, “HILN-the MPEG-4 parametric audio coding tools,” inProc. IEEE International Symposium on Circuits and Systems (ISCAS ’00), vol. 3, pp. 201–204, Geneva, Switzerland, May 2000.
[29] I. Hochmair-Desoyer, E. Schulz, L. Moser, and M. Schmidt, “The HSM sentence test as a tool for evaluating the speech understanding in noise of cochlear implant users,”American Journal of Otology, vol. 18, suppl. 6, pp. 83–83, 1997. [30] K. Wagener, V. K¨uhnel, and B. Kollmeier, “Entwicklung und
Evaluation eines Satztests f¨ur die deutsche Sprache I: De-sign des Oldenburger Satztests [Development and evaluation of a German sentence test I: Design of the Oldenburg sen-tence test],”Zeitschrift f¨ur Audiologie, vol. 38, no. 1, pp. 4–15, 1999.
[31] H. Fastl, “A masking noise for speech intelligibility tests,” Proceedings TC Hearing, Acoustical Society of Japan, vol. 93, pp. 70–70, 1993.
[32] W. W. Daniel,Applied Nonparametric Statistics, PWS-Kent, Boston, Mass, USA, 2nd edition, 1990.
[33] J. K. Shallop, G. W. Facer, and A. Peterson, “Neural response telemetry with the nucleus CI24M cochlear implant,” Laryn-goscope, vol. 109, no. 11, pp. 1755–1759, 1999.
[34] P. J. Abbas, M. L. Hugher, C. J. Brown, C. A. Miller, and H. South, “Channel interaction in cochlear implant users eval-uated using the electrically evoked compound action poten-tial,”Audiology & Neuro-Otology, vol. 9, no. 4, pp. 203–213, 2004.
[35] A. B¨uchner, R. D. Battmer, P. Boyle, and T. Lenarz, “Clarion Research Interface used to implement an n of m strategy in patients implanted with the CLARION cochlear implant,” in Proc. 6th International Cochlear Implant Conference, Miami Beach, Fla, USA, February 2000.
[36] B. L. Fetterman and E. H. Domico, “Speech recogni-tion in background noise of cochlear implant patients,” Otolaryngology—Head and Neck Surgery, vol. 126, no. 3, pp. 257–263, 2002.
[37] M. F. Dorman, P. C. Loizou, J. Fitzke, and Z. Tu, “The recog-nition of sentences in noise by normal-hearing listeners using simulations of cochlear-implant signal processors with 6–20 channels,”Journal of the Acoustical Society of America, vol. 104, no. 6, pp. 3583–3585, 1998.
[38] A. E. Vandali, “Emphasis of short-duration accoustic speech cues for cochlear implants users,”Journal of the Acoustical So-ciety of America, vol. 109, no. 5, pp. 2049–2061, 2001.
Waldo Nogueira received the Telecom-munication Engineering degree from the Polytechnic University of Catalonia (UPC), Barcelona, Spain, in 2003. He wrote his Diploma thesis as an integrated exchange student at the University of Hanover, Ger-many. Since then, he has been working toward the Ph.D. degree at the Informa-tion Technology Laboratory, University of Hanover. His research interests are audio
and speech signal processing, psychoacoustics, and audio cod-ing.
Andreas B¨uchnerreceived his M.S. degree in informatics in 1995 at the University of Hildesheim, Germany, and his Ph.D. degree (human biology) at the Medical University of Hannover in 2002. After developing sig-nal processing and pattern recognition algo-rithms for medical imaging systems at the University of Hildesheim, he became a Re-search Scientist in the field of audiology at the Department of Otolaryngology at the
Thomas Lenarzpursued his medical stud-ies in otolaryngology during his residency at the University of Tuebingen, Erlangen, London and Heidelberg between 1975 and 1985. He then became Assistant Professor at the Department of Otolaryngology, Uni-versity of Heidelberg. Since 1993, he has been Chairman and Professor of the De-partment of Otolaryngology at the Medical University of Hannover, Germany. The
de-partment has the largest number of cochlear implant patients in the world. Fields of research are cochlear implants, electrophysiologi-cal measurements, research on implantable hearing aids, neonatal hearing screening, pharmacology of the auditory system, otology, and skull base surgery including neuronavigation. He has mem-bership in national/international societies of otolaryngology, au-diology, and skull base surgery. He is member of the Editorial Board of the American Journal of Otology, Otology & Neurotol-ogy, Laryngo-Rhino-Otology. He has more than 200 publications in national and international journals.
Bernd Edlerwas a Research Assistant from 1979 to 1985 at the Institut f¨ur Theoretische Nachrichtentechnik und Informationsver-arbeitung of the University of Hannover. His major research activities were in the field of filter banks and their applications in audio coding. He developed the window switching and aliasing reduction techniques for the filter bank used in the ISO/MPEG-1/2 Layer 3 audio coding standard, which is