Volume 2006, Article ID 42083, Pages1–21 DOI 10.1155/ASP/2006/42083
A Framework for Advanced Video Traces: Evaluating Visual
Quality for Video Transmission Over Lossy Networks
Osama A. Lotfallah,1Martin Reisslein,2and Sethuraman Panchanathan1
1Department of Computer Science and Engineering, Arizona State University, Tempe, AZ 85287, USA 2Department of Electrical Engineering, Arizona State University, Tempe, AZ 85287-5706, USA
Received 11 March 2005; Revised 1 August 2005; Accepted 4 October 2005
Conventional video traces (which characterize the video encoding frame sizes in bits and frame quality in PSNR) are limited to evaluating loss-free video transmission. To evaluate robust video transmission schemes for lossy network transport, generally experiments with actual video are required. To circumvent the need for experiments with actual videos, we propose in this paper an advanced video trace framework. The two main components of this framework are (i) advanced video traces which combine the conventional video traces with a parsimonious set of visual content descriptors, and (ii) quality prediction schemes that based on the visual content descriptors provide an accurate prediction of the quality of the reconstructed video after lossy network transport. We conduct extensive evaluations using a perceptual video quality metric as well as the PSNR in which we compare the visual quality predicted based on the advanced video traces with the visual quality determined from experiments with actual video. We find that the advanced video trace methodology accurately predicts the quality of the reconstructed video after frame losses.
Copyright © 2006 Osama A. Lotfallah et al. This is an open access article distributed under the Creative Commons Attribution License, which permits unrestricted use, distribution, and reproduction in any medium, provided the original work is properly cited.
1. INTRODUCTION
The increasing popularity of video streaming over wireless networks and the Internet require the development and eval-uation of video transport protocols that are robust to losses during the network transport. In general, the video can be represented in three different forms in these development and evaluation efforts using (1) the actual video bit stream, (2) a video trace, and (3) a mathematical model of the video. The video bit stream allows for transmission experiments from which the visual quality of the video that is recon-structed at the decoder after lossy network transport can be evaluated. On the downside, experiments with actual video require access to and experience in using video codecs. In addition, the copyright limits the exchange of long video test sequences, which are required to achieve statistically sound evaluations, among networking researchers. Video models attempt to capture the video traffic characteristics in a par-simonious mathematical model and are still an ongoing re-search area; see for instance [1,2].
Conventional video traces characterize the video encod-ing, that is, they contain the size (in bits) of each encoded video frame and the corresponding visual quality (measured in PSNR) as well as some auxiliary information, such as frame type (I, P, or B) and timing information for the frame
play-out. These video traces are available from public video trace libraries [3,4] and are widely used among networking researchers to test novel transport protocols for video, for ex-ample, network resource management mechanisms [5,6], as they allow for simulating the operation of networking and communications protocols without requiring actual videos. Instead of transmitting the actual bits representing the en-coded video, only thenumber of bits is fed into the simula-tions.
The purpose of this paper is to develop an advanced video trace framework that overcomes the outlined limita-tion of the existing video traces and allows for accurate pre-diction of the visual quality of the reconstructed video af-ter lossy network transport without experiments with actual video. The main underlying motivation for our work is that visual content plays an important role in estimating the qual-ity of the reconstructed video after suffering losses during network transport. Roughly speaking, video sequences with little or no motion activity between successive frames ex-perience relatively minor quality degradation due to losses since the losses can generally be effectively concealed. On the other hand, video sequences with high motion activity be-tween successive frames suffer relatively more severe quality degradations since loss concealment is generally less effective for these high-activity videos. In addition, the propagation of losses to subsequent frames depends on the visual content variations between the frames. To capture these effects, we identify a parsimonious set of visual content descriptors that can be added to the existing video traces to form advanced video traces. We develop quality predictors that based on the advanced video traces predict the quality of the reconstructed video after lossy network transport.
The paper is organized as follows. In the following sub-section, we review related work.Section 2presents an out-line of the proposed advanced video trace framework and a summary of a specific advanced video trace and qual-ity prediction scheme for frame level qualqual-ity prediction. Section 3discusses the mathematical foundations of the pro-posed advanced video traces and quality predictors for de-coders that conceal losses by copying. We conduct formal analysis and simulation experiments to identify content de-scriptors that correlate well with the quality of the recon-structed video. Based on this analysis, we specify advanced video traces and quality predictors for three levels of qual-ity prediction, namely frame, group-of-pictures (GoP), and shot. InSection 4, we provide the mathematical foundations for decoders that conceal losses by freezing and specify video traces and quality predictors for GoP and shot levels qual-ity prediction. InSection 5, the performance of the quality predictors is evaluated with a perceptual video quality met-ric [7], while inSection 6, the two best performing quality predictors are evaluated using the conventional PSNR met-ric. Concluding remarks are presented inSection 6.
1.1. Related work
Existing quality prediction schemes are typically based on the rate-loss-distortion model [8], where the reconstructed quality is estimated after applying an error concealment tech-nique. Lost macroblocks are concealed by copying from the previous frame [9]. A statistical analysis of the channel dis-tortion on intra- and inter-macroblocks is conducted and the difference between the original frame and the concealed frame is approximated as a linear relationship of the diff er-ence between the original frames. This rate-loss-distortion model does not account for commonly used B-frame mac-roblocks. Additionally, the training of such a model can
be prohibitively expensive if this model is used for long video traces. In [10], the reconstructed quality due to packet (or frame) losses is predicted by analyzing the macroblock modes of the received bitstream. The quality prediction can be further improved by extracting lower-level features from the received bitstream such as the motion vectors. However, this quality prediction scheme depends on the availability of the received bitstream, which is exactly what we try to over-come in this paper, so that networking researchers without access to or experience in working with actual video streams can meaningfully examine lossy video transmission mecha-nisms. The visibility of packet losses in MPEG-2 video se-quences is investigated in [11], where the test video sese-quences are affected by multiple channel loss scenarios and human subjects are used to determine the visibility of the losses.
The visibility of channel losses is correlated with the vi-sual content of the missing packets. Correctly received pack-ets are used to estimate the visual content of the missing packets. However, the visual impact of (i.e., the quality degra-dation due to) visible packet loss is not investigated. The im-pact of the burst length on the reconstructed quality is mod-eled and analyzed in [12]. The propagation of loss to subse-quent frames is affected by the correlation between the con-secutive frames. The total distortion is calculated by mod-eling the loss propagation as a geometric attenuation factor and modeling the intra-refreshment as a linear attenuation factor. This model is mainly focused on the loss burst length and does not account for I-frame losses or B-frame losses. In [13], a quality metric is proposed assuming that channel losses result in a degraded frame rate at the decoder. Sub-jective evaluations are used to predict this quality metric. A nonlinear curve fitting is applied to the results of these sub-jective evaluations. However, this quality metric is suitable only for low bit rate coding and cannot account for channel losses that result in an additional spatial quality degradation of the reconstructed video (i.e., not only temporal degrada-tion).
We also note that in [14], video traces have been used for studying rate adaptation schemes that consider the qual-ity of the rate-regulated videos. The qualqual-ity of the regulated videos is assigned a discrete perceptual value, according to the amount of the rate regulation. The quality assignment is based on empirical thresholds that do not analyze the ef-fect of a frame loss on subsequent frames. The propagation of loss to subsequent frames, however, results in nonlinear relationships between losses and the reconstructed qualities, which we examine in this work. In [15], multiple video cod-ing and networkcod-ing factors were introduced to simplify the determination of this nonlinear relationship from a network and user perspective.
2. OVERVIEW OF ADVANCED VIDEO TRACES
Original video sequence
Video encoding
Conventional video trace
Visual content analysis
Visual descriptors Advanced video trace
Quality
predictor Reconstructed quality Loss pattern
Network simulator
Figure1: Proposed advanced video trace framework. The conventional video trace characterizing the video encoding (frame size and frame quality of encoded frames) is combined with visual descriptors to form an advanced video trace. Based on the advanced video trace, the proposed quality prediction schemes give accurate predictions of the decoded video quality after lossy network transport without requiring experiments with actual video.
2.1. Advanced video trace framework
The two main components of the proposed framework, which is illustrated in Figure 1, are (i) the advanced video trace and (ii) the quality predictor. The advanced trace is formed by combining the conventional video trace which characterizes the video encoding (through frame size in bits and frame quality in PSNR) with visual content descriptors that are obtained from the original video sequence. The two main challenges are (i) to extract a parsimonious set of visual content descriptors that allow for accurate quality predic-tion, that is, have a high correlation with the reconstructed visual quality after losses, and (ii) to develop simple and ef-ficient quality prediction schemes which based on the ad-vanced video trace give accurate quality predictions. In order to facilitate quality predictions at various levels and degrees of precision, the visual content descriptors are organized into a hierarchy, namely, frame level descriptors, GoP level de-scriptors, and shot level descriptors. Correspondingly there are quality predictors for each level of the hierarchy.
2.2. Overview of motion information based quality prediction method
In this subsection, we give a summary of the proposed qual-ity prediction method based on the motion information. We present the specific components of this method within the framework illustrated inFigure 1. The rationale and the anal-ysis leading to the presented method are given inSection 3.
2.2.1. Basic terminology and definitions
Before we present the method, we introduce the required basic terminology and definitions, which are also summa-rized in Table 1. We let F(t,i) denote the value of the lu-minance component at pixel location i,i = 1,. . .,N (as-suming that all frame pixels are represented as a single ar-ray consisting ofNelements), of video framet. Throughout, we letKdenote the number of P-frames between successive I-frames and letLdenote the difference in the frame index
between successive P-frames (and between I-frame and first P-frame in the GoP as well as between the last P-frame in the GoP and the next I-frame); note that correspondingly there areL−1 B-frames between successive P-frames. We let D(t,i)= |F(t,i)−F(t−1,i)|denote the absolute difference between frame tand the preceding framet−1 at location i. Following [16], we define the motion informationM(t) of frametas
M(t)=
1
N
N
i=1
D(t,i)−D(t)2, (1)
whereD(t)=(1/N)Ni=1D(t,i) is the average absolute dif-ference between framestandt−1. We define the aggregated motion information between reference frames, that is, be-tween I- and P-frames, as
μ(t)=
L−1
j=0
M(t−j). (2)
For a B-frame, we letvf(t,i) be an indicator variable, which is set to one if pixeliis encoded using forward motion es-timation, is set to 0.5 if interpolative motion estimation is used, and is set to zero otherwise. Similarly, we set vb(t,i) to one if backward motion estimation is used, setvb(t,i) to 0.5 if interpolative motion estimation is used, and setvb(t,i) to zero otherwise. We let Vf(t) = (1/N)Ni=1vf(t,i) de-note the ratio of forward-motion-estimated pixels to the to-tal number of pixels in framet, and analogously denote by Vb(t) = (1/N)Ni=1vb(t,i) the ratio of backward-motion-estimated pixels to the total number of pixels.
Table1: Summary of basic notations.
Variable Definition
L Distance between successive P-frames, that is,L–1 B frames between successive P frames
K Number of P-frames in GoP
R Number of affected P-frames in GoP as a result of a P-frame loss
N Number of pixels in a video frame
F(t,i) Luminance value at pixel locationiin original framet F(t,i) Luminance value at pixel locationiin encoded framet
F(t,i) Luminance value at pixel locationiin reconstructed framet(after applying loss concealment) A(t,i) Forward motion estimation at pixel locationiin P-framet
vf(t,i) Forward motion estimation at pixel locationiin B-framet vb(t,i) Backward motion estimation at pixel locationiin B-framet
e(t,i) Residual error (after motion compensation) accumulated at pixel locationiin framet
Δ(t) The average absolute difference between encoded luminance valuesF(t,i) and reconstructed luminance valuesF(t,i) averaged over all pixels in framet
M(t) Amount of motion information between frametand framet−1
μ(t) Aggregate motion information between P-frametand its reference framet–Lfor frame level analysis of decoders that conceal losses by copying from previous reference (in encoding order) frame
γ(t) Aggregated motion information between P-frametand the next I-frame for frame level analysis of decoders that conceal losses by freezing the reference frame until next I-frame
μ Motion informationμ(t) averaged over the underlying GoP γ Motion informationγ(t) averaged over the underlying GoP
2.2.2. Advanced video trace entries
For each video framet, we add three parameter values to the existing video traces.
(1) The motion informationM(t) of framet, which is cal-culated using (1).
(2) The ratio of forward motion estimationVf(t) in the frame, which is added only for B-frames. We approx-imate the ratio of backward motion estimationVb(t), as the compliment of the ratio of forward motion es-timation, that is,Vb(t)≈1–Vf(t), which reduces the number of added parameters.
(3) The motion activity levelθof the video shot.
2.2.3. Quality prediction from motion information
Depending on (i) the concealment technique employed at the decoder and (ii) the quality prediction level of inter-est, different prediction methods are used. We focus in this summary on the concealment by “copying” (concealment by “freezing” is covered inSection 4) and the frame level pre-diction (GoP and shot levels prepre-dictions are covered in Sub-sections3.4and3.5). For the loss concealment by copying and the frame level quality prediction, we further distinguish
between the lost frame itself and the frames that reference the lost frame, which we refer to as theaffectedframes. With the loss concealment by copying, the lost frame itself is re-constructed by copying the entire frame from the closest ref-erence frame. For an affected frame that references the lost frame, the motion estimation of the affected frame is applied with respect to the reconstruction of the lost frame, as elab-orated inSection 3.
For the lost frametitself, we estimate the quality degra-dationQ(t) with a logarithmic or linear function of the mo-tion informamo-tion if frametis a B-frame, respectively, of the aggregate motion informationμ(t) if frametis a P-frame, that is,
Q(t)=aB
0×M(t) +bB0, Q(t)=aP0×M(t) +b0P,
Q(t)=aB
0×ln
M(t)+bB0, Q(t)=aP
0×ln
M(t)+bP0. (3)
If the lost frametis a P-frame, the quality degradation Q(t+nL) of a P-framet+nL,n=1,. . .,K−1, is predicted as
Q(t+nL)=aP
n×μ(t) +bPn,
Q(t+nL)=aPn×lnμ(t)+bPn,
(4)
using again standard curve fitting techniques.
Finally, for predicting the quality degradationQ(t+m) of a B-framet+m,m = −(L−1),. . .−1, 1,. . .,L−1,L+ 1,. . ., 2L−1, 2L+ 1,. . ., 2L+L−1,. . ., (K−1)L+ 1,. . ., (K− 1)L+L−1, that references a lost P-framet, we distinguish three cases.
Case 1. The B-frame precedes the lost P-frame and references the lost P-frame using backward motion extimation. In this case, we define the aggregate motion information of the af-fected B-framet+mas
μ(t+m)=μ(t)Vb(t+m). (5)
Case 2. The B-frame succeeds the lost P-frame and both the P-frames used for forward and backward motion estimation are affected by the P-frame loss, in which case
μ(t+m)=μ(t), (6)
that is, the aggregate motion information of the affected B-frame is equal to the aggregate motion information of the lost P-frame.
Case 3. The B-frame succeeds the lost P-frame and is back-ward motion predicted with repect to the following I-frame, in which case
μ(t+m)=μ(t)Vf(t+m). (7) In all three cases, linear or logarithmic standard curve fit-ting characterized by the funtional parametersaBm,bBmis used to estimate the quality degradation from the aggregate mo-tion informamo-tion of the affected B-frame.
In summary, for each video in the video trace library, we obtain a set of functional approximations represented by the triplets (ϕPn,aPn,bPn),n = 0, 1,. . .,K−1, and (ϕBm,aBm,aBm), m= −(L−1),. . .−1, 0, 1,. . .,L−1,L+ 1,. . ., 2L−1, 2L+ 1,. . ., 2L+L−1,. . ., (K−1)L+1,. . ., (K−1)L+L−1, whereby ϕP
n,ϕBm=“lin” if the linear functional approximation is used
andϕPn,ϕBm=“log” if the logarithmic functional approxima-tion is used.
With this prediction method, which is based on the anal-ysis presented in the following section, we can predict the quality degradation due to frame loss with relatively high ac-curacy (as demonstrated in Sections5and6) using only the parsimonious set of parameters detailed inSubsection 2.2.1 and the functional approximation triplets detailed above.
3. ANALYSIS OF QUALITY DEGRADATION WITH LOSS CONCEALMENT BY COPYING
In this section, we identify for decoders with loss conceal-ment by copying the visual content descriptors that allow
for accurate prediction of the quality degradation due to a frame loss in a GoP. (Concealment by freezing is consid-ered inSection 4.) Toward this end, we analyze the propa-gation of errors due to the loss of a frame to subsequent P-frames and B-P-frames in the GoP. For simplicity, we focus in this first study on advanced video traces on a single com-plete frame loss per GoP. Single frame loss per GoP can be used to model wireless communication systems that use in-terleaving to randomize the fading effects. In addition, sin-gle frame loss can be seen with multiple descriptions coding, where video frames are distributed over multiple indepen-dent video servers/transmission paths. We leave the develop-ment and evaluation of advanced video traces that accom-modate partial frame loss or multiple frame losses per GoP to future work.
In this section, we first summarize the basic notations used in our formal analysis inTable 1and outline the setup of the simulations used to complement the analysis in the fol-lowing subsection. InSubsection 3.2, we illustrate the impact of frame losses and motivate the ensuing analysis. In the sub-sequent Subsections3.3,3.4, and3.5, we consider the pre-diction of the quality degradation due to the frame loss at the frame, GoP, and shot levels, respectively. For each level, we analyze the quality degradation, identify visual content descriptors to be included in the advanced video traces, and develop a quality prediction scheme.
3.1. Simulation setup
I-frame loss
100 80
60 40
20 0
Frame number 0
2 4 6 8 10 12 14 16
VQ
M
Shot 48 Shot 55
(a)
1st P-frame loss
100 80
60 40
20 0
Frame number 0
2 4 6 8 10 12 14 16
VQ
M
Shot 48 Shot 55
(b)
2nd P-frame loss
100 80
60 40
20 0
Frame number 0
2 4 6 8 10 12 14 16
VQ
M
Shot 48 Shot 55
(c)
1st B-frame loss
100 80
60 40
20 0
Frame number 0
2 4 6 8 10 12 14
VQ
M
Shot 48 Shot 55
(d)
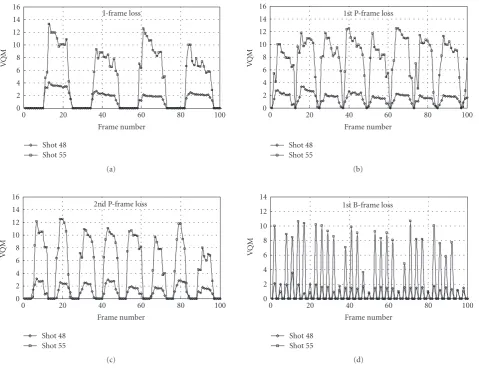
Figure2: Quality degradation due to a frame loss in the underlying GoP for low motion activity level (shot 48) and moderately high motion activity level (shot 55) video.
3.2. Impact of frame loss
To illustrate the effect of a single frame loss in a GoP, which we focus on in this first study on advanced video traces, Figure 2shows the quality degradation due to various frame loss scenarios, namely, I-frame loss, 1st P-frame loss in the underlying GoP, 2nd P-frame loss in the underlying GoP, and 1st B-frame loss between reference frames. Frame losses were concealed by copying from the previous (in decoding order) reference frame. We show the quality degradation for shot 48, which has a low motion activity level of 1, and for shot 55 which has moderately high motion activity level of 3. As expected, the results demonstrate that I-frame and P-frame losses propagate to all subsequent P-frames (until the next loss-free I-frame), while B-frame losses do not propa-gate. Note thatFigure 2(b)shows the VQM values for the re-constructed video frames when the 1st P-frame in the GoP is lost, whereasFigure 2(c)shows the VQM values for the re-constructed frames when the 2nd P frame in the GoP is lost. As we observe, the VQM values due to losing the 2nd P-frame can generally be higher or lower than the VQM values due to
losing the 1st P-frame. The visual content and the efficiency of the concealment scheme play a key role in determining the VQM values. Importantly, we also observe that a frame loss results in smaller quality degradations for low motion activ-ity level video.
As illustrated inFigure 2, the quality degradation due to channel losses is highly correlated with the visual content of the affected frames. The challenge is to identify a representa-tion of the visual content that captures both the spatial and the temporal variations between consecutive frames, in order to allow for accurate prediction of the quality degradation. The motion information descriptor M(t) of [16], as given in (1), is a promising basis for such a representation and is therefore used as the starting point for our considerations.
3.3. Quality degradation at frame level
3.3.1. Quality degradation of lost frame
I-loss
80 70 60 50 40 30 20 10 0
Motion information 0
2 4 6 8 10 12 14
VQ
M
(a)
I-loss
80 70 60 50 40 30 20 10 0
Motion information 0
2 4 6 8 10 12 14
VQ
M
(b)
I-loss
80 70 60 50 40 30 20 10 0
Motion information 0
2 4 6 8 10 12 14
VQ
M
(c)
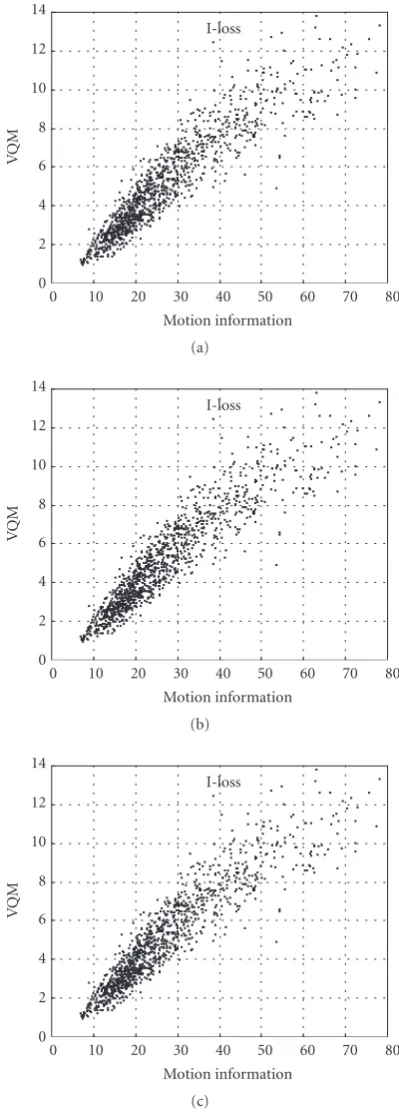
Figure3: The relationship between the aggregate motion informa-tion of the lost frametand the quality degradationQ(t) of the re-constructed frame.
that are coded with reference to the lost frame is considered in the following subsections. We conducted simulations of channel losses affecting I-frames (I-loss), P-frames (P-loss), and B-frames (B-loss). For both a lost I-frametand a lost P-framet, we examine the correlation between the aggregate
Table2: The correlation between motion information and quality degradation for lost frame.
Frame type Pearson correlation Spearman correlation
I 0.903 0.941
P 0.910 0.938
B 0.958 0.968
motion informationμ(t) from the preceding reference frame t–Lto the lost framet, as given by (2), and the quality degra-dationQ(t) of the reconstructed frame (which is framet–L for concealment by copying).
For a lost B-framet+m,m=1,. . .,L−1, whereby framet is the preceding reference frame, we examine the correlation between the aggregate motion information from the closest reference frame to the lost frame and the quality degradation of the lost framet+m. In particular, ifm ≤ (L−1)/2 we consider the aggregate motion information mj=1M(t+ j), and ifm >(L−1)/2 we considerLj=m+1M(t+j). (This ag-gregate motion information is slightly refined over the basic approximation given in (3). The basic approximation always conceals a lost B-frame by copying from the preceding frame, which may also be a B-frame. The preceding B-frame, how-ever, may have been immediately flushed out of the decoder memory and may hence not be available for reference. The refined aggregate motion information approach presented here does not require reference to the preceding B-frame.)
Figure 3shows the quality degradationQ(t) (measured using VQM) as a function of the aggregate motion informa-tion for the different frame types. The results demonstrate that the correlation between the aggregate motion informa-tion and the quality degradainforma-tion is high, which suggests that the aggregate motion information descriptor is effective in predicting the quality degradation of the lost frame.
For further validation, the correlation between the pro-posed aggregate motion information descriptors and the quality degradationQ(t) (measured using VQM) was calcu-lated using the Pearson correlation as well as the nonpara-metric Spearman correlation [20,21].Table 2gives the cor-relation coefficients between the aggregate motion informa-tion and the corresponding quality degradainforma-tion (i.e., the cor-relation betweenx-axis andy-axis ofFigure 3). The highest correlation coefficients are achieved for the B-frames since in the considered GoP withL−1 = 2 B-frames between suc-cessive P-frames, a lost B-frame can be concealed by copy-ing from the neighborcopy-ing reference frame, whereas a P- or I-frame loss requires copying from a reference frame that is three frames away.
The motion informationM(t) reflects this situation by being close to zero; and the functional approximation of the qual-ity degradation also gives a value close to zero. In the case of camera panning, the close-to-constant motion informa-tionM(t) reflects the fact that a frame loss results in approx-imately the same quality degradation at any point in time in the panning sequence.
3.3.2. Analysis of loss propagation to subsequent frames for concealment by copying
Reference frame (I-frame or P-frame) losses affect not only the quality of the reconstructed lost frame but also the qual-ity of reconstructed subsequent frames, even if these sub-sequent frames are correctly received. We analyze this loss propagation to subsequent frames in this and the following subsection. Since I-frame losses very severely degrade the re-constructed video qualities, video transmission schemes typ-ically prioritize I-frames to ensure the lossless transmission of this frame type. We will therefore focus on analyzing the impact of a P-frame loss in a GoP on the quality of the sub-sequent frames in the GoP.
In this subsection, we present a mathematical analysis of the impact of a single P-frame loss in a GoP. We consider ini-tially a decoder that conceals a frame loss by copying from the previous reference frame (frame freezing is considered in Section 4). The basic operation of the concealment by copy-ing from the previous reference frame in the context of the frame loss propagation to subsequent frames is as follows. Suppose the I-frame at the beginning of the GoP is correctly received and the first P-frame in the GoP is lost. Then the sec-ond P-frame is decoded with respect to the I-frame (instead of being decoded with respect to the first P-frame). More specifically, the motion compensation information carried in the second P-frame (which is the residual error between the second and first P-frames) is “added” on to the I-frame. This results in an error since the residual error between the first P-frame and the I-frame is not available for the decoding. This decoding error further propagates to the subsequent P-frames as well as B-P-frames in the GoP.
To formalize these concepts, we introduce the following notation. We lettdenote the position in time of the lost P-frame and recall that there areL−1 B-frames between two reference frames andK P-frames in a GoP. We index the I-frame and the P-I-frames in the GoP with respect to the posi-tion of the lost P-frame byt+nL, and letR,R≤K−1, de-note the number of subsequent P-frames affected by the loss of P-framet. In the above example, where the first P-frame in the GoP is lost, as also illustrated inFigure 4, the I-frame is indexed byt−L, the second P-frame byt+L, andR=2 P-frames are affected by the loss of the first P-frame. We de-note the luminance values in the original frame asF(t,i), in the loss-free frame after decoding asF(t,i), and in the recon-structed frame asF(t,i). Our goal is to estimate the average absolute frame difference betweenF(t,i) and F(t,i), which we denote byΔ(t). We denotei0,i1,i2,. . .for the trajectory of pixeli0in the lost P-frame (with indext+0L) passing through the subsequent P-frames with indicest+ 1L,t+ 2L,. . . .
I B B P B B P B B P B B I
F(t−L,i) F(t,i) F(t+L,i) F(t+ 2L,i)
Figure4: The GoP structure and loss model with a distance ofL= 3 frames between successive P-frames and loss of the 1st P-frame.
3.3.2.1 Analysis of quality degradation of subsequent P-frames
The pixels of a P-frame are usually motion-estimated from the pixels of the reference frame (which can be a preceding I-frame or P-frame). For example, the pixel at positioninin P-framet+nLis estimated from the pixel at positionin−1in the reference framet+ (n−1)L, using the motion vectors of framet+nL. Perfect motion estimation is only guaranteed for still image video, hence a residual error (denoted ase(t,in)) is added to the referred pixel. In addition, some pixels of the current frame may be intra-coded without referring to other pixels. Formally, we can express the encoded pixel value at positioninof a P-frame at time instancet+nLas
Ft+nL,in=At+nL,in Ft+ (n−1)L,in−1
+et+nL,in, n=1, 2,. . .,R, (8)
whereA(t+nL,in) is a Boolean function of the forward mo-tion vector and is set to 0 if the pixel is intra-coded. This equation can be applied recursively from a subsequent P-frame backwards until reaching the lost P-framet, with lumi-nance values denoted byF(t,i0). The resulting relationship between the encoded values of the P-frame pixels at time t+nLand the values of the pixels in the lost frame is
Ft+nL,in
=Ft,i0
n−1
j=0
At+ (n−j)L,in−j
+
n−1
k=0
et+ (n−k)L,in−k k−1
j=0
At+ (n−j)L,in−j.
(9)
the quality degradation. We examine therefore the following approximate recursion:
Ft+nL,in≈Ft+ (n−1)L,in−1+et+nL,in. (10)
The error between the approximated and exact pixel value can be represented as:
ζt+nL,ik=
⎧ ⎪ ⎨ ⎪ ⎩
Ft+nL,ik ifAt+nL,ik=0
0 otherwise.
(11)
This approximation error in the frame representation is neg-ligible for P-frames, in which few blocks are intra-coded. Generally, the number of intra-coded blocks monotonically increases as the motion intensity of the video sequence in-creases. Hence, the approximation error in frame represen-tation monotonically increases as the motion intensity level increases. In the special case of shot boundaries, all the blocks are intra-coded. In order to avoid a high prediction error at shot boundaries, we introduce an I-frame at each shot boundary regardless of the GoP structure.
After applying the approximate recursion, we obtain
Ft+nL,in≈Ft,i0+
n−1
j=0
et+ (n−j)L,in−j. (12)
Recall that the P-frame loss (at time instancet) is concealed by copying from the previous reference frame (at time in-stancet–L), so that the reconstructed P-frames (at time in-stancest+nL) can be expressed using the approximate re-cursion as
Ft+nL,in≈Ft−L,i0+
n−1
j=0
et+ (n−j)L,in−j.
(13)
Thus, the average absolute differences between the recon-structed P-frames and the loss-free P-frames are given by
Δ(t+nL)= N1
N
in=1
Ft+nL,in−Ft+nL,in
= N1
N
i0=1
Ft,i0−Ft−L,i0.
(14)
The above analysis suggests that there is a high correlation between the aggregate motion information μ(t), given by (2) of the lost P-frame, and the quality degradation, given by (11), of the reconstructed P-frames. The aggregate mo-tion informamo-tionμ(t) is calculated between the lost P-frame and its preceding reference frame, which are exactly the two frames that govern the difference between the reconstructed frames and the loss-free frames according to (11).
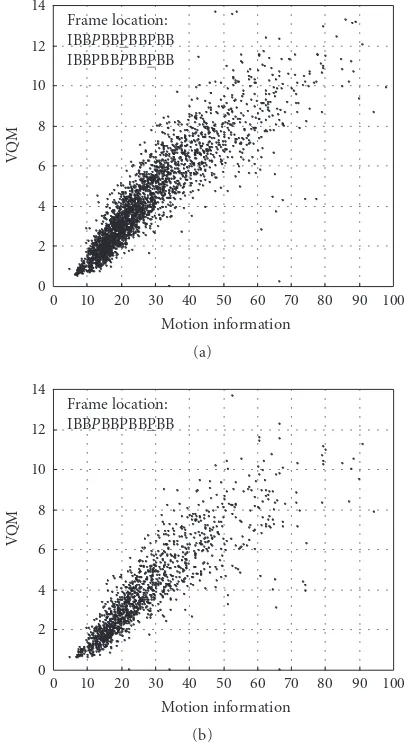
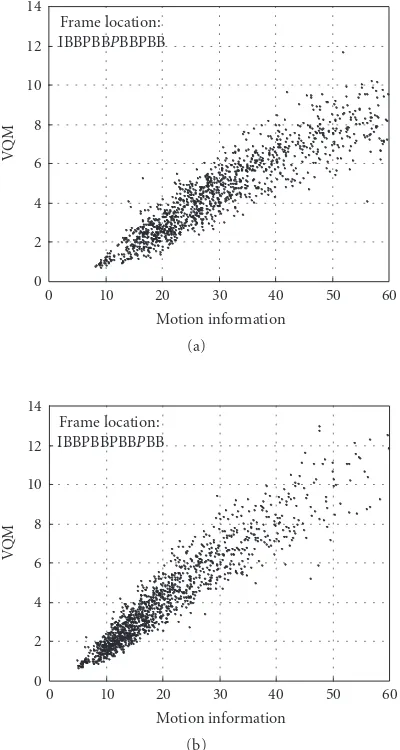
Figure 5illustrates the relationship between the quality degradation of reconstructed P-frames measured in terms of the VQM metric and the aggregate motion informationμ(t) for the video sequences of theJurassic Parkmovie for a GoP
Frame location: IBBPBBPBBPBB IBBPBBPBBPBB
100 90 80 70 60 50 40 30 20 10 0
Motion information 0
2 4 6 8 10 12 14
VQ
M
(a)
Frame location: IBBPBBPBBPBB
100 90 80 70 60 50 40 30 20 10 0
Motion information 0
2 4 6 8 10 12 14
VQ
M
(b)
Figure5: The relationship between the quality degradationsQ(t+ 3) andQ(t+ 6) and the aggregate motion informationμ(t) (the lost frame is indicated in italic font, while the considered affected frame is underlined).
withL = 3 andK = 3. The quality degradation of the P-frame at time instancet+ 3 and the quality degradation of the P-frame at time instancet+ 6 are considered. The Pear-son correlation coefficients for these relationships (between x-axis andy-axis data inFigure 5) are 0.893 and 0.864, re-spectively, which supports the suitability of motion informa-tion descriptors for estimating the P-frame quality degrada-tion.
3.3.2.2 Analysis of quality degradation of subsequent B-frames
reference frame with indext+L. Forward motion vectors are used to refer to the previous reference frame, while backward motion vectors are used to refer to the next reference frame. Due to the imperfections of the motion estimation, a resid-ual errore(t,k) is needed. The luminance value of the pixel at positionkmof a B-frame at time instancet+mcan thus be expressed as
Ft+m,km=vft+m,km Ft+ (n−1)L,in−1
+vbt+m,km Ft+nL,in+et+m,km, (15)
wherem= −(L−1),−(L−2),. . .,−1, 1, 2,. . ., (L−1),L+ 1,. . ., 2L−1,. . .2L+ 1,. . .2L+L−1,. . .(K−1)L+ 1,. . ., (K− 1)L+L−1,n = (m/L), andvf (t,k) andvb(t,k) are the indicator variables of forward and backward motion predic-tion as defined inSubsection 2.2.
There are three different cases to consider.
Case 1. The pixels of the considered B-frame are referenc-ing the error-free frame by forward motion vectors and the lost P-frame with backward motion vectors. Using the ap-proximation of P-frame pixels (12), the B-frame pixels can be represented as
Ft+m,km=vft+m,km Ft−L,i−1
+vbt+m,km Ft,i0+et+m,km.
(16)
The lost P-frame at time instancetis concealed by copying from the previous reference frame at time instancet–L. The reconstructed B-frames can thus be expressed as
Ft+m,km=vft+m,km Ft−L,i−1
+vbt+m,km Ft−L,i0+et+m,km. (17)
Hence, the average absolute difference between the recon-structed B-frame and the loss-free B-frame is given by
Δ(t+m)=N1 N
km=1
vbt+m,km Ft,i0−Ft−L,i0.
(18)
Case 2. The pixels of the considered B-frame are motion-estimated from reference frames, both of which are affected by the P-frame loss. Using the approximation of the P-frame pixels (12), the B-frame pixels can be represented as
Ft+m,km
=vft+m,km
Ft,i0+
n−2
j=0
et+ (n−j)L,in−j
+vbt+m,km
Ft,i0+
n−1
j=0
et+ (n−j)L,in−j
+et+m,km.
(19)
The vector (in−1,in−2,. . .,i0) represents the trajectory of pixel kmusing backward motion estimation until reaching the lost
P-frame, while the vector (in−2,in−3,. . .,i0) represents the trajectory of pixelkm using forward motion estimation un-til reaching the lost P-frame. P-frame losses are concealed by copying from the previous reference frame, so that the recon-structed B-frame can be expressed as
Ft+m,km
=vft+m,km
Ft−L,i0+
n−2
j=0
et+ (n−j)L,in−j
+vbt+m,km
Ft−L,i0+
n−1
j=0
et+ (n−j)L,in−j
+et+m,km.
(20)
Thus, the average absolute difference between the recon-structed B-frame and the loss-free B-frame is given by
Δ(t+m)= N1
N
km=1
vbt+m,km+vft+m,km
× Ft,i0−Ft−L,i0.
(21)
Case 3. The pixels of the considered B-frame are referencing the error-free frame (i.e., I-frame of next GoP) by backward motion vectors and to the lost P-frame using forward motion vectors. Using the approximation of the P-frame pixels (12), the B-frame pixels can be represented as
Ft+m,km=vft+m,km Ft+RL,iR
+vbt+m,km Ft+ (R+ 1)L,iR+1
+et+m,km,
Ft+m,km
=vft+m,km
Ft,i0+
R−1
j=0
et+ (R−j)L,iR−j
+vbt+m,km Ft+ (R+ 1)L,iR+1
+et+m,km, (22)
whereRis the number of affected (subsequent) P-frames that are affected by the P-frame loss at time instancetandF(t+ (R+ 1)L,i) is the I-frame of the next GoP.
The reconstructed B-frames can be expressed as
Ft+m,km
=vft+m,km
Ft−L,i0+
R−1
j=0
et+ (R−j)L,iR−j
+vbt+m,km Ft+ (R+ 1)L,iR+1
Thus, the average absolute difference between the recon-structed B-frame and the loss-free B-frame is given by
Δ(t+m)=N1 N
km=1
vft+m,km Ft,i0−Ft−L,i0.
(24)
The preceding analysis suggests that the following aggregate motion information descriptors achieve a high correlation with the quality degradation of the B-frames.
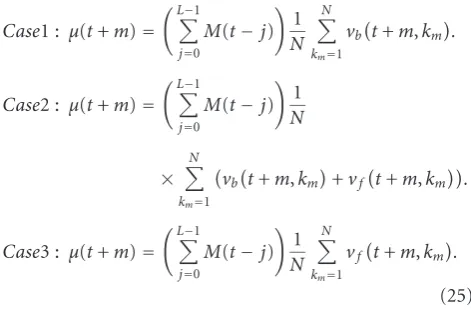
Case1 : μ(t+m)=
L−1
j=0
M(t−j)
1 N
N
km=1
vbt+m,km.
Case2 : μ(t+m)=
L−1
j=0
M(t−j)
1 N
×
N
km=1
vbt+m,km+vft+m,km.
Case3 : μ(t+m)=
L−1
j=0
M(t−j)
1 N
N
km=1
vft+m,km.
(25)
The first summation term in these equations represents the aggregate motion informationμ(t) between the lost P-frame and its preceding reference P-frame (see (2)). The second summation term represents the ratio of the backward motion estimationVb(t+m), the ratio of non-intra-coding (which we approximate as one in the proposed prediction method), and the ratio of forward motion estimationVf(t+m) in the B-frame, respectively, as summarized in (5)–(7).
Figure 6 shows the correlation between the aggregate motion information μ(t+m) and the quality degradation of B-frames for the loss scenario presented in Figure 4. The Pearson correlation coefficients for these relationships (shown in Figure 6) are 0.899, 0.925, 0.905, and 0.895, re-spectively, which indicates the ability of the motion informa-tion descriptors to estimate the reconstructed qualities of the affected B-frames.
3.4. Quality degradation at GoP level
The frame level predictor requires a predictor for each frame in the GoP. This fine-grained level of quality prediction may be overly detailed for practical evaluations and be complex for some video communication schemes. Another quality predictor can be applied at the GoP level, whereby the qual-ity degradation is estimated for the entire GoP. When a frame loss occurs in a GoP, a summarization of the motion infor-mation across all affected frames of the GoP is computed. This can be accomplished by using (2), (5), (6), and (7), and averaging over all ((R+ 2)L−1) frames that suffer a quality degradation due to a P-frame loss at time instancet:
μ= 1
(R+ 2)L−1
RL−1
n=−(L−1)
μ(t+n). (26)
To see this, recall thatRP-frames are affected by the loss due to error propagation from the lost P-frame, for a total ofR+1 P-frames with quality degradations. Also, recall that (L−1) B-frames are coded between P-B-frames for a total of (R+2)(L−1) affected B-frames.
Figure 7 shows the average quality degradation (mea-sured using the VQM metric) for the GoP, where the x -axis represents the summarization of the motion informa-tion μ. Three illustrative simulations were conducted, cor-responding to 1st P-frame loss, 2nd P-frame loss, and 3rd P-frame loss. Similarly to the functional approximations of Subsection 2.2.2, the quality degradation of the GoP can be approximated by a linear or logarithmic function of the av-eraged aggregate motion informationμ. The functional ap-proximations can be represented by the triplets (ϕGoP
r ,aGoPr ,
bGoP
r ),r=1,. . .,K.
3.5. Quality degradation at shot level
The next coarser level in the logical granularity of a video sequence after the GoP level is the shot level, which can pro-vide networking researchers with a rough approximation of the reconstructed quality. For the shot level analysis, we em-ploy the motion activity levelθ, which correlates well with the human perception of the motion intensity in the shot.
Table 3 shows the average quality degradation (per af-fected frame in the entire video shot) using the VQM metric for various shot activity levels, for 3 different types of P-frame losses (1st P-frame loss, 2nd P-frame loss, or 3rd P-frame loss). Frame losses in shots with high motion activity levels result in more severe quality degradation, compared to the relatively mild degradation of shots with low motion activity levels.Table 3also illustrates that the average quality degra-dation of a shot depends on the position of the lost frame. For example, the average quality degradation when losing the 2nd P-frame is 3.84, while the average quality degradation when losing the 3rd P-frame is 3.45. Therefore, when a video shot experiences a P-frame loss, the quality degradation can be determined (usingTable 3) based on the location of the P-frame loss as well as the motion activity level of the video shot. For each video in the video trace library, a table that follows the template ofTable 3 can be used to approximate the quality degradation in the video shot.
4. ANALYSIS OF QUALITY DEGRADATION WITH LOSS CONCEALMENT BY FREEZING
Frame location:
··BBPBB··
60 50 40 30 20 10 0
Motion information 0
2 4 6 8 10 12
VQ
M
(a)
Frame location:
··BBPBB··
60 50 40 30 20 10 0
Motion information 0
2 4 6 8 10 12
VQ
M
(b)
Frame location:
··BBPBB··
60 50 40 30 20 10 0
Motion information 0
2 4 6 8 10 12
VQ
M
(c)
Frame location:
··BBPBB··
60 50 40 30 20 10 0
Motion information 0
2 4 6 8 10 12
VQ
M
(d)
Figure6: The relationship between the quality degradationsQ(t−2),Q(t−1),Q(t+ 1), andQ(t+ 2), and the aggregate motion information μ(t−2),μ(t−1),μ(t+1), andμ(t+2), respectively (the lost frame is indicated in italic font, while the considered affected frame is underlined).
section. For the GoP structure inFigure 4, for instance, if the 2nd P-frame is lost during transmission, 8 frames will be frozen. Human viewers perceive such quality degradation as jerkiness in the normal flow of the motion. We use a percep-tual metric, namely, VQM, to estimate this motion jerkiness in our illustrative experiments since a perceptual metric is better suited than the conventional PSNR metric for measur-ing this quality degradation. In the followmeasur-ing, we present the method for calculating the composite motion information for the frozen frames.
Assuming that the P-frame at time instancetis lost dur-ing the video transmission and that there areRaffected P-framest+L,. . .,t+RLin the GoP before the next I-frame, the reference frame at time instancet–Lis frozen for a total ofRL+ 2L−1 frames. The difference between the error-free frames and the frozen frames can be calculated as
Δ(t+n)=N1
N
i=1
F(t+n,i)−F(t−L,i) (27)
forn= −(L−1),−(L−2),. . ., 0, 1, 2,. . .,RL+L−1.
This equation demonstrates that the quality degradation for this type of decoder can be estimated from the motion in-formation between the error-free framet+nand the frozen framet–L. This effect is captured with the aggregate motion information descriptor
γ(t+n)= n
k=−(L−1)
M(t+k). (28)
The degree of temporal quality degradation depends on the length of the sequence of frozen frames as well as the amount of lost motion information. Therefore, estimating the quality degradation for each individual frozen frame is not useful. Instead, we consider a GoP level predictor and a shot level predictor.
4.1. Quality degradation at GoP level
Frame location: IBBPBBPBBPBB
60 50 40 30 20 10 0
Motion information 0
1 2 3 4 5 6 7 8 9 10
VQ
M
(a) 11 degraded frames
Frame location: IBBPBBPBBPBB
60 50 40 30 20 10 0
Motion information 0
1 2 3 4 5 6 7 8 9 10
VQ
M
(b) 8 degraded frames
Frame location: IBBPBBPBBPBB
60 50 40 30 20 10 0
Motion information 0
1 2 3 4 5 6 7 8 9 10
VQ
M
(c) 5 degraded frames
Figure7: The relationship between the average quality degradation in the GoP and the average aggregate motion informationμusing concealment by copying (the lost frame is indicated in italic font).
motion information
γ=RL 1 + 2L−1
RL+L−1
i=−(L−1)
γ(t+n). (29)
Table3: The average quality degradation (per affected frame) for each motion activity level for shots fromJurassic Parkwith conceal-ment by copying.
Activity Video 1st P-frame 2nd P-frame 3rd P-frame
level shots # loss loss loss
1 12 1.670 1.558 1.354
2 24 2.967 2.813 2.443
3 45 4.459 4.425 3.989
4 12 5.359 5.461 5.199
5 2 7.264 7.451 5.968
All shots 95 3.896 3.844 3.455
The quality degradation can be approximated as a linear or logarithmic function ofγ.
Figure 8shows the relationship between the average qual-ity degradation of the underlying GoP, and the average aggre-gate motion information descriptor for different P-frame loss scenarios. The Pearson correlation coefficients for these rela-tionships are 0.929 for freezing the 2nd P-frame, and 0.938 for freezing the 3rd P frame. According to the GoP structure shown inFigure 4, the 1st P-frame loss results in the freez-ing of 11 frames of the GoP, and therefore reduces the frame rate from 30 fps to 2.5 fps. This is very annoying to human perception and it is not considered in our study.
4.2. Quality degradation at shot level
Table 4shows the average quality degradation (per affected frame) for video shots of various motion activity levels. We consider the quality degradation due to losing the 2nd frame, and the quality degradation due to losing the 3rd P-frame.
Freezing lost frames for shots of high motion activity levels results in more severe quality degradation, compared to shots of low motion activity levels. In addition, the aver-age quality degradation is affected by the position of the lost frame. Comparing with Table 3, we observe that the qual-ity degradation due to losing the 2nd P-frame is 3.84 for de-coders that conceal frame losses by copying, while the qual-ity degradation due to losing the 2nd P-frame is 5.45 for decoders that conceal frame losses by freezing. For this qual-ity predictor, when a video shot experiences a P-frame loss, the quality degradation is determined (usingTable 4) based on the location of the P-frame loss as well as the motion ac-tivity level of the video shot.
5. EVALUATION OF QUALITY PREDICTION USING VQM METRIC
Frame location: IBBPBBPBBPBB
60 50 40 30 20 10 0
Motion information 0
2 4 6 8 10 12 14
VQ
M
(a)
Frame location: IBBPBBPBBPBB
60 50 40 30 20 10 0
Motion information 0
2 4 6 8 10 12 14
VQ
M
(b)
Figure8: The relationship between the average quality degradation Q(t) in the GoP and the average aggregate motion informationγ using concealment by frame freezing (the lost frame is indicated in italic font).
compared with the actual quality degradation, determined from experiments with the actual video bit streams. The video test sequences used in the evaluation in this section are extracted from the Jurassic Park I movie as detailed in Subsection 3.1. InSubsection 5.1we consider error conceal-ment by copying from the previous reference frame (as an-alyzed inSection 3) and inSubsection 5.2we consider error concealment by frame freezing (as analyzed inSection 4).
5.1. Evaluation of quality prediction for loss concealment by copying
P-frame losses are the most common type of frame losses that have a significant impact on the reconstructed quality. We have therefore conducted three different evaluations, corre-sponding to 1st frame loss, 2nd frame loss, and 3rd P-frame loss.
Table4: The average quality degradation for each shot activity level (freezing).
Activity level 2nd P-frame freezing 3rd P-frame freezing
1 2.389 1.936
2 4.115 3.306
3 6.252 5.239
4 7.562 6.748
5 9.524 7.914
All shots 5.450 4.573
Jurassic Park
140 120 100 80 60 40 20 0
Frame number 0
2 4 6 8 10 12 14 16 18
VQ
M
Rec. (shot 48) Est. (shot 48)
Rec. (shot 55) Est. (shot 55)
Figure9: Comparison between actual reconstructed quality and es-timated quality per each frame (2nd P-frame is lost in each GoP) for concealment by copying.
5.1.1. Prediction at frame level
Table5: The absolute difference (in VQM) between actual recon-structed quality and estimated quality using frame level analysis for concealment by copying.
Activity 1st P-frame loss 2nd P-frame loss 3rd P-frame loss level
1 0.434 0.361 0.315
2 0.600 0.578 0.469
3 0.859 0.807 0.764
4 1.252 1.326 1.309
5 1.871 1.948 1.948
All shots 0.696 0.650 0.607
Jurassic Park
19 17 15 13 11 9 7 5 3 1
GoP number 0
2 4 6 8 10 12 14
VQ
M
Rec. (shot 48) Est. (shot 48)
Rec. (shot 55) Est. (shot 55)
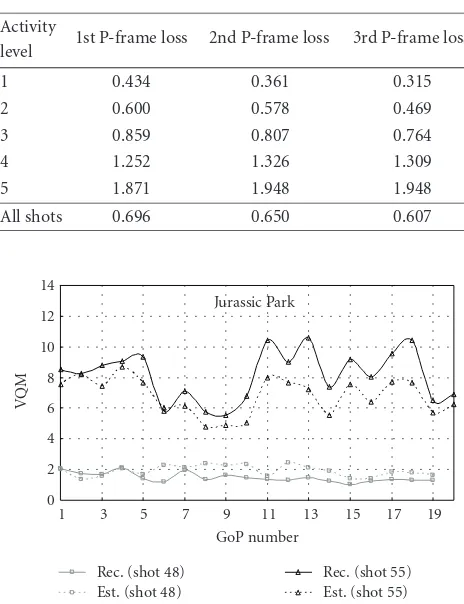
Figure10: Comparison between actual reconstructed quality and estimated quality per each GoP (2nd P-frame is lost in each GoP) for concealment by copying.
The position of the lost frame has a significant impact on the accuracy of the quality prediction. For example, the ac-curacy of the quality predictor increases when fewer frames are affected. In particular, when losing the 1st P-frame the accuracy of the quality prediction is around±0.6963, while it is around±0.6073 when losing the 3rd P-frame. The activ-ity levels 4 and 5 do not follow this general trend of increas-ing prediction accuracy with fewer affected frames, which is primarily due to the small number of shots of activity lev-els 4 and 5 in the test video (see Table 3) and the result-ing small statistical validity. The more extensive evaluations inSection 6confirm the increasing prediction accuracy with decreasing the number of affected frames for all activity levels (see in particular Tables11,12, and13).
5.1.2. Prediction at GoP level
Figure 10shows the performance of the GoP level predictor (seeSubsection 3.4), compared to the actual quality degrada-tion. The performance over two video shots of motion activ-ity level 1 (shot 48), and of motion activactiv-ity level 3 (shot 55) is shown.Table 6shows the average absolute difference be-tween the GoP quality predictor that uses the advanced video traces and the actual quality degradation. Similarly to the
Table6: The absolute difference (in VQM) between actual recon-structed quality and estimated quality using GoP level analysis for concealment by copying.
Activity 1st P-frame loss 2nd P-frame loss 3rd P-frame loss level
1 0.418 0.369 0.363
2 0.568 0.542 0.477
3 0.761 0.676 0.699
4 1.055 1.231 1.386
5 1.660 1.876 1.683
All shots 0.643 0.607 0.606
frame level predictor, Table 6shows that better accuracy is achieved when shots are of lower motion activity level. Com-paring the results shown in Tables5and6, we observe that more accurate estimates of the quality degradation are pro-vided by GoP level predictors. This is because the frame level predictor estimates the quality degradation for each frame type and for each frame position in the GoP, which results in an accumulated estimation error for the entire GoP. On the other hand, the GoP level predictor estimates the quality degradation for a GoP by a single approximation. In the case of 1st P-frame loss (where 11 frames are affected by the frame loss and hence 11 approximations are used for the frame level predictor), the accuracy of the GoP level predictor is about 0.643, while the accuracy of the frame level predictor is about 0.696. However, in the case of 3rd P-frame loss (where only 5 frames are affected by the frame loss), the reduction of the estimation error with the GoP level predictor is marginal.
5.1.3. Prediction at shot level
Figure 11(a) shows the performance of the shot level pre-dictor (see Subsection 3.5) compared to the actual qual-ity degradation, when the 2nd P-frame in each GoP is lost during video transmission.Figure 11(b)shows the motion activity level for each video shot. Table 7 shows the accu-racy of the shot level predictor. Similarly to frame level and GoP level predictors, improvements in predicting the quality degradation are achieved with shots of lower motion activity level. In general, the accuracy of the shot level predictor is im-proved when a frame loss is located close to the subsequent correctly received I-frame, because it does not affect many subsequent frames. Comparing the results of Tables5,6, and 7, the quality prediction using shot level analysis does not provide any added accuracy compared to the quality predic-tion using frame level analysis, or the quality predicpredic-tion us-ing GoP level analysis. The quality prediction usus-ing the GoP level analysis is the best, in terms of the accuracy of the qual-ity degradation estimate, and the speed of the calculation.
5.2. Evaluation of quality prediction for loss concealment by freezing
Table7: The absolute difference (in VQM) between actual recon-structed quality and estimated quality using shot level analysis for concealment by copying.
Activity 1st P-frame loss 2nd P-frame loss 3rd P-frame loss level
1 0.719 0.619 0.586
2 1.216 1.187 1.092
3 1.647 1.597 1.529
4 1.976 2.015 2.356
5 2.638 2.070 2.204
All shots 1.482 1.431 1.417
Jurassic Park
22 20 18 16 14 12 10 8 6 4 2
Shot number 0
2 4 6 8 10 12
VQ
M
Rec. Est.
(a)
Jurassic Park
22 20 18 16 14 12 10 8 6 4 2
Shot number 1
2 3 4 5
Ac
ti
vi
ty
le
ve
l
(b)
Figure11: (a) Comparison between actual reconstructed quality and estimated quality per each shot (2nd P-frame is lost in each GoP); and (b) motion activity level of the video shots.
5.2.1. Prediction at GoP level
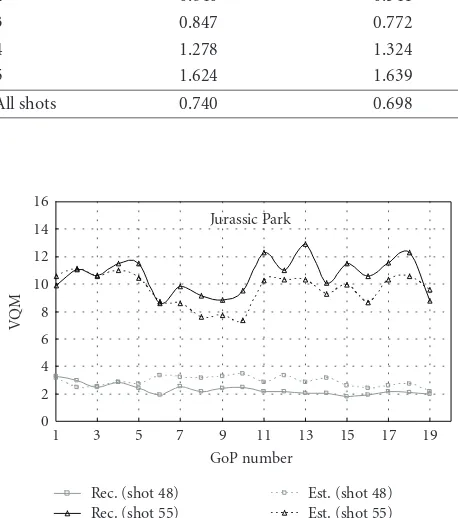
Figure 12shows the performance of the GoP level predictor (seeSubsection 4.1), compared to the actual quality degra-dation, when the 2nd P-frame is lost during video transmis-sion. The performance over two video shots of motion activ-ity level 1 (shot 48) and of motion activactiv-ity level 3 (shot 55) is shown.Table 8shows the average absolute difference
be-Table8: The absolute difference (in VQM) between actual recon-structed quality and estimated quality using GoP level analysis for concealment by freezing.
Activity level 2nd P-frame freezing 3rd P-frame freezing
1 0.542 0.537
2 0.640 0.541
3 0.847 0.772
4 1.278 1.324
5 1.624 1.639
All shots 0.740 0.698
Jurassic Park
19 17 15 13 11 9 7 5 3 1
GoP number 0
2 4 6 8 10 12 14 16
VQ
M
Rec. (shot 48) Rec. (shot 55)
Est. (shot 48) Est. (shot 55)
Figure12: Comparison between actual reconstructed quality and estimated quality per each GoP (2nd P-frame is lost in each GoP) for concealment by freezing.
tween the GoP quality predictor and the actual quality degra-dation. In the case of losing the 3rd P-frame, where the aver-age quality degradation for this type of decoder is 4.573 (see Table 4), the accuracy of the GoP quality predictor is about ±0.698 using the VQM metric. When the 2nd P-frame is lost, the accuracy of the GoP level predictor for decoders that con-ceal losses by copying is 0.6, while the accuracy of GoP level predictor for decoders that conceal losses by freezing is 0.74 (compareTable 6 toTable 8). These results suggest that (1) decoders that conceal losses by copying provide better re-constructed quality (compare the results of Tables3and4), and (2) quality predictions derived from the advanced video traces are better for decoders that conceal losses by copying.
5.2.2. Prediction at shot level
Jurassic Park
22 20 18 16 14 12 10 8 6 4 2
Shot number 0
2 4 6 8 10 12 14 16
VQ
M
Rec. Est.
Figure13: Comparison between actual reconstructed quality and estimated quality per each shot (2nd P-frame is lost in each GoP) for concealment by freezing.
are affected by the channel loss. Comparing the results of Tables8and9, we observe that the accuracy of quality pre-diction using shot level analysis is significantly lower than the accuracy of quality prediction using GoP level analysis.
6. EVALUATION OF QUALITY PREDICTION USING PSNR METRIC
According to the results obtained with the VQM metric in Section 5, the quality prediction for the error concealment by copying and the GoP level quality predictor appear to be the most promising. In this section, we follow up on the ex-ploratory evaluations with the VQM metric by conducting an extensive evaluation of the frame level and GoP level pre-dictors using the PSNR as the quality metric of the recon-structed video. We use the quality predictors analyzed in Sub-sections3.3and3.4for decoders that conceal packet losses by copying from the previous reference frame.
For the extensive evaluations reported in this section, we randomly selected 956 video shots of various durations, ex-tracted from 5 different video programs (Terminator,Star Wars,Lady and Tramp, Tonight Show,andFootball with Com-mercial). The shots were detected and their motion activ-ity levels were determined using the procedure outlined in Subsection 3.1.Table 10shows the motion characteristics of the selected video shots. Shots of motion activity level 5 are rare in these video programs and have typically short dura-tion. For television broadcasts and kids programs, shots of motion activity level 2 are common; see results of Tonight ShowandLady and Tramp. However, for sports events and movie productions, shots of motion activity level 3 are com-mon; see results ofStar Wars,Terminator, andFootball WC.
For these 5 video programs, the advanced video traces are composed of (i) the frame size in bits, (ii) the quality of the encoded video (which corresponds to the video quality of loss-free transmission) in PSNR, (iii) the motion infor-mation descriptorM(t) between successive frames, which is calculated using (1), (iv) the ratio of forward motion
estima-Table9: The absolute difference (in VQM) between actual recon-structed quality and estimated quality using shot level analysis.
Activity level 2nd P-frame freezing 3rd P-frame freezing
1 0.934 0.727
2 1.552 1.329
3 2.08 1.891
4 2.440 2.355
5 1.927 2.256
All shots 1.842 1.666
tionVf(t), and (v) the motion activity levelθof the under-lying video shot. These video traces are used by the quality predictors to estimate the quality degradation due to frame losses.
6.1. Frame level predictor for concealment by copying
The quality predictor presented inSubsection 3.3is used to estimate the reconstructed qualities when the video trans-mission suffers a P-frame loss. We have conducted three dif-ferent evaluations for 1st P-frame loss, 2nd P-frame loss, and 3rd P-frame loss. Tables11,12, and13show (i) the mean ac-tual quality reduction in dB, that is, the average difference be-tween the PSNR quality of the encoded video and the PSNR quality of the actual reconstructed video, and (ii) the mean absolute prediction error in dB, that is, the average absolute difference between the actual quality reduction in dB and the predicted quality reduction for the frame level quality pre-dictor for each motion activity level, and for the whole video sequence. (We note that for the PSNR metric the quality degradationQis defined asQ=(encoded quality−actual re-constructed quality)/encoded quality for the analysis in Sec-tions2–4; for ease of comprehension we report here the qual-ity reduction=encoded quality−actual reconstructed qual-ity.) We observe that the proposed quality predictor gives a relatively good approximation of the actual quality degrada-tion. We observe fromTable 13, for instance, that for the Ter-minatormovie, where the actual quality reduction is about 9.4 dB when losing the 3rd P-frame, the frame level quality predictor estimates the reconstructed qualities with an accu-racy of±1.4 dB around the actual value.