Original Article
Serum cystatin C and Chemerin
levels in diabetic retinopathy
Xuedong Chen1, Shiyong Zhao2, Tian Yu3, Liqiong Zhang1, Qingjun Li1, Yongbin Yu1
1Department of Ophthalmology, The First Affiliated Hospital of Harbin Medical University, Harbin, Heilongjiang, China; 2Department of Hepatopancreatobiliary Surgery, The Second Affiliated Hospital of Harbin Medical Uni-versity, Harbin, Heilongjiang, China; 3Division of Applied Science, School of Medicine and Dentistry, University of Aberdeen, Foresterhill, Aberdeen, The United States of American
Received April 12, 2017; Accepted May 13, 2017; Epub July 15, 2017; Published July 30, 2017
Abstract: Objective: To investigate the levels of serum cystatin C (CysC) and chemokine (Chemerin) in patients with diabetic retinopathy (DR) and their roles in the onset and progression of DR. Methods: A total of 150 diabetic pa-tients were enrolled as subjects and randomly divided into three groups: the proliferative DR (PDR) group (n=50), the non-proliferative DR (NPDR) group (n=50) and the control group (diabetes mellitus (DM) alone, n=50). In addi-tion, 50 healthy adults were selected as normal controls. The four groups of patients were compared in demograph-ic characteristdemograph-ics and biomarkers including gender, age, body mass index (BMI), glycosylated hemoglobin (HbA1c), homeostasis model assessment of insulin resistance (HOMA-IR), fasting plasma glucose (FPG), triglyceride (TG), total cholesterol (TC), low density lipoprotein cholesterol (LDL-C), high sensitive C reactive protein (hsCRP), as well as serum cystatin C and Chemerin levels. Besides, Pearson correlation analysis and Logistics regression analysis
were performed. Results: The control group was associated with a significant increase in serum CysC and Chemerin levels as compared with the normal control group; the patients with PDR or NPDR showed significantly higher levels than those with diabetes mellitus (DM) alone; and the ones with PDR had significantly higher levels than those with NPDR. The serum CysC and Chemerin levels were significantly different across groups and increased with the
severity of the disease (P<0.05). Pearson correlation analysis showed that the serum CysC levels were positively associated with systolic blood pressure (SBP), HbA1c, HOMA-IR, FPG, TG, TC and LDL-C (P<0.05), and the serum Chemerin levels were positively associated with BMI, HOMA-IR, urinary albumin and hsCRP (P<0.05). What’s more, the serum CysC levels were also positively associated with the serum Chemerin levels (P<0.05). Multivariate logistic regression analysis indicated that serums CysC and Chemerin were independent risk factors for DR. Conclusion: Elevated serum CysC and Chemerin levels are risk factors for DR, and they play a role in the pathogenesis of DR. Thus they are likely to become potential markers for assessment of DR.
Keywords: Diabetic retinopathy, Cystatin C, Chemerin, diabetes mellitus
Introduction
Diabetic retinopathy (DR), one of the most com-mon complications of diabetes mellitus (DM), is
of clinical significance to improve prevention
and treatment of the disease and reduce the incidence of blindness in patients with DM. It is well-known that DR and diabetic nephropathy belong to hyperglycemia-induced microvascu-lar diseases. Early diagnosis and treatment of DR is the key to prevention and the treatment of this disease. There are no effective biologi-cal parameters for assessment of DR. Cystatin C (CysC) is a low molecular-weight, non-glyco-sylated basic protein belonging to the cystatin
super-family of cysteine proteinase inhibitors. Its main role is to suppress the activity of endogenous cysteine protease. CysC, as a met-abolic intermediate of methionine, is closely related to the onset of diabetic nephropathy. It
is extensively used to assess glomerular filtra
-tion, which has been confirmed in the studies
[1]. However, the studies on the association between CysC and diabetic microangiopathy are limited to diabetic nephropathy, and few studies are involved in the effect of CysC on the progression of DR. In addition, both national and international studies show that retinal
inflammation is characteristic of DR. Chemerin
immuno-lesion response by binding to many inflamma -tory cytokines [2, 3]. In recent years, studies have demonstrated that elevated serum Chemerin levels lead to insulin resistance and are involved in the pathogenesis of diabetic microangiopathy [4]. However, whether it is related to DR remains controversial, and there are few reports about it. The present study was designed to analyze the serum CysC and Chemerin levels in patients with DR, and to investigate the relationship between CysC, Chemerin and DR.
Materials and methods
Demographic characteristics
A total of 150 patients with DM treated in our hospital from January 2014 to December 2016 were enrolled as the subjects in this retrospec-tive study. All the patients met the diagnosis criteria listed in China Guidelines for Type 2 Diabetes (Version 2010), and met the require-ments in this study. According to the Diabetic Retinopathy Staging Criteria created by the Ocular Fundus Disease Branch of Chinese Medical Association in 1984 and the results of
ophthalmoscopy and fluorescein fundus angi -ography, the subjects were divided into three groups: 50 were in the proliferative diabeticret-inopathy (PDR) group, whose ocular fundi showed neovascularization, vitreous hemor-rhage or pre-retinal hemorhemor-rhage; 50 were in the non-proliferative DR (NPDR) group whose ocu-lar fundi showed microaneurysms, more than 20 events of intra-retinal hemorrhage in any quadrant, vein beaded changes in more than
two quadrants or significant intra-retinal micro -vascular abnormalities in more than one quad-rant; 50 were in the control group whose ocular fundi showed no abnormalities. Any patient presented any one of the following conditions was excluded: autoimmune diseases, connec-tive tissue diseases, cerebrovascular diseases, liver and kidney dysfunction, malignant tumor, acute and chronic infections, diabetes and chronic complications, pregnancy and ocular diseases for any other causes, or recently treat-ed with large doses of hormone agents or eye surgery. In addition, 50 healthy adults were selected in the normal control group. All the healthy subjects had no hypertension, coronary heart disease, diabetes or any other disease history affected the results of the study. This study was in accordance with the medical
eth-ics principles of the hospital, and qualified in
the ethical reviews. All participants signed the informed written consents.
Study methods
Ophthalmoscopy
Direct ophthalmoscope was used to check first
the macula regions and the posterior pole, and then the peripheral parts in order from the nasal, superior, temporal to lower retina.
Fluorescein fundus angiography
Fluorescein sodium injection (3 mL) was inject-ed into the ulnar vein of each subject. Ten sec-onds after injection, 10 photographs of the posterior pole were successively shot with a Fule450-type digital retinal camera, followed by orderly shooting at the nine sites including posterior pole, temporal, nasal, superior, and lower, above and below the nose, above and below the temple at 1, 3, 5, and 10 minutes respectively. Finally at 20 minutes, the needed photographs were processed using the com-puter image processing software.
Determination of CysC and Chemerin
The venous blood sample (5 mL) was collected from each fasting subject in the early morning. After 30 minutes without shaking, the samples were centrifuged, from which serum was sepa-rated and cryopreserved for detection. With the use of enzyme linked immunosorbent assay (ELISA), serum CysC and Chemerin levels were detected in strict accordance with the instruc-tions of the human CysC and Chemerin kits (Shanghai Vinhaket Biological Technology Co. Ltd). Serum CysC and Chemerin levels were compared among subjects from the four groups.
Monitoring parameters
=FPG * fasting insulin/22.5. The factor includ-ing general information, clinical and biomarkers including gender, age, BMI, duration of disease, SBP, DBP, HbA1c, HOMA-IR, FPG, TG, TC, LDL-C, HDL-C, urinary albumin and hsCRP were com-pared among the subjects in the 4 groups.
Statistical analysis
The data analysis in the study was performed using SPSS software, version 12.0. The mea-surement data with normal distribution were presented as mean ± S.D, and the inter-group differences were compared using univariate analysis of variance (ANOVA). The qualitative data were expressed as percentages, and the inter-group differences were compared using the chi-square test. The associations of serum CysC and Chemerin levels with all other param-eters were assessed with the use of Pearson correlation analysis. Multivariate logistic re- gression analysis was applied to determine independent risk factors for DR.
Results
Demographic characteristics of patients across groups
There were no significant differences in gender
and age among the patients across groups.
BMI and systolic blood pressure were signifi -cantly different when the PDR group, the NPDR group and the diabetes control group were compared with the normal control group,
respectively. The patients with PDR had signifi -cantly higher SBP values than those with
DMalone (P<0.05), and also had significantly
higher DBP values than those of normal con-trols (P<0.05; Table 1).
Comparison of biomarkers across groups
There were significantly reductions in HOMA-IR,
urinary albumin and hsCRP levels among the patients in the PDR group, the NPDR group, the control group and the normal control group (P<0.05). Compared with the normal control group, the levels of HbA1c, FPG, TG, TC, LDL-C
improved significantly among the patients in
the PDR group, the NPDR group and the control group (P<0.05). The HbA1c, TC and FPG levels
were significantly higher in the PDR group than
in the control group (P<0.05; Table 2).
Serum cystatin C levels in all groups
The serum CysC levels of the patients with
DMalone (0.68±0.04 mg/L) were significantly
[image:3.612.90.525.85.152.2]higher than those of the normal controls (0.32±0.02 mg/L) but markedly lower than the Table 1. Demographic characteristics of patients across groups
Groups Gender (Male/Female) (n) Age (years) BMI (kg/m2) SBP (mmHg) DBP (mmHg)
PDR 27/23 48.9±7.2 26.4±2.46* 139.56±14.71*,# 79.31±10.21*
NPDR 26/24 47.8±7.7 25.6±2.51* 135.72±15.32* 75.72±9.82
Control 28/22 49.1±6.9 25.2±2.44* 130.11±10.64* 75.54±8.91
Normal control 25/25 50.1±6.7 21.6±1.96 121.15±9.67 73.20±4.76
Note: *P<0.05 for the comparison with the normal control group; #P<0.05 for the comparison with the diabetes control group.
Table 2. Comparison of biomarkers across groups
Parameters PDR NPDR Controls Normal controls
HbA1c (%) 9.96±2.55*,# 9.58±2.21* 9.22±2.11* 4.42±0.32
HOMA-IR 7.92±2.31*,#,Δ 6.85±2.26*,# 5.97±1.94* 1.69±0.26
FPG (mmol/L) 9.62±3.44*,# 9.31±2.83* 7.64±4.16* 4.79±0.79
TG (mmol/L) 2.40±1.94* 2.25±2.45* 2.04±1.31* 1.19±0.28
TC (mmol/L) 5.70±1.22*,# 5.58±0.91* 5.34±0.94* 4.42±0.66
LDL-C (mmol/L) 3.35±0.86* 3.05±0.69* 3.11±0.77* 2.65±0.49
HDL-C (mmol/L) 1.30±0.41 1.20±0.40 1.16±0.37 1.23±0.32
Urinary albumin (mg/24 h) 359±91.21*,#,Δ 50±11.92*,# 23±6.32* 3±2.24
hsCRP (mg/L) 1.83±0.58*,#,Δ 1.25±0.23*,# 0.78±0.16* 0.14±0.06
Note: *P<0.05 for the comparison with the normal control group; #P<0.05 for the comparison with the control group; ΔP<0.05
[image:3.612.92.523.198.331.2]patients with NPDR (0.98±0.05 mg/L) and those with PDR (1.46±0.06 mg/L). Moreover,
the serum CysC levels were significantly higher
in the patients with PDR than in those with NPDR (P<0.05), on an escalating increase with the severity of disease (Figure 1).
Analysis on serum Chemerin levels among the patients in each group
There was a gradual decrease in serum Chemerin among the patients with PDR
(43.21±7.12 ng/mL), with NPDR (37.25±6.8 ng/mL), with DMalone (30.04±6.53 ng/mL), and normal controls (11.65±8.41 ng/mL), respectively. The inter-group difference in
serum Chemerin level was statistically signifi -cant (P<0.05; Figure 2).
Analyses on the correlations of serum CysC and Chemerin levels to other parameters
[image:4.612.91.289.71.243.2]Pearson correlation analysis showed that the serum CysC levels were positively associated with SBP, HbA1c, HOMA-IR, FPG, TG, TC and LDL-C (r shows 0.515, 0.365, 0.278, 0.424, 0.586, 0.639, 0.470, respectively, P<0.05; Table 3). The serum Chemerin levels were posi-tively associated with BMI, HOMA-IR, urinary albumin and hsCRP (r shows 0.314, 0.238, 0.648, 0.421, respectively, P<0.05). What’s more, CysC levels were also positively correlat-ed with Chemerin levels (r shows 0.863, P=0.002; Table 4).
Multivariate logistic regression analysis
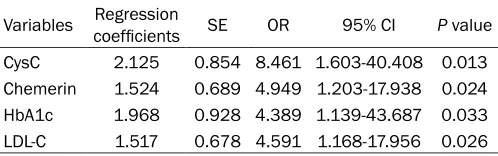
[image:4.612.322.523.96.217.2]Multivariate logistic regression analysis, taken with or without DR as dependent variables and gender, age, BMI, blood pressure, HbA1c, FPG, TG, TC, LDL-C, HDL-C, HOMA-IR, urinary albu-min, hsCRP, serums CysC and Chemerin as independent variables, showed that CysC,
Figure 1. Comparison of expression levels of serum CysC among the patients in all the groups. *P<0.05
for the comparison with the normal control group;
#P<0.05 for the comparison with the control group;
[image:4.612.326.523.263.342.2]ΔP<0.05 for the comparison with the NPDR group.
Figure 2. Comparison of expression levels of se-rum Chemerin among the patients in all the groups.
*P<0.05 for the comparison with the normal control
group; #P<0.05 for the comparison with the control
group; ΔP<0.05 for the comparison with the NPDR
group.
Table 3. Correlations of serum CysC levels and other parameters
CysC
r value P value
SBP 0.515 0.008
HbA1c 0.365 0.016 HOMA-IR 0.278 0.021
FPG 0.424 0.011
TG 0.586 0.006
TC 0.639 0.004
LDL-C 0.470 0.009
Table 4. Correlations of serum Chemerin levels and other parameters
Chemerin
r value P value
BMI 0.314 0.014
[image:4.612.91.288.329.499.2]Chemerin, LDL-C and HbA1c were risk factors for DR, and CysC and Chemerin were indepen-dent risk factors for DR (Table 5).
Discussion
Chronic inflammation plays a crucial role in the
onset and progression of diabetic
complica-tions. One study found that retinal inflamma -tion is decisive for the pathogenesis of DR.
Inflammatory factors adiponectin and TNF-
alpha made changes in the patient’s aqueous humor adiponectin and serum levels and inter-act with each other, thereby affecting progres-sion of DR [5]. Therefore, it is of value to assess
the severity and prognosis of DR by figuring out specific biological parameters of DR.
CysC is an ideal parameter for glomerular filtra -tion rate [6]. The kidney and micro-vessels of Type 2 diabetic patients have been reported to express serum CysC [7]. Another study report-ed that CysC increases the permeability of reti-nal blood vessels and stimulates the growth of intraocular neovascularization [8]. It enhances
the inflammatory response of the retina, lead -ing to immunolesions. Serum CysC also reduc-es the consumption of glucose, further increas-es the intensity of insulin rincreas-esistance and worsens prognosis [9, 10]. These results sug-gest that CysC is a risk factor for DR. In the present study, serum CysC was detected in patients with PDR, NPDR or diabetic mellitus alone as well as healthy controls. The results showed that the serum CysC levels of the
patients with diabetes alone were significantly
higher than those of the normal controls but markedly lower than the patients with NPDR and those with PDR. Moreover, the serum CysC
levels were significantly higher in patients with
PDR than in those with NPDR, on an escalating increase with the severity of disease. The inter-group difference in serum CysC levels was
sig-nificant. Multivariate logistics regression analy
-emia and hypoxia, and ultimately to the
pres-ence of lesions. As an inflammatory mediator,
serum CysC makes direct damages to the microvascular functions and structure. Another study showed that serum CysC promotes
inflammatory response, and high glucose-induced microvascular inflammatory injury is
the pathogenesis of DR, which further implies that serum CysC is closely related to diabetic microangiopathy [11].
Chemokin as a fat cell factor is involved in the
inflammatory response of the body [12-14]. It
has been found that Chemerin also mediates angiogenesis, which plays an essential role in the onset and progression of DR [15]. Chemerin inhibitor has been found to reduce the levels of serum CysC, tumor necrosis factor alpha and C-reactive protein, which is conducive to
elimi-nation of inflammatory reaction [16]. This sug -gests that high glucose-induced Chemerin release not only makes direct damages to micro-vessels of retina in diabetic mellitus
leading to DR, but also enhances inflammatory response and aggravates inflammatory dam -ages to DR. The results of the present study showed that the serum Chemerin levels increased with the aggravation of DR. Pearson correlation analysis showed that serum Ch- emerin levels were positively associated with CysC levels, and Chemerin is one of the inde-pendent risk factors for DR. In addition, epide-miological studies show that serum Chemerin levels were higher in patients with type 2 diabe-tes than in those of healthy controls. With effective hypoglycemic treatment, there was a reduction in the serum Chemerin levels and in the intensity of insulin resistance. This further shows that the serum Chemerin levels interact with HOMA-IR [17, 18].
[image:5.612.91.340.97.175.2]Besides, the Pearson correlation analyses on serum CysC and Chemerin levels, demographic characteristics and various parameters showed Table 5. Multivariate logistic regression analysis on risk
factors for DR
Variables Regression coefficients SE OR 95% CI P value CysC 2.125 0.854 8.461 1.603-40.408 0.013 Chemerin 1.524 0.689 4.949 1.203-17.938 0.024 HbA1c 1.968 0.928 4.389 1.139-43.687 0.033 LDL-C 1.517 0.678 4.591 1.168-17.956 0.026
isch-that serum CysC and Chemerin levels were pos-itively associated with HOMA-IR, which fully indicates that the positive correlations of serum CysC and Chemerinin levels to insulin resis-tance in patients with type 2 diabetes aggra-vate dysglycemia. National and international scholars hold that Chemerin promotes the
release of inflammatory factors, such as tumor
necrosis factor alpha, C- reactive protein etc. [19-21]. This suggests that Chemerin may be concomitantly implicated in the pathogenesis of both type 2 diabetes mellitus and insulin
resistance. The findings of the present study
showed that the serum CysC levels were posi-tively associated with HbA1c, HOMA-IR, FPG, TG, TC and LDL-C (P<0.05); and the serum Chemerin levels were positively related to BMI, HOMA-IR, urinary albumin and hsCRP (P<0.05). What’s more, the serum CysC levels were also positively associated with the serum Chemerin levels (P<0.05). This shows that in the onset and progression of DR, elevated CysC and Chemerin levels lead to disorders of lipid metabolism, dysglycemia, and intense insulin resistance, resulting in abnormal microcircula-tion, and ultimately in such lesions as retinal ischemia and hypoxia and neovascularization. This further indicates that changes in serum CysC and Chemerin levels are closely related to
the onset and progression of DR, and of signifi
-cance to the inflammatory response in DR.
Due to the small sample size and single-center in nature, there are still some limitations and selection of bias in the present study. Addition- al multi-centered, large-sampled, randomized controlled studies are required to further improve the research.
In conclusion, significant increases in serum
CysC and Chemerin levels were observed in patients with DR. The serum CysC and Chemerin levels are not only implicated in the onset and progression of DR, but also to a certain extent express the severity of damages to retinopathy in diabetic patients. It indicates that elevated serum CysC and Chemerin levels are risk fac-tors for DR and likely to become a marker for DR.
Acknowledgements
This paper is supported by Postdoctoral Grants of Heilongjiang Province (NO. LBH-Z12186); Postdoctoral Starting Foundation of Heilong-
jiang Province (NO. LRB05-247); the Science and Technology Funds from Heilongjiang Edu- cation Department (No. 12541378).
Disclosure of conflict of interest
None.
Address correspondence to: Yongbin Yu, Depart-
ment of Ophthalmology, The First Affiliated Hospital
of Harbin Medical University, No. 23 Youzheng Street, Harbin 150001, Heilongjiang, China. Tel: +86-0451-85556000; Fax: +86-0451-85556000; E-mail: yongbinyu123@163.com
References
[1] Zhou B, Zou H and Xu G. Clinical utility of se-rum cystatin C in predicting diabetic nephropa-thy among patients with diabetes mellitus: a meta-analysis. Kidney Blood Press Res 2016; 41: 919-928.
[2] Stojek M. The role of chemerin in human dis-ease. Postepy Hig Med Dosw (Online) 2017; 71: 110-117.
[3] Pusparajah P, Lee LH and Abdul Kadir K. Mo-lecular markers of DR: potential screening tool of the future? Front Physiol 2016; 7: 200. [4] El-Mesallamy HO, El-Derany MO and Hamdy
NM. Serum omentin-1 and chemerin levels are interrelated in patients with Type 2 diabetes mellitus with or without ischaemic heart dis-ease. Diabet Med 2011; 28: 1194-1200. [5] Studholme S. Diabetic retinopathy. J Perioper
Pract 2008; 18: 205-210.
[6] Kwon YE, Lee MJ, Park KS, Han SH, Yoo TH, Oh KH, Lee J, Lee KB, Chung W, Kim YH, Ahn C and Choi KH. Cystatin C is better than serum
creatinine for estimating glomerular filtration
rate to detect osteopenia in chronic kidney dis-ease patients. Yonsei Med J 2017; 58: 380-387.
[7] Onopiuk A, Tokarzewicz A and Gorodkiewicz E. Cystatin C: a kidney function biomarker. Adv Clin Chem 2015; 68: 57-69.
[8] He R, Shen J, Zhao J, Zeng H, Li L, Liu F and Jia W. High cystatin C levels predict severe reti-nopathy in type 2 diabetes patients. Eur J Epi-demiol 2013; 28: 775-778.
[9] Uruska A, Araszkiewicz A, Zozulinska-Ziolkie-wicz D, Wegner M, Grzelka A and
Wierusz-Wysocka B. Does serum cystatin C level reflect
insulin resistance in patients with type 1 dia-betes? Clin Biochem 2014; 47: 1235-1238. [10] Lee SH, Park SA, Ko SH, Yim HW, Ahn YB, Yoon
KH, Cha BY, Son HY and Kwon HS. Insulin
cardiovascular disease in type 2 diabetes mel-litus patients. Metabolism 2010; 59: 241-246. [11] Wong CW, Teo BW, Lamoureux E, Ikram MK,
Wang JJ, Tai ES, Sethi S, Wong TY and Sa-banayagam C. Serum cystatin c, markers of chronic kidney disease, and retinopathy in per-sons with diabetes. J Diabetes Res 2015; 2015: 404280.
[12] Bozaoglu K, Bolton K, McMillan J, Zimmet P, Jowett J, Collier G, Walder K and Segal D. Chemerin is a novel adipokine associated with obesity and metabolic syndrome. Endocrinolo-gy 2007; 148: 4687-4694.
[13] Kukla M, Zwirska-Korczala K, Hartleb M, Walu-ga M, Chwist A, Kajor M, Ciupinska-Kajor M, Berdowska A, Wozniak-Grygiel E and Buldak R. Serum chemerin and vaspin in non-alcoholic fatty liver disease. Scand J Gastroenterol 2010; 45: 235-242.
[14] Huang H, Hu L, Lin J, Zhu X, Cui W and Xu W. Effect of fosinopril on chemerin and VEGF ex-pression in diabetic nephropathy rats. Int J Clin Exp Pathol 2015; 8: 11470-11474.
[15] Du J, Li R, Xu L, Ma R, Liu J, Cheng J, Zhang Z and Sun H. Increased serum chemerin levels in DR of type 2 diabetic patients. Curr Eye Res 2016; 41: 114-120.
[16] Lehrke M, Becker A, Greif M, Stark R, Laubend-er RP, von ZieglLaubend-er F, LebhLaubend-erz C, Tittus J, ReisLaubend-er M, Becker C, Goke B, Leber AW, Parhofer KG and Broedl UC. Chemerin is associated with
markers of inflammation and components of
the metabolic syndrome but does not predict coronary atherosclerosis. Eur J Endocrinol 2009; 161: 339-344.
[17] Park SE, Park CY, Sweeney G. Biomarkers of insulin sensitivity and insulin resistance: past, present and future. Crit Rev Clin Lab Sci 2015; 52: 180-90.
[18] Lloyd JW, Zerfass KM, Heckstall EM and Evans KA. Diet-induced increases in chemerin are at-tenuated by exercise and mediate the effect of diet on insulin and HOMA-IR. Ther Adv Endocri-nol Metab 2015; 6: 189-198.
[19] Rama D, Esendagli G and Guc D. Expression of chemokine-like receptor 1 (CMKLR1) on
J744A.1 macrophages co-cultured with fibro
-blast and/or tumor cells: modeling the influ -ence of microenvironment. Cell Immunol 2011; 271: 134-140.
[20] Zylla S, Pietzner M, Kuhn JP, Volzke H, Dorr M, Nauck M and Friedrich N. Serum chemerin
is associated with inflammatory and
metabo-lic parameters-results of a population-based study. Obesity (Silver Spring) 2017; 25: 468-475.
[21] Yu S, Zhang Y, Li MZ, Xu H, Wang Q, Song J, Lin P, Zhang L, Liu Q, Huang QX, Wang K and Hou WK. Chemerin and apelin are positively