II. Volatile Ices on Outer Solar System Objects
Thesis by
Emily L. Schaller
In Partial Fulfillment of the Requirements
for the Degree of
Doctor of Philosophy
California Institute of Technology
Pasadena, California
2008
c
2008
Emily L. Schaller
Acknowledgements
I would first like to thank my parents Meg and Dave Schaller. Starting with the
picture book of the solar system when I was five years old and continuing throughout
my PhD they have always been supportive of my love of science. This thesis is
dedicated to them.
I next want to thank Dave Lamb for his love and support throughout this process.
I’ve actually really enjoyed being a grad student and I think that has been in large
part due to the people in GPS. I thank my advisor Mike Brown, for his support
and willingness to let me dive in and explore different areas of planetary science that
were interesting to me — even if they weren’t exactly what I was supposed to be
doing. I really value all that I have learned from him and the tools he has given me
over these past few years. Thanks to all the people who have passed through Mike’s
group including Antonin Bouchez, Chad Trujillo, Henry Roe, Lindsey Malcolm, Sarah
Horst, Kris Barkume, Darin Ragozzine, and Meg Schwamb: I have learned something
from each of them. Thanks to Kris Barkume for her friendship and for those late
night bottles of wine. I thank my roommates (Rowena Lohman, Colette Salyk, Amy
Hofmann, and, of course, Harry the cat) for putting up with me. Thanks also to the
squash/salsa crew including Margarita Marinova, Oded Aharonson, Jenny Meyer, and
Jack Wisdom. Thanks to Henry Roe for getting me started with Titan observing and
IDL programming and Mate Adamkovics for providing me with his Titan radiative
transfer code.
Finally, I especially want to thank all of the support astronomers and telescope
past few years (there are many but a few stick out in my mind the most) — Joel
Aycock, Randy Campbell, Bill Golish, Dave Griep, Mark Kassis, Jim Lyke, Mike
Rice, Paul Sears, and Cindy Wilburn. Their hard work and attention to detail was
Abstract
This thesis presents studies in two distinct areas of observational planetary astronomy:
studies of Saturn’s moon Titan’s seasonally varying tropospheric clouds, and studies
of the surface compositions of Kuiper belt objects.
I. Understanding Titan’s methane-based hydrological cycle and interpreting how
and when the fluvial surface features seen by the Cassini Spacecraft were formed
requires frequent long-term observations of Titan’s clouds. Using nearly 100 adaptive
optics images from the Keck and Gemini Telescopes from 2002–2006, we mapped
the locations, frequencies, and magnitudes of Titan’s clouds. We also developed a
near-nightly cloud-monitoring program with the NASA Infrared Telescope Facility
(IRTF). Nightly whole-disk infrared spectroscopy with IRTF allows us to determine
Titan’s total fractional cloud coverage, magnitudes, and altitudes, complementing
and providing context for the relatively infrequent Cassini flybys. Taken together,
the observations presented in this thesis have shown a striking seasonal change in
the behavior of Titan’s clouds as Titan has moved from southern summer solstice
(October 2002) toward vernal equinox (August 2009) and indicate that seasonally
varying insolation appears, to first order, to control Titan’s cloud locations (Schaller
et al. 2006a & 2006b).
II. Unlike Pluto and Eris, the vast majority of Kuiper belt objects (KBOs) are too
small and too hot to retain volatile ices like CH4, N2, and CO on their surfaces to the
present day. As a result, their infrared spectra are either dominated by involatile water
ice or dark spectrally featureless material. To understand the dichotomy between
model of atmospheric escape of volatile ices over the age of the solar system (Schaller
& Brown 2007a). We predicted that Quaoar, an object about half the size of Pluto,
should be just capable of retaining methane ice to the present day. We observed
Quaoar with the Keck Telescope, used Hapke theory to model its spectrum, and
found that it contains a small amount of methane on its surface, indicating that it
is a transition object between the dominant volatile-poor small KBOs and the few
Contents
Acknowledgements iii
Abstract v
1 Introduction 1
1.1 Seasonal Changes in Titan’s Cloud Activity . . . 3
1.1.1 A Large Cloud Outburst at Titan’s South Pole . . . 3
1.1.2 Dissipation of Titan’s South Polar Clouds . . . 4
1.1.3 Seasonal Change on Titan Observed with IRTF/SpeX . . . 4
1.2 Volatile Ices on Outer Solar System Objects . . . 5
1.2.1 Volatile Loss and Retention on Kuiper Belt Objects . . . 6
1.2.2 Detection of Methane on (50000) Quaoar . . . 7
2 A Large Cloud Outburst at Titan’s South Pole 11 2.1 Abstract . . . 13
2.2 Introduction . . . 13
2.3 Observations . . . 15
2.4 Results . . . 18
2.5 Discussion . . . 21
3 Dissipation of Titan’s South Polar Clouds 29 3.1 Abstract . . . 31
3.3 Observations and Results . . . 36
3.4 Discussion . . . 40
4 Seasonal Change on Titan Observed with IRTF/SpeX 51 4.1 Abstract . . . 53
4.2 Introduction . . . 53
4.3 Observations . . . 56
4.4 Results . . . 57
4.4.1 Lightcurves . . . 57
4.4.2 Clouds . . . 62
4.4.3 Search for CO2 Ice . . . 63
4.5 Discussion . . . 67
4.6 Conclusions . . . 69
5 Volatile Loss and Retention on Kuiper Belt Objects 79 5.1 Abstract . . . 81
5.2 Introduction . . . 81
5.3 Atmospheric Escape . . . 82
5.4 Results and Discussion . . . 85
6 Detection of Methane on Kuiper Belt Object (50000) Quaoar 95 6.1 Abstract . . . 97
6.2 Introduction . . . 97
6.3 Observations . . . 98
6.4 Spectral Modeling . . . 99
List of Figures
2.1 Keck adaptive optics images of cloud outburst . . . 16
2.2 Flux comparison with 1995 cloud event . . . 20
3.1 Mean daily insolation at the top of Titan’s atmosphere . . . 37
3.2 Titan cloud locations with time . . . 39
3.3 Keck and Gemini Titan adaptive optics images . . . 41
4.1 Titan near-infrared spectrum . . . 56
4.2 H & K Band Titan spectra . . . 58
4.3 K-band lightcurves . . . 60
4.4 Titan lightcurve magnitude with wavelength . . . 61
4.5 Residual Titan spectra . . . 64
4.6 Fractional cloud coverage of Titan’s disk . . . 65
4.7 Titan’s 2.11–2.12 micron lightcurve with RT model . . . 66
4.8 Non-detection of CO2 ice . . . 67
5.1 Volatile loss as a function of KBO temperature and radius . . . 87
6.1 Quaoar spectrum with best-fit models . . . 101
Chapter 1
Introduction
1.1
Seasonal Changes in Titan’s Cloud Activity
Discovered in 1655 by Christiaan Huygens, Titan still remains one of the most
mys-terious objects in the solar system. The temperature and pressure conditions at the
surface near the triple point of methane mean that Titan is capable of possessing an
alien meteorological cycle analogous to Earth’s hydrological cycle but with methane
as the condensable species. Titan’s small angular size as seen from Earth (∼0.8”)
prevented directly resolving it until the Voyager encounter in 1980. Though Voyager
was able to observe Titan’s entire disk, its cameras could not penetrate Titan’s thick
stratospheric haze that obscured the surface and lower atmosphere from view.
In-vestigators in the 1990’s realized that there were narrow window regions in the near
infrared through which photons could penetrate to Titan’s surface (Lemmon et al.,
1993; Griffith, 1993). Spectroscopy across these windows revealed Titan’s strong
lightcurve due to albedo variations on its surface and variable tropospheric clouds
that were inferred to cover between 0–8% of Titan’s disk (Griffith et al., 1998, 2000).
In Chapters 2, 3, and 4 of this thesis, we present ground-based observations of
Titan using a variety of different telescopes and techniques to observe Titan’s variable
tropospheric clouds. Though the data presented in this thesis comprise only 6 earth
years (equivalent to less than one season on Titan) we were fortunate to have observed
Titan during two very different eras of cloud activity. We compare these observations
with predictions of how Titan’s cloud activity should evolve over the course of its
∼29.7 year seasonal cycle.
1.1.1
A Large Cloud Outburst at Titan’s South Pole
Chapter 2 (Schaller et al., 2006a) discusses a brightening of Titan’s clouds observed
with the Keck adaptive optics system immediately before the arrival of the Cassini
spacecraft into orbit around Saturn (October 2004). This brightening was the largest
con-sistent in magnitude with a similar event observed in September 1995 by Griffith et
al. (1998) who saw Titan’s cloud activity increase by nearly a factor of 10 relative
to all previous observations over two nights. The fact that two of these large cloud
events have been caught by ground-based observers (one 2 years post southern
sum-mer solstice and one near autumnal equinox) indicates that these events may be fairly
common on Titan.
We discuss several scenarios that may explain why Titan has such violent cloud
outbursts and note the role these events might play in shaping the geologic features
observed on the surface of Titan.
1.1.2
Dissipation of Titan’s South Polar Clouds
Chapter 3 (Schaller et al., 2006b) discusses the disappearance of Titan’s south polar
clouds observed in Keck and Gemini adaptive optics images beginning two years after
the end of Titan southern summer solstice. Beginning in December 2004 (only two
months following the large cloud outburst discussed in Chapter 2), Titan’s south polar
cloud activity decreased to undetectable levels. In nearly all images and spectra taken
prior to December 2004 at least a small amount of cloud activity was observed near
the south pole. However, between December 2004 and the present, cloud activity
near Titan’s south pole has essentially stopped. We discuss the timing of this south
polar cloud cessation and discuss how it is roughly consistent with Titan’s south pole
ceasing to be the area of maximum solar insolation. We also note that the breakup
of the south polar cloud system might have also been related to surface cooling or
condensation nuclei clearing out as a result of the large cloud event observed only
months earlier.
1.1.3
Seasonal Change on Titan Observed with IRTF/SpeX
Chapter 4 presents observations from an ongoing near-nightly monitoring program
program was initially motivated by photometric observations we carried out with a
robotic 14” telescope in New Mexico. We performed whole disk photometry of Titan
through two filters which probed to different levels in Titan’s atmosphere in the visible
region of the spectrum. The ratio of the total flux of Titan in a methane window (750
nm), to the flux in a methane absorption region (795 nm) allowed us to detect Titan’s
surface lightcurve and large increases in cloud activity, such as the event discussed in
Chapter 2. Though the 14” telescope could detect large events, the small-scale daily
clouds were undetectable. In addition, in order to achieve the required signal-to-noise
to detect the surface lightcurve, Titan needed to be observed for at least 4 hours each
night.
The 3.0 m NASA Infrared Telescope facility equipped with its spectrometer (SpeX)
allows us to obtain a complete spectrum from 0.8–2.4µm in only three minutes of
inte-gration time. These spectra cover six Titan window regions where photons penetrate
to Titan’s surface and lower atmosphere. This program duplicates on a larger scale
observations done in the 1990s with the United Kingdom Infrared Telescope (UKIRT)
and allows direct comparisons with that dataset, taken near autumnal equinox. The
flexible scheduling of the IRTF allows near-nightly observations and provides the type
of dataset that Cassini, with its relatively infrequent Titan flybys, is incapable of
pro-viding. In the two years of IRTF observations, we have observed a striking seasonal
difference in the behavior of Titan’s clouds between the present season and similar
observations from 1993–1999. We discuss the implications of these observations and
compare them with the predictions of Titan General Circulation Models.
1.2
Volatile Ices on Outer Solar System Objects
There are now over 1100 known objects orbiting the the sun with perihelia beyond
Neptune’s orbit. The existence of this belt of debris left over from planetary accretion
Kuiper belt objects (KBOs) have provided many insights about the early dynamical
history of the solar system (see Malhotra et al. (2000) and references therein), detailed
physical and chemical studies of individual objects are now beginning to yield valuable
information about the formation and evolution of these bodies themselves.
The advent of large (6+ meter) telescopes with sensitive near-infrared
spectro-graphs, along with the new discoveries of KBOs that rivaled or even exceeded the
size of Pluto, lead to an expansion of research on the surface compositions of these
bodies. Near infrared spectroscopy is particularly well suited for studying the surfaces
of outer solar system bodies as many molecules expected to be present on these
ob-jects (such as water ice, methane, nitrogen, ammonia, and higher-order hydrocarbons)
have absorption bands in the 1.4–2.5 micron region.
The near-infrared spectra of the known KBOs divide into three general categories:
methane-rich, water-ice rich, and featureless. The largest objects, including Pluto,
Eris, Sedna, 2005 FY9, and Neptune’s moon Triton (thought to be a captured KBO),
are dominated by absorptions due to methane ice (Owen et al., 1993; Cruikshank
et al., 1993; Brown et al., 2005; Barucci et al., 2005; Brown et al., 2007). A second
class of objects, that are generally smaller than the methane-rich objects, contain
varying amounts of water-ice on their surfaces (Barkume et al., 2008). The final class
have featureless spectra in the infrared with nothing identifiable (Barkume et al.,
2008).
In Chapters 5 and 6 of this thesis we focus on understanding why the
methane-rich KBOs are capable of retaining methane (and other supervolatiles like carbon
monoxide and molecular nitrogen) on their surfaces to the present day and why most
KBOs are not.
1.2.1
Volatile Loss and Retention on Kuiper Belt Objects
In Chapter 5 (Schaller & Brown 2007a) we calculate rates of volatile loss on outer
at different heliocentric distances provides us with a kind of laboratory in which to
test predictions of volatile loss and retention. Assuming the slowest possible escape
rates and integrating this escape flux over an object’s orbit, we were able to determine
the minimum amount of loss of methane, carbon monoxide and molecular nitrogen
that must have occurred on all the known KBOs and centaurs over the age of the
solar system. If this minimum loss was greater than the initial amount of volatiles
estimated to be present on the body, then there should be no volatile ices present on
the surface of that object.
We applied our model to all the known KBOs and centaurs and found that in
addition to Pluto, Triton, Sedna, and Eris, there were three objects that were near
the transition region between certain volatile loss and possible volatile retention: 2005
FY9, 2003 EL61, and Quaoar. The presence of 2005 FY9 near this transition region
provided an explanation for the depletion of nitrogen seen by Brown et al. (2007).
2005 FY9 is capable of possessing methane ice but not capable of possessing molecular
nitrogen due to its size and the effective temperature it experienced over the past 4.5
billion years. 2003 EL61 is known to have a water-ice dominated spectrum and is
the parent body of the first collisonal family known in the Kuiper Belt (Brown et al.,
2007b). The fact that this object does not have any volatile ices on its surface is
not surprising because the massive collision it experienced stripped off most of its icy
mantle and likely any volatiles it possessed as well. The final potentially volatile-rich
object, Quaoar, a body about half the size of Pluto with a perihelion about 10AU
further from the sun, had been observed by Jewitt & Luu (2004) who found crystalline
water-ice and ammonia ice on the surface. Due to this object’s potential to contain
volatile ices, we determined that additional observations were warranted.
1.2.2
Detection of Methane on (50000) Quaoar
In Chapter 6 (Schaller & Brown 2007b), we present medium-resolution (R∼2000)
on the Keck II telescope in April 2007. The goal of these observations was to determine
if any volatile ices were present on the surface. We modeled the spectrum using Hapke
theory and found that with a 6 times higher signal-to-noise per pixel than Jewitt &
Luu (2004), the feature at 2.2 µm previously identified as ammonia hydrate is in fact
due to methane ice.
We predicted in Chapter 5 that Quaoar should be barely capable of retaining
methane ice on its surface to the present day. The detection of a small amount
of methane on Quaoar indicates that the last stages of volatile loss on an object
may occur quite slowly. As more objects are discovered with high perihelia similar to
Sedna, we expect that even the smallest of these objects may be capable of containing
Bibliography
Barkume, K. M., Brown, M. E., & Schaller, E. L. 2008, Astronomical Journal, 135,
55
Barucci, M. A., Cruikshank, D. P., Dotto, E., Merlin, F., Poulet, F., Dalle Ore, C.,
Fornasier, S., & de Bergh, C. 2005, Astronomy and Astrophysics, 439, L1
Brown, M. E., Barkume, K. M., Blake, G. A., Schaller, E. L., Rabinowitz, D. L., Roe,
H. G., & Trujillo, C. A. 2007a, Astronomical Journal, 133, 284
Brown, M. E., Barkume, K. M., Ragozzine, D., & Schaller, E. L. 2007b, Nature, 446,
294
Brown, M. E., Trujillo, C. A., & Rabinowitz, D. L. 2005, Astrophysical Journal,
Letters, 635, L97
Cruikshank, D. P., Roush, T. L., Owen, T. C., Geballe, T. R., de Bergh, C., Schmitt,
B., Brown, R. H., & Bartholomew, M. J. 1993, Science, 261, 742
Griffith, C. A. 1993, Nature, 364, 511
Griffith, C. A., Hall, J. L., & Geballe, T. R. 2000, Science, 290, 509
Griffith, C. A., Owen, T., Miller, G. A., & Geballe, T. 1998, Nature, 395, 575
Jewitt, D. C. & Luu, J. 2004, Nature, 432, 731
Kuiper, G. P. 1951, Proceedings of the National Academy of Science, 37, 1
Lemmon, M. T., Karkoschka, E., & Tomasko, M. 1993, Icarus, 103, 329
Malhotra, R., Duncan, M. J., & Levison, H. F. 2000, Protostars and Planets IV, 1231
Owen, T. C., Roush, T. L., Cruikshank, D. P., Elliot, J. L., Young, L. A., de Bergh,
C., Schmitt, B., Geballe, T. R., Brown, R. H., & Bartholomew, M. J. 1993, Science,
Schaller, E. L. & Brown, M. E. 2007a, Astrophysical Journal, Letters, 659, L61
Schaller, E. L. & Brown, M. E. 2007b, Astrophysical Journal, Letters, 670, L49
Schaller, E. L., Brown, M. E., Roe, H. G., & Bouchez, A. H. 2006a, Icarus, 182, 224
Schaller, E. L., Brown, M. E., Roe, H. G., Bouchez, A. H., & Trujillo, C. A. 2006b,
Chapter 2
A Large Cloud Outburst at Titan’s
South Pole
http://www.ifa.hawaii.edu/images/aerial-tour/keck2-60b.jpg
This chapter has been published in its entirety under the same title by authors E.L.
Schaller, M.E. Brown, H.G. Roe, and A.H. Bouchez inIcarus, 2006, Volume 182, pp.
2.1
Abstract
Images of Titan acquired over five nights in October 2004 using the adaptive optics
system at the Keck Observatory show dramatic increases in tropospheric cloud
activ-ity at the south pole compared with all other images of Titan clouds to date. During
this time, Titan’s south polar clouds brightened to more than 18 times their typical
values. The Cassini Ta flyby of Titan occurred as this storm was rapidly dissipating.
We find that the brightness of this cloud outburst is consistent with the dramatic
transient brightening of Titan observed in atmospheric windows on two nights in
1995 by Griffith et al. (1998) if we scale the brightness of the cloud by projecting it
onto the equator. While apparently infrequent, the fact that large cloud events have
been observed in different seasons of Titan’s year indicates that these large storms
might be a year-round phenomenon on Titan. We propose possible mechanisms to
explain these occasional short-term increases in Titan’s cloud activity.
2.2
Introduction
Data from the Voyager encounter with Saturn’s moon Titan first suggested that Titan
might support a methane meteorological cycle including convective methane clouds
and rain beneath the smoggy stratospheric haze (Eshleman et al. 1983; Flasar 1983;
Lunine et al. 1983; Toon et al. 1988). Observations with ground-based telescopes in
narrow methane windows in the infrared found that Titan’s surface was not of uniform
albedo but instead had a reproducible infrared lightcurve with maximum brightness
occurring near 110 W longitude (Coustenis et al. 1995; Griffith 1993; Lemmon et al.
1995). HST images (Meier et al. 2000; Smith et al. 1996) and early adaptive optics
images (Combes et al. 1997) revealed a continent sized bright feature centered near
110 W longitude now known as Xanadu. None of these observations detected any
evidence for transient clouds in Titan’s atmosphere.
by Griffith et al. (1998) who reported a dramatic brightening of Titan in atmospheric
windows during two nights in September of 1995 compared with observations on
twelve other nights from 1993-1997. They found that this brightening corresponded
to ∼9% cloud cover of Titan’s disk and placed the clouds at an altitude of 15 km.
Griffith et al. (2000) then reported evidence for smaller scale transient cloud activity
occurring on several nights in 1993-1999. These daily clouds were much smaller than
the large cloud event witnessed in 1995 and covered less than 1% of Titan’s disk.
The first images of Titan’s clouds were obtained by Brown et al. (2002) and Roe
et al. (2002) using the adaptive optics systems on the Keck and Gemini telescopes.
Since then, clouds have regularly been observed near Titan’s south pole (Bouchez
& Brown, 2005; Gendron et al., 2004; Roe et al., 2005a) and typically contribute
about 1% of the total brightness of Titan’s disk, consistent with the daily clouds
observed spectroscopically by Griffith et al. (2000). The location of the clouds near
the south pole lead Brown et al. (2002) to suggest that they may form via insolation
driven convection because the south pole was the area of maximum solar insolation
on Titan (southern summer solstice was in October 2002). The presence of south
polar tropospheric clouds at this season is likely controlled in a complex way by both
the insolation and the global circulation leading to uplift at the pole. South polar
clouds may also form non-convectively by cooling of air parcels as they move poleward
(Barth & Toon, 2004).
Between 2001 and mid-2004 clouds had been observed near the south pole of
Titan on 66 occasions in Palomar, Keck and Gemini images (Bouchez & Brown,
2005; Bouchez et al., 2004), but at most times the clouds covered no more than 1%
of the surface, and at no time did the coverage approach that seen by Griffith et al.
(1998). The lack of large cloud features suggested a possible difference in the cloud
formation mechanisms between the current south polar summer season and the spring
equinox season when the large cloud was observed in 1995.
on five nights in October 2004 with Keck adaptive optics images and compare the
brightness of this cloud outburst to the transient brightening observed in 1995 by
Griffith et al. (1998).
2.3
Observations
Images of Titan presented here were taken with the W.M. Keck 10-m telescope using
the adaptive optics system and the NIRC2 near-infrared camera (Wizinowich et al.,
2000) through three different filters that probe to different levels in Titan’s
atmo-sphere. Images taken through the K’ filter (2.03-2.36 um) probe to Titan’s surface,
while those taken through the H22 (1-0) filter (2.11-2.14 um) probe to ∼10 km
alti-tude (lower troposphere), and the Bγ filter (2.15-2.18 um) probes to∼50 km altitude
(lower stratosphere). In Titan’s atmosphere, photons of the wavelength range seen
through the H2 filter reach an optical depth of unity in the lower troposphere owing
to absorption by methane, nitrogen, and hydrogen (Roe et al., 2002). Images in the
H2 filter therefore show only light scattered in Titan’s atmosphere above an altitude
of about 10 km, thus this filter is ideal for detecting clouds in the middle of Titan’s
troposphere without the confusion of surface features. We therefore use the H2 filter
for our analysis of cloud locations and magnitudes. Images were flat-fielded, corrected
for bad pixels, and oriented so that Titan’s north pole is aligned with the vertical
axis. At the time of the observations Titan was at a distance of 9.2 AU, so the Keck
telescope diffraction limited resolution of 0.05 arcseconds corresponds to 330 km on
the surface of Titan.
Figure 1a shows images of Titan from seven nights in 2003 that are typical of the
cloud activity seen during this season. Beginning with images on 28 September 2004,
however, Titan’s south polar cloud system brightened dramatically. This brightening
was observed over the course of six nights from 28 September until 28 October (Fig.
16 summer solstice was in October 2002). The presence of south polar tropospheric clouds at this season is likely controlled in a complex way by both the insolation and the global circula-tion leading to uplift at the pole. South polar clouds may also form non-convectively by cooling of air parcels as they move poleward (Barth and Toon, 2004).
Between 2001 and mid-2004 clouds had been observed near the south pole of Titan on 66 occasions in Palomar, Keck and Gemini images (Bouchez and Brown, 2005; Bouchez et al., 2004), but at most times the clouds covered no more than 1% of the surface, and at no time did the coverage approach that seen byGriffith et al. (1998). The lack of large cloud features sug-gested a possible difference in the cloud formation mechanisms between the current south polar summer season and the spring equinox season when the large cloud was observed in 1995.
We report here on a dramatic brightening of Titan’s south polar clouds observed on five nights in October 2004 with Keck adaptive optics images and compare the brightness of this cloud outburst to the transient brightening observed in 1995 by Griffith et al. (1998).
2. Observations
Images of Titan presented here were taken with the W.M. Keck 10-m telescope using the adaptive optics system and the NIRC2 near-infrared camera (Wizinowich et al., 2000) through three different filters that probe to different levels in Titan’s atmosphere. Images taken through the K! filter (1.95–
2.30 µm) probe to Titan’s surface, while those taken through the H2 (1–0) filter (2.11–2.14 µm) probe to∼10 km altitude
(lower troposphere), and the Brγ filter (2.15–2.18 µm) probes
to∼50 km altitude (lower stratosphere). In Titan’s atmosphere,
photons of the wavelength range seen through the H2 filter
reach an optical depth of unity in the lower troposphere ow-ing to absorption by methane, nitrogen, and hydrogen (Roe et al., 2002). Images in the H2filter therefore show only light
scat-tered in Titan’s atmosphere above an altitude of about 10 km, thus this filter is ideal for detecting clouds in the middle of Ti-tan’s troposphere without the confusion of surface features. We therefore use the H2filter for our analysis of cloud locations and
magnitudes. Images were flat-fielded, corrected for bad pixels, and oriented so that Titan’s north pole is aligned with the verti-cal axis. At the time of the observations Titan was at a distance of 9.2 AU, so the Keck telescope diffraction limited resolution of 0.05 arcsec corresponds to 330 km on the surface of Titan.
Fig. 1a shows images of Titan from seven nights in 2003 that are typical of the cloud activity seen during this season. Begin-ning with images on 28 September 2004, however, Titan’s south polar cloud system brightened dramatically. This brightening was observed over the course of six nights from 28 September until 28 October (Fig. 1b), when the brightness of Titan’s south polar clouds returned to their typical values. At the peak of the cloud outburst on 8 October, the cloud covered at least 8% of the disk of Titan. Also visible in the images from October 2, 3, and 7 are smaller clouds located at mid-latitudes. These clouds are discussed in detail by Roe et al. (2005b) and will not be discussed here.
Titan’s clouds are typically not detected or are very faint in Brγimages indicating that they are located in the troposphere at
an altitude below that which photons of the wavelength range of the Brγ filter can penetrate (∼50 km) (Roe et al., 2002).
In addition, all other measurements of Titan cloud altitudes (Brown et al., 2002;Griffith et al., 1998, 2000, 2005) placed these clouds in the troposphere. Though the large south polar
Fig. 1. Keck adaptive optics images of Titan taken through the H2(1–0) (2.11–2.14 µm) filter oriented with Titan north up. This filter probes only to Titan’s troposphere making it ideal for observing Titan’s clouds. (A) Images of Titan from seven nights in 2003 that are typical of the low levels of cloud activity seen from 2001–2004. (B) Cloud activity at the south pole is seen in all seven of these images and dramatic brightening is observed in images from October 2, 3, 7, 8, 2004. (C) Pole projected images of Titan’s clouds with the pole location marked with a black dot. All images have Titan 0W longitude pointing up. The Cassini “Ta” flyby occurred on October 26, 2004, by which point cloud activity was rapidly dissipating. By October 28, 2004, cloud activity had dissipated down to typical levels of less than 1% cloud coverage (Bouchez and Brown, 2005). These images also allow us to constrain the duration of the cloud outburst to less than 30 Earth days. Locations of the clouds also indicate that convection on Titan is extremely vigorous and that large clouds can dissipate and reform in several days.
At the peak of the cloud outburst on 8 October, the cloud covered at least 8% of the
disk of Titan. Also visible in the images from October 2, 3, and 7 are smaller clouds
located at mid-latitudes. These clouds are discussed in detail by Roe et al. (2005b)
and will not be discussed here.
Titan’s clouds are typically not detected or are very faint in Bγ images indicating
that they are located in the troposphere at an altitude below that which photons of
the wavelength range of the Bγ filter can penetrate (∼50 km) ((Roe et al., 2002).
In addition, all other measurements of Titan cloud altitudes (Griffith et al., 1998,
2000; Brown et al., 2002; Griffith et al., 2005) placed these clouds in the troposphere.
Though the large south polar cloud can be seen in several of the Bγ images, the
contribution of the cloud to the total brightness of Titan in the H2(1-0) filter is over
five times greater than that in the Bγfilter. A typical cloud with a brightness of 1% in
the H2 (1-0) filter would not be detected in the Bγfilter were it over five times fainter,
consistent with our observations. Therefore, given that all previous measurements of
Titan cloud heights place them in the troposphere and the brightness of the large
clouds in the Bγ filter is below that which could be detected were these clouds of
typical size, we assume that these clouds are also located in the troposphere.
To find the extent of Titan’s brightening due to the presence of these clouds,
we first photometrically normalized each image by measuring the total brightness of
Titan in the H2 filter and scaling the brightness of the image by the total flux of
the relatively unchanging northern half of Titan. We then subtracted the total flux
from images of Titan with clouds from the total flux from images of Titan without
clouds (28 October 2004, 10 January 2004, 24 December 2003, 25 December 2003).
These images with no distinct clouds show only photons scattered from the
slowly-changing haze in the stratosphere of Titan. Because of possible long term changes
in the haze abundance, we attempt to use closely spaced dates for comparison when
possible. However we found only about a 1% difference in cloud brightness regardless
our measurement. The fractional increase in Titan’s total flux through the H2 filter
compared with Titan’s total flux on nights with low cloud activity is presented in
Figure 2. We find that the total flux of Titan through the H2 filter increased by 18%
on the brightest observed night of the outburst (October 8, 2004).
2.4
Results
The cloud outburst of October 2004 was significantly larger than any other directly
imaged on Titan. To compare the magnitude of this outburst to the Griffith et al.
(1998) cloud event detected spectroscopically in 1995, we measure the magnitude of
brightening in the H2 filter wavelength region (2.11-2.14 um) of the Griffith et al.
(1998) spectra from September 4 and 5 1995. We find that the total flux of Titan
increased by 36% and 59% in the H2 filter wavelength region for September 4 and
5 respectively (Fig 2). Thus the large cloud event of October 2004, though it is the
largest south polar cloud seen in several years of monitoring Titan (Schaller et al.,
2005), is still 3.3 times fainter than the brightest transient brightening attributed to
clouds in 1995.
Griffith et al. (1998), however, suggest that, based on spectral changes from 4 to 5
September, the cloud they observed is consistent with an equatorial location. Such a
location would be consistent with the hypothesis that convective clouds form near the
latitude of maximum solar insolation (Brown et al., 2002), which was near the equator
at the southern spring equinox season of the 1995 observations. The brightness of
the 2004 outburst is significantly attenuated relative to a comparably large cloud
system near the center of Titan’s disk both from geometric foreshortening and from
additional methane, nitrogen, and hydrogen opacity through a longer atmospheric
path length. If we move the October 2004 clouds from their locations near the pole
(see Table 1) to the center of Titan’s disk, we find that they would appear brighter by
of Roe et al. (2002) we find that the decreased gas opacity through a shorter path
length would increase the observed brightness of the clouds by an additional factor
of 2. Combining these two effects, we find that the 2004 clouds would have appeared
brighter by at least a factor of ∼3.5 if they were near the equator. Therefore if the
2004 cloud event were at the equator, it would have appeared to be of comparable
brightness to the 1995 event (Fig. 2 dashed line).
These observations also allow us to constrain the duration and short-term
variabil-ity of large cloud events. From the seven Keck images we can constrain the duration of
the cloud outburst to less than 30 earth days. In addition, observations on sequential
nights indicate that the flux from the storm can stay relatively constant (October 2 &
3) or increase by a factor of two (October 7 & 8) in only 24 hours. Rapid variability
in cloud flux was also observed by Griffith et al. (1998) during the two nights of the
1995 storm. This variation may have been due to parts of the cloud rotating onto the
limb but may have also been due to rapid fluctuation in cloud size or height.
The locations of brightest pixels of the clouds on October 2 & 3 and October 7 &
8 (Fig. 1c and Table 1) allow us to place limits on the troposphere circumpolar wind
velocities. From October 2 to October 3 we find that the movement of the cloud is
consistent with a velocity of 2 +/- 3 m/s. The cloud on October 7 & 8 is consistent
with a velocity of 0 +/- 4 m/s. However, the October 7 & 8 cloud is 160 degrees in
longitude away from the cloud observed on October 2 & 3. In order for the cloud
of October 2 & 3 to have blown to the position of October 7 & 8, it would have
needed to move 6 +/- 1 m/s eastward during the 4 days during which we do not have
observations. We find it unlikely that a cloud that was consistent with being relatively
stationary in two separate locations in two separate sets of observations would move
with such a high velocity between observations, thus the October 2-3 cloud and the
7-8 cloud likely formed separately. The former location of the October 2-3 cloud is
visible in images from October 7-8, and no cloud activity is seen at this location, so
226 E.L. Schaller et al. / Icarus 182 (2006) 224–229
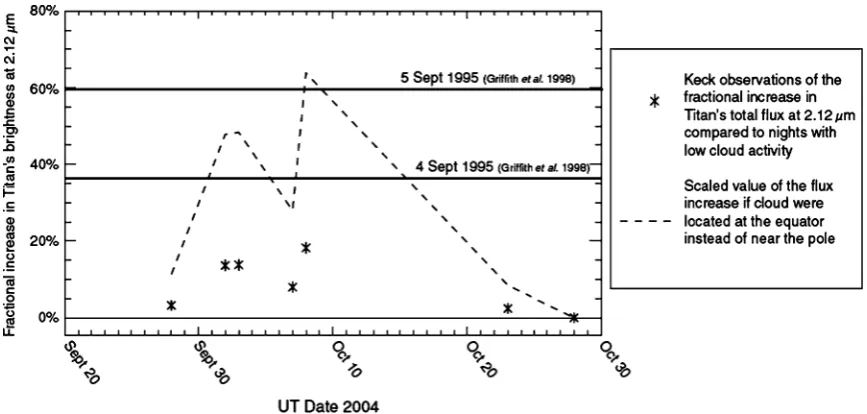
Fig. 2. The fractional increase in Titan’s total flux through the cloud filter (2.11–2.14 µm) compared to nights with low cloud activity is shown for each night of the outburst. The total flux of Titan increased by nearly 20% on the brightest night of the outburst (8 October 2004). The solid lines show the flux increase in the same wavelength range for the September 1995 cloud outburst ofGriffith et al. (1998). We find that the October 2004 storm at the south pole is not as bright by a factor of 3.3. However, the dashed line shows the flux that the October 2004 outburst would have had if it occurred near the equator rather than the pole, estimated by a simple geometric and methane airmass correction. If the October 2004 clouds were at the equator, they would have appeared to be of similar brightness to the September 1995 clouds observed byGriffith et al. (1998).
cloud can be seen in several of the Brγ images, the
contribu-tion of the cloud to the total brightness of Titan in the H2(1–0)
filter is over five times greater than that in the Brγfilter. A
typi-cal cloud with a brightness of∼1% in the H2(1–0) filter would
not be detected in the Brγ filter were it over five times fainter,
consistent with our observations. Therefore, given that all pre-vious measurements of Titan cloud heights place them in the troposphere and the brightness of the large clouds in the Brγ
filter is below that which could be detected were these clouds of typical size, we assume that these clouds are also located in the troposphere.
To find the extent of Titan’s brightening due to the pres-ence of these clouds, we first photometrically normalized each image by measuring the total brightness of Titan in the H2
fil-ter and scaling the brightness of the image by the total flux of the relatively unchanging northern half of Titan. We then sub-tracted the total flux from images of Titan with clouds from the total flux from images of Titan without clouds (28 Octo-ber 2004, 10 January 2004, 24 DecemOcto-ber 2003, 25 DecemOcto-ber 2003). These images with no distinct clouds show only photons scattered from the slowly-changing haze in the stratosphere of Titan. Because of possible long term changes in the haze abundance, we attempt to use closely spaced dates for com-parison when possible. However we found only about a 1% difference in cloud brightness regardless of the comparison date used, and we use this value as our estimate of the error in our measurement. The fractional increase in Titan’s total flux through the H2filter compared with Titan’s total flux on
nights with low cloud activity is presented in Fig. 2. We find that the total flux of Titan through the H2 filter increased by
18% on the brightest observed night of the outburst (October 8, 2004).
3. Results
The cloud outburst of October 2004 was significantly larger than any other directly imaged on Titan. To compare the magni-tude of this outburst to theGriffith et al. (1998)cloud event de-tected spectroscopically in 1995, we measure the magnitude of brightening in the H2filter wavelength region (2.11–2.14 µm)
of theGriffith et al. (1998) spectra from September 4 and 5 1995. We find that the total flux of Titan increased by 36 and 59% in the H2 filter wavelength region for September 4 and
5, respectively (Fig. 2). Thus the large cloud event of October 2004, though it is the largest south polar cloud seen in sev-eral years of monitoring Titan (Schaller et al., 2005), is still 3.3 times fainter than the brightest transient brightening at-tributed to clouds in 1995.
Griffith et al. (1998), however, suggest that, based on spec-tral changes from 4 to 5 September, the cloud they observed is consistent with an equatorial location. Such a location would be consistent with the hypothesis that convective clouds form near the latitude of maximum solar insolation (Brown et al., 2002), which was near the equator at the southern spring equinox sea-son of the 1995 observations. The brightness of the 2004 out-burst is significantly attenuated relative to a comparably large cloud system near the center of Titan’s disk both from geomet-ric foreshortening and from additional methane, nitrogen, and hydrogen opacity through a longer atmospheric path length. If we move the October 2004 clouds from their locations near the pole (seeTable 1) to the center of Titan’s disk, we find that they would appear brighter by a factor of∼1.7 due to geomet-ric foreshortening. In addition, by following the method ofRoe et al. (2002) we find that the decreased gas opacity through a shorter path length would increase the observed brightness of the clouds by an additional factor of 2. Combining these
cloud becomes significantly brighter from October 7th to October 8th (the brightest
night of the storm) suggesting that it was actively forming at that location. While the
overall period of increased south polar cloud activity lasted for ∼30 days, individual
clouds themselves appear to be rapidly forming and dissipating on timescales as short
as one earth day. If the clouds are raining out methane, the fast timescales of their
dissipation and possible rapid rainout times are consistent with a large raindrop size
predicted by Lorenz (1993) and Lorenz & Renn´o (2002).
2.5
Discussion
In order to understand Titan’s complex meteorology, it is necessary to understand
why cloud activity occasionally increases dramatically and why such increases last for
weeks. Clouds can form where a parcel of air is lifted sufficiently to become saturated
and condensation occurs which releases latent heat. As the parcel is further lifted,
sufficient condensation and latent heating occurs to make the parcel warmer than its
surroundings and positively buoyant, initiating free moist-convection and convective
clouds. The altitude at which a parcel is positively buoyant is called the Level of
Free Convection (LFC). Over most of Titan, the dry convective layer near the ground
is much lower than LFC so no clouds are formed. The general circulation models
of Tokano (2005) predict superadiabatic lapse rates from ∼70-90 S in the current
southern summer season. This location corresponds to where the majority of clouds
on Titan have been observed (Roe et al. 2002; Brown et al. 2002; Bouchez and Brown
2005) suggesting that there may be sufficient surface heating at these locations to lift
parcels to the LFC and instigate convective cloud formation. However, an additional
mechanism needs to be invoked to explain the large short-term increase in cloud
activity observed in October 2004. We suggest three possible mechanisms that could
cause such an increase.
Early work suggested that Titan might be lacking in cloud condensation nuclei (CCN)
and that the troposphere could therefore be supersaturated in methane (eg. (Courtin
et al., 1995; McKay et al., 1997; Samuelson & Mayo, 1997)). A large influx of
con-densation nuclei into an already saturated or supersaturated parcel above the LFC
would cause increased cloud activity and rainout of methane. However, Huygens
DISR observations suggested abundant haze particles in the troposphere (Mackwell
& Stansbery, 2005) and GCMS observations found no evidence for methane
supersat-uration (Niemann & The Gcms Experiment Team, 2005). In addition, cloud activity
has been regularly observed near Titan’s south pole for the past four years suggesting
that condensation nuclei have not been lacking. However, addition of extra CCN by
some unknown mechanism could cause increased cloud nucleation rates leading to an
increase in cloud activity until these particles are rained out.
(2) Localized geologic process leading to surface heating
Increased surface heating from geothermal or volcanic activity near the pole could
increase convection leading to a localized increase in cloud activity at that location.
If one hot spot were responsible for the large cloud outburst observed, we would expect
to see either a continuous source region or a long-lived cloud that moves. Instead, we
find large relatively stationary clouds forming in at least two distinct well-separated
areas on different sides of the pole. It is unlikely that two separate hot spots near
the pole cloud be responsible for the observed clouds. Therefore, increased surface
heating is likely not the cause of the observed cloud outburst.
(3) Increased methane humidity at the south pole
Methane injection into Titan’s atmosphere must occur in order to compensate for
the constant photochemical loss. The current pole-to-pole global circulation would
eventually bring this occasionally injected methane toward the south polar region.
Increased cloud activity resulting from lowering the LFC by increasing methane
hu-midity would then occur until the additional methane was depleted. Therefore, large
surface of Titan. This hypothesis is consistent with large cloud outbursts observed in
different seasons of Titan’s year. While we cannot rule out some sort of atmospheric
wave phenomenon periodically bringing moist air to the pole, the timescales of known
terrestrial analog phenomena are at least an order of magnitude longer than the∼30
day timescale of this outburst (Ingersoll et al., 2005) and predictions of cloud
life-times caused by horizontal poleward transport of air parcels are an order of magnitude
shorter (Barth and Toon 2004). In 1995, we expect that the location of daily clouds
and the large cloud outburst observed by Griffith et al. (1998) would have been near
the equator because the solar insolation was greatest there and the equator-to-pole
cells (Hourdin et al., 1995) would have provided uplift and concentrated occasionally
injected methane at the equator.
The Cassini Ta flyby occurred on October 26, 2004 when the cloud outburst was
in the process of dissipating. Cassini images from Ta still showed a significant degree
of cloud activity at the south pole of Titan compared with other flybys indicating that
the outburst had not fully dissipated by October 26th. The Keck image from October
28th, however, shows only a small degree of cloud activity at the pole, consistent with
cloud cover of less than 1% observed in most ground-based images of Titan to date.
Therefore, images from Ta are particularly interesting because of the rapid dissipation
of the clouds that occurred within 48 hours after they were taken.
Ongoing ground-based monitoring campaigns (Schaller et al., 2005) are important
for placing these large storms in the broader context of the full range of cloud activity
on Titan. The south pole ceased to be the area of maximum solar insolation in July
2005. Over the next several years, as Titan moves away from southern summer
solstice, ground-based monitoring campaigns and the numerous Cassini flybys will
help to determine how and if the magnitudes and locations of large cloud events will
begin to change with season. While apparently infrequent, the fact that large cloud
events have been observed in different seasons of Titan’s year (near spring equinox in
Table 2.1 Cloud Details
Image Date Planetocentric latitude, Velocities of the cloud Cloud brightness (UT) longitude of the during the storm (m/s) at 2.12µmb
cloud centersa
2004 Sep 28 -87+3−5, 96+144−35 0.03 ±0.04 2004 Oct 02 -73 ±3, 337+10−8 0.14 ±0.02 2004 Oct 03 -76 ±3, 321+11−14 2.2+3−2..46 0.14 ±0.02 2004 Oct 07 -70 ±3, 163+15−13 0.08 ±0.01 2004 Oct 08 -72 ±3, 163+13−11 0 ±4 0.18 ±0.02 2004 Oct 23 -75 ±5, 160+18−17 0.02 ±0.01
aUncertainties are calculated based on±0.5 pixels in determining the center of Titan and±1.5 pixels
in determining the centers of the cloud positions
Bibliography
Barth, E. L. & Toon, O. B. 2004, Geophysics Research Letters, 31, 17
Bouchez, A. H. & Brown, M. E. 2005, Astrophysical Journal, Letters, 618, L53
Bouchez, A. H., Brown, M. E., Schaller, E. L., & Roe, H. G. 2004, in Bulletin of the
American Astronomical Society, Vol. 36, Bulletin of the American Astronomical
Society, 1117–+
Brown, M. E., Bouchez, A. H., & Griffith, C. A. 2002, Nature, 420, 795
Courtin, R., Gautier, D., & McKay, C. P. 1995, Icarus, 114, 144
Gendron, E., Coustenis, A., Drossart, P., Combes, M., Hirtzig, M., Lacombe, F.,
Rouan, D., Collin, C., Pau, S., Lagrange, A.-M., Mouillet, D., Rabou, P., Fusco,
T., & Zins, G. 2004, Astronomy and Astrophysics, 417, L21
Griffith, C. A., Hall, J. L., & Geballe, T. R. 2000, Science, 290, 509
Griffith, C. A., Owen, T., Miller, G. A., & Geballe, T. 1998, Nature, 395, 575
Griffith, C. A., Penteado, P., Baines, K., Drossart, P., Barnes, J., Bellucci, G.,
Bib-ring, J., Brown, R., Buratti, B., Capaccioni, F., Cerroni, P., Clark, R., Combes, M.,
Coradini, A., Cruikshank, D., Formisano, V., Jaumann, R., Langevin, Y., Matson,
D., McCord, T., Mennella, V., Nelson, R., Nicholson, P., Sicardy, B., Sotin, C.,
Soderblom, L. A., & Kursinski, R. 2005, Science, 310, 474
Hourdin, F., Talagrand, O., Sadourny, R., Courtin, R., Gautier, D., & McKay, C. P.
1995, Icarus, 117, 358
Ingersoll, A. P., Roe, H. G., Schaller, E. L., & Brown, M. E. 2005, in Bulletin of the
American Astronomical Society, Vol. 37, Bulletin of the American Astronomical
Lorenz, R. D. 1993, Planetary Space Science, 41, 647
Lorenz, R. D. & Renn´o, N. O. 2002, Geophysics Research Letters, 29, 10
Mackwell, S. & Stansbery, E., eds. 2005, Lunar and Planetary Institute Conference
Abstracts, Vol. 36, Aerosol and Cloud Properties at the Huygens Entry Site as
Derived from the Descent Imager/Spectral, ed. S. Mackwell & E. Stansbery, 2222–
+
McKay, C. P., Martin, S. C., Griffith, C. A., & Keller, R. M. 1997, Icarus, 129, 498
Niemann, H. B. & The Gcms Experiment Team. 2005, in Lunar and Planetary
In-stitute Conference Abstracts, Vol. 36, 36th Annual Lunar and Planetary Science
Conference, ed. S. Mackwell & E. Stansbery, 1663–+
Roe, H. G., Bouchez, A. H., Trujillo, C. A., Schaller, E. L., & Brown, M. E. 2005a,
Astrophysical Journal, Letters, 618, L49
Roe, H. G., Brown, M. E., Schaller, E. L., Bouchez, A. H., & Trujillo, C. A. 2005b,
Science, 310, 477
Roe, H. G., de Pater, I., Macintosh, B. A., & McKay, C. P. 2002, Astrophysical
Journal, 581, 1399
Samuelson, R. E. & Mayo, L. A. 1997, Planetary Space Science, 45, 949
Schaller, E. L., Brown, M. E., Roe, H. G., Bouchez, A. H., & Trujillo, C. A. 2005, in
Lunar and Planetary Institute Conference Abstracts, Vol. 36, 36th Annual Lunar
and Planetary Science Conference, ed. S. Mackwell & E. Stansbery, 1989–+
Tokano, T. 2005, Icarus, 173, 222
Wizinowich, P., Acton, D. S., Shelton, C., Stomski, P., Gathright, J., Ho, K., Lupton,
W., Tsubota, K., Lai, O., Max, C., Brase, J., An, J., Avicola, K., Olivier, S., Gavel,
Chapter 3
Dissipation of Titan’s South Polar
Clouds
http://apod.nasa.gov/apod/ap990629.html
This chapter has been published in its entirety under the same title by authors E.L.
Schaller, M.E. Brown, H.G. Roe, A.H. Bouchez, and C.A. Trujillo in Icarus, 2006,
3.1
Abstract
Nearly all adaptive optics images of Titan taken between December 2001 and
Novem-ber 2004 showed tropospheric clouds located within 30 degrees of the south pole. We
report here on a dissipation of Titan’s south polar clouds observed in twenty-nine
Keck and Gemini images taken between December 2004 and April 2005. The near
complete lack of south polar cloud activity during this time, and subsequent
resur-gence months later at generally higher latitudes, may be the beginning of seasonal
change in Titan’s weather. The ∼5 month decrease in cloud activity may also have
been caused by methane rainout from a large cloud event in October 2004.
Under-standing the seasonal evolution of Titan’s clouds, and of any precipitation associated
with them, is essential for interpreting the geological observations of fluid flow features
observed over a wide range of Titan latitudes with the Cassini/Huygens spacecraft.
3.2
Introduction
Data obtained from the Voyager encounters with Saturn’s moon Titan first suggested
that Titan might support a methane meteorological cycle analogous to Earth’s
hydro-logical cycle including methane clouds, rain and oceans (Flasar, 1983; Lunine et al.,
1983; Yung et al., 1984). Titan’s thick stratospheric haze prevented Voyager cameras
from imaging the lower atmosphere and surface to confirm or deny the existence of
oceans or clouds. The first images of Titan’s surface were taken in the near infrared
with the Hubble Space Telescope (Smith et al., 1996). These images revealed large
bright and dark regions on Titan’s surface that were hypothesized to correspond to
continent-like land masses and hydrocarbon oceans respectively.
Arecibo radar observations seemed to confirm the idea that Titan’s surface
pos-sessed bodies of liquid methane or other hydrocarbons (Campbell et al., 2003). In 12
out of 16 observed locations on Titan’s surface, Campbell et al. (2003) saw a specular
in these locations. It was expected that data from the Cassini spacecraft would
re-veal lakes or seas of liquid methane or other hydrocarbons. The Huygens lander was
even designed to function if it landed on a liquid surface (Lebreton & Matson, 2002).
However, the Huygens landing spot was solid even though it landed in one of the
dark areas originally thought to be composed of liquid hydrocarbons (Zarnecki et al.,
2005).
Recent Keck observations in the infrared have also found no evidence for specular
reflection indicating that Titan is not smooth on the scale of microns (West et al.,
2005). The radar and IR observations are consistent if the surface is smooth on
cen-timeter scales but not on micron scales. Such a surface could be formed by evaporite
deposits, frozen cryolavas, or deposits of organic haze (West et al., 2005). In addition,
the VIMS instrument has found no evidence for specular reflection anywhere it has
looked (Brown et al., 2005).
Though Cassini has not found any evidence for liquids currently on the surface,
images taken during the Huygens descent provide strong morphological evidence that
liquids have flowed across the surface in the past (Lebreton et al., 2005). Huygens
descent images revealed incised, river-like channels appearing to empty into a dark
flat area. These images force questions about how long ago liquid methane last flowed
through these channels. Are Titan’s channels similar to ancient valley networks on
Mars where water dried up billions of years ago, or does methane still rain down and
flow across the surface of Titan today?
The scarcity of impact craters observed by Cassini point to a young surface age.
Though Titan’s atmosphere screens out impactors that form craters of less than
20 km, the dearth of midsized craters is consistent with a relatively young surface
age (Lunine et al., 2005). Though the cratering record can provide constraints on
Titan’s surface age, in order to begin to answer questions about when and where
liquid methane last flowed across the surface of Titan, the most important pieces
meteorological cycle can provide clues about when it last rained at the Huygens
landing site and when it might rain again.
Clouds on Titan were first detected in 1995 by Griffith et al. (1998) via whole
disk spectroscopy. On two nights out of 12 that they observed, Griffith et al. (1998)
witnessed Titan brightening by up to 200% in regions of Titan’s spectrum in which
photons penetrated to the troposphere. They found that this dramatic, transient
brightening corresponded to cloud cover of∼7-9% of Titan’s disk with a cloud altitude
of ∼16 km. While there is some evidence that this cloud was near the equator based
on spectral changes from one night to the next, the latitude of the cloud is unknown.
Griffith et al. (2000) continued their spectroscopic monitoring of Titan in methane
windows and found daily clouds that appeared to vary on the timescales of hours and
corresponded to total cloud coverage of ≤1% of Titan’s disk.
The first direct detection of clouds on Titan was achieved with the adaptive optics
systems on the Keck and Gemini telescopes by Brown et al. (2002) and Roe et al.
(2002). These observations also revealed cloud cover of 1% of Titan’s disk consistent
with the magnitudes of the daily clouds observed spectroscopically by Griffith et al.
(2000). Images of Titan’s clouds revealed that they were all located within about
30 degrees of the south pole. The location near the pole and the fact that Titan
summer solstice occurred in October 2002, led Brown et al. (2002) to propose a
convective cloud formation mechanism driven by surface heating due to the increased
solar insolation at the south pole. Small (∼1 degree) increases in surface temperature
increase the lapse rate sufficiently to instigate moist convection in Titan’s usually
convectively stable atmosphere (Brown et al. 2002). Brown et al. (2002) predicted
that the locations of the clouds should move north with the changing season.
Recent GCM modeling of Titan by Tokano (2005) has predicted that the
tem-perature at the south pole could vary by ∼4 degrees during the course of a Titan
year assuming a surface composed of porous icy regolith. Tokano (2005) also mapped
near the surface for different seasons. He found superadabatic lapse rates between
50-90S latitude at Ls 270 (southern summer solstice) with the highest values of the
lapse rate at the south pole. The locations of Tokano’s convective zones are consistent
with the observed locations of Titan’s clouds which have regularly been observed from
∼60-90 S latitude by ground based observers since 2001 and by Cassini (Bouchez &
Brown, 2005; Gendron et al., 2004; Brown et al., 2002; Roe et al., 2002; Porco et al.,
2005).
In October 2004 Schaller et al. (2006a) witnessed a brightening of Titan’s south
polar clouds of comparable magnitude to the large cloud event observed in 1995 by
Griffith et al. (1998). This observation indicated that large cloud events occasionally
occur during different seasons of Titan’s year (southern spring equinox and southern
summer solstice). Schaller et al. (2006) suggested that these large cloud events might
be caused by methane injection somewhere on the surface of the planet that is then
concentrated near the pole via Titan’s global circulation.
The four years of adaptive optics observations of Titan comprise less than 1/7
of a full Titan year and have essentially bracketed the period surrounding southern
summer solstice (Figure 3.1). However, as of July 2005, the south pole ceased to be
the area of maximum solar insolation on Titan. The discovery of streaky, extended
clouds at temperate latitudes (∼40 S) in December 2003 was initially thought to be
evidence for seasonal change in Titan’s cloud activity (Roe et al., 2005a). However,
subsequent observations by Roe et al. (2005b) showed that these clouds were clustered
in longitude (near 350W) and that due to an odd coincidence of when Titan was
observed prior to 2003, there was very little coverage of the side of Titan on which
the midlatitude clouds occasionally appear. Roe et al. (2005b) suggested that the
strong tie to a particular location on Titan’s surface indicated that these clouds form
by the release of volatiles or other geologic activity occurring near 40S, 350W. Other
authors (Griffith et al., 2005; Rannou et al., 2006) have suggested that the midlatitude
In contrast to the simple picture of cloud locations generally following the area of
maximum solar insolation, modeling by Rannou et al. (2006) predicts that Titan’s
tropospheric methane clouds should be present near the south and north poles at
nearly all seasons. Their model also predicts sporadic tropical methane clouds
oc-curring at 40 S corresponding to the ascending branch of the troposphere Hadley
cell. These clouds should appear at 40 N around the time of northern solstice. They
predict that south polar clouds should decrease in frequency in the years following
the summer solstice and then reappear after equinox in about 2010. The differences
between the Tokano (2005) and Rannou et al. (2006) models may be due to the high
value of thermal inertia (2000 Jm−2s−0.5K−1) used by Rannou et al. (2006) compared
to case 1 of the Tokano (2005) model with a thermal inertia of 335 Jm−2s−.5K−1. The high value of thermal inertia does not allow the surface temperature to vary
signif-icantly with season which could influence the predicted locations of cloud activity.
Another difference between the models is in their treatment of the spectral properties
and spatial extent of Titan’s stratospheric haze. The aggregate particles and high
haze optical depth at the poles used in the Rannou (2006) model may be more
re-alistic. The properties of Titan’s stratospheric haze may significantly influence the
locations of its tropospheric clouds.
One potential inconsistency with the simple picture of cloud systems following
insolation and circulation and support for the Rannou et al. (2006) model comes from
early observations of Gibbard et al. (2004) in 1998 near the time of the equinox. At a
time when clouds would be expected near the equator in the insolation driven model,
they obtained tentative evidence of a cloud near the south pole. Unfortunately, the
data were obtained before the days of routine high-resolution adaptive optics imaging
and instead had to use the much more difficult technique of speckle interferometry.
This technique can introduce artifacts, particularly near sharp edges such as the south
pole. The data look tentatively convincing, but it is difficult to assess their reliability.
Titan’s cloud systems again move through the equinox. If Titan’s clouds continue to
occur near the south pole even sporadically during equinox, then the simple picture
of convective clouds driven by surface heating should be discarded.
Thus far, there is no confirmed evidence for seasonal variation of Titan’s clouds.
Small, daily clouds have been regularly observed near the south pole since 2001 when
adaptive optics observations began. Large cloud events, while infrequent, have been
observed to occur in two different seasons, (spring equinox and 2 years post summer
solstice). Midlatitude clouds may be caused by surface outgassing and/or may be
related to the global circulation (Griffith et al. 2005, Roe et al. 2005b). However,
there is no evidence that they are a recent phenomenon (Roe et al. 2005b). We
report here on a near-complete disappearance of Titan’s south polar clouds observed
in twenty-nine Keck and Gemini images taken between December 2004 and April
2005 and comment on the possibility that this decrease and subsequent resurgence of
cloud activity at generally higher latitudes could be the start of seasonal change in
Ti-tan’s cloud activity. These observations will provide the best tests for discriminating
between competing models of cloud formation.
3.3
Observations and Results
Titan images presented here come from two long-term Titan monitoring programs
carried out on the W.M. Keck 10-m and the Gemini North 8-m telescopes (Table
3.1). Keck images were taken with the facility adaptive optics system and the
ei-ther the NIRC2 near-infrared camera (Wizinowich et al., 2000) or the imager on the
OH Suppressing Infrared Imaging Spectrograph (OSIRIS) (Quirrenbach et al., 2006).
Gemini images were acquired with the Altair adaptive optics system and the facility
near infrared camera (Herriot et al., 2000; Hodapp et al., 2003).
Keck NIRC2 and Gemini images were taken through three different filters that
518 E.L. Schaller et al. / Icarus 184 (2006) 517–523
provide strong morphological evidence that liquids have flowed
across the surface in the past (
Lebreton et al., 2005
). Huygens
descent images revealed incised, river-like channels appearing
to empty into a dark flat area. These images force questions
about how long ago liquid methane last flowed through these
channels. Are Titan’s channels similar to ancient valley
net-works on Mars where water dried up billions of years ago, or
does methane still rain down and flow across the surface of
Ti-tan today?
The scarcity of impact craters observed by Cassini point to
a young surface age. Though Titan’s atmosphere screens out
impactors that form craters of less than
∼
20 km, the dearth
of midsized craters is consistent with a relatively young
sur-face age (
Lunine et al., 2005
). Though the cratering record can
provide constraints on Titan’s surface age, in order to begin to
answer questions about when and where liquid methane last
flowed across the surface of Titan, the most important pieces of
available data are observations of Titan’s clouds. Understanding
Titan’s complex meteorological cycle can provide clues about
when it last rained at the Huygens landing site and when it
might rain again.
Clouds on Titan were first detected in 1995 by
Griffith et
al. (1998)
via whole disk spectroscopy. On two nights out of
12 that they observed,
Griffith et al. (1998)
witnessed Titan
brightening by up to 200% in regions of Titan’s spectrum in
which photons penetrated to the troposphere. They found that
this dramatic, transient brightening corresponded to cloud cover
of
∼
7–9% of Titan’s disk with a cloud altitude of
∼
16 km.
While there is some evidence that this cloud was near the
equa-tor based on spectral changes from one night to the next, the
latitude of the cloud is unknown.
Griffith et al. (2000)
continued
their spectroscopic monitoring of Titan in methane windows
and found daily clouds that appeared to vary on the timescales
of hours and corresponded to total cloud coverage of
<
1% of
Titan’s disk.
The first direct detection of clouds on Titan was achieved
with the adaptive optics systems on the Keck and Gemini
tele-scopes by
Brown et al. (2002)
and
Roe et al. (2002)
. These
observations also revealed cloud cover of
∼
1% of Titan’s disk
consistent with the magnitudes of the daily clouds observed
spectroscopically by
Griffith et al. (2000)
. Images of Titan’s
clouds revealed that they were all located within about 30
◦of
the south pole. The location near the pole and the fact that
Ti-tan summer solstice occurred in October 2002, led
Brown et
al. (2002)
to propose a convective cloud formation mechanism
driven by surface heating due to the increased solar insolation
at the south pole. Small (
∼
1
◦) increases in surface temperature
increase the lapse rate sufficiently to instigate moist convection
in Titan’s usually convectively stable atmosphere (
Brown et al.,
2002
).
Brown et al. (2002)
predicted that the locations of the
clouds should move north with the changing season.
Recent GCM modeling of Titan by
Tokano (2005)
has
pre-dicted that the temperature at the south pole could vary by
∼
4
◦during the course of a Titan year assuming a surface composed
of porous icy regolith.
Tokano (2005)
also mapped locations
of convective zones (locations where the lapse rate exceeds the
dry adiabat) near the surface for different seasons. He found
Fig. 1. Mean daily insolation at the top of Titan’s atmosphere vs latitude and season in units of W/m2. During most of the four years of adaptive optics
observations of Ti