R E S E A R C H
Open Access
Weld defect detection using a modified
anisotropic diffusion model
Issam Ben Mhamed
1*, Sabeur Abid
1and Farhat Fnaiech
1,2Abstract
This article proposes a new modified anisotropic diffusion scheme for automatic defect detection in radiographic films. The new diffusion method allows to enhance, to sharpen anomalies, and to smooth the background of the image. This new technique is based on the modification of the classical diffusion rule by using a nonlinear sigmoidal function. Experimental results are carried out on multiple real radiographic recorded films of Gaz pipelines of the“Tunisian Society of Electricity and Gas distribution:STEG“ and the society“Control offices–chemical and industrial analysis laboratories:Saybolt-Tunisia“. The new automatic defect detection method shows good performance in comparison with other existing algorithms.
Keywords:anisotropic diffusion, defect detection, radiographic images, contrast enhancement, image sharpening
1. Introduction
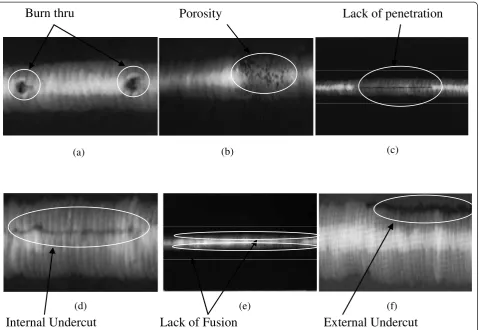
Industrial radiography is now a well-established techni-que for the identification and the evaluation of defects such as discontinuities, cracks, porosities, burn thru, and lack of penetration found in welded joints (Figure 1). These radiographic films are mainly used in petroleum, petrochemical, nuclear, and power generation industries especially for the inspection of welds in the pipelines.
Until now and in several real industrial applications radiographic film analysis are done exclusively by the radiograph inspector, such as in the society “Control offices–chemical and industrial analysis laboratories: Saybolt-Tunisia“. The radiograph inspector is then required to visually inspect each film and detect the pre-sence of possible defects which he must then identify and measure. This study is made a tedious task because of the low dimensions of certain defects (some fissures can have a thickness around 200 μm), the low contrast and a noised nature of some radiographic films. Conse-quently, the detection decision can be subjective in some cases and work conditions.
Several generic systems, able to carry out automatic inspection, are already marketed [1-4]. But their capacity to fault detection is limited to simple and specified
applications for which the defects are well marked by only some changes in the graylevel or the form. Some of the most important achievements in this area are pre-sented below.
In [1], the authors proposed a digital image processing algorithm based on a global and local approach for detecting the nature of defect in radiographic images. This algorithm is based first on smoothing the image using a filter and then a dynamic stretching procedure is applied to the region of interest (ROI) by a look up table transformation. Second, they extract the defect by applying the morphological operations which eliminate small holes, spots, and connect the closely regions.
Authors of [3,5] proposed a fuzzyk-nearest neighbor method based on multilayer perceptron neural network and a fuzzy expert system for the classification of weld-ing defect types. The features used for the classification are distance from center, circularities, compactness, major axis width and length, elongation, Heywood dia-meter, the intensity average, and its standard deviation.
A typical method for automated recognition of welding defects was presented in [2]. The detection algorithm fol-lows a pattern recognition methodology steps as folfol-lows:
Step 1: Segmentation: different regions are found and isolated from the rest of the X-ray image using a watershed algorithm and morphological operations (ero-sion and dilation).
* Correspondence: [email protected]
1Scientific Research Unit: University of Tunis, Signal, Image and Intelligent Control of Industrial Systems: SICISI, Ecole Supérieure des Sciences et Techniques de Tunis (ESSTT), 5 Av. Taha Hussein, 1008, Tunis, Tunisia Full list of author information is available at the end of the article
Step 2:Feature extraction: regions are measured and shape characteristics are quantified such as diameter variation and main direction of inertia based on invar-iant moments.
Step 3: Classification: the extracted features of each region are analyzed and classified using a k-nearest neighbor classifier. According to the literature, the method is robust and achieves good detection rate.
In [6], a welding defect classification method is pro-posed. In a first step, called image pre-processing, the quality of the image is improved using a median filter and a contrast enhancement technique. After that the evaluation of the characteristic parameters following a relevance criterion in discriminating welding defect classes by using a linear correlation coefficient matrix is then used.
Liao and Ni [7] proposed a weld extraction method based on the observation of the intensity plot where the plot of a weld seems to be a Gaussian curve with respect to the other objects in the image. Then, a weld detection approach based on a curve fitting was proposed. Their main idea is to simulate a 2D background for a bad
characterized normal welding by low spatial frequencies in comparison with the high spatial frequencies defect image. Thus, a 2D background is estimated by fitting each vertical line of the weld by a polynomial function, and the obtained image is subtracted from the original one.
A two step technique to detect flaws automatically is proposed in [4] where the authors used a single filter. This method allows first to identify potential defects in each image of the sequence, and second to match and track them from image to image. Many other weld defect detec-tion methods are so far presented and proposed in the literature. However, each technique presents its own advantages and drawbacks. A comprehensive review paper to compare these techniques is now missing in the litera-ture. In this article, we shall focus our attention on a well-known technique namely the anisotropic diffusion model used to the weld detection defects [8].
Anisotropic diffusion has widely been used as an adaptive edge-preserving smoothing technique for edge detection [9], image restoration [10], image smoothing [11], image segmentation [12], and texture segmentation
Burn thru
Porosity
Lack of penetration
Internal Undercut
Lack of Fusion
External Undercut
(a)
(b)
(c)
(d) (e)
(f)
Figure 1Type of defects in welded joints:(a)burn thru,(b)porosity,(c)lack of penetration,(d)internal undercut,(e)lack of fusion,(f)
[13]. In this study, we extend the work of Shin-Min Chao and Tsai [14] used to defect detection in TFT-LCD screen (Thin Film Transistor–Liquid Crystal Dis-plays) to tackle the problem of defect inspection in radiographic films. Consequently, a new anisotropic dif-fusion scheme is proposed.
Besides that the anisotropic technique has some draw-backs, but it is seen by the users as the appropriate and most used one. Hence, this article is devoted to the improvement of this technique and its application to the identification of weld defects in the gas distribution pipelines of the“Tunisian Society of Electricity and Gas distribution:STEG.”
The main improvement of the method is the use of a more complex exponential diffusion function multiplied by a standard used rule. The effectiveness of the new modification exhibits high detection level of the obtained experimental results.
This article is organized as follows. In Section 2, a pre-view of the characteristics of the radiographic films on welds and the corresponding images prepared by the “Control offices–chemical and industrial analysis labora-tories:Saybolt-Tunisia“is given as well as the principle of Gamma Ray (g-ray) radiography. The preprocessing steps are presented in Section 3. A review of the Perona-Malik anisotropic diffusion rules and the improved diffusion model proposed by Shin-Du [14] are developed in Section 4. Section 5 presents the new proposed anisotropic diffu-sion model and presents experimental results on many radiographic images with various defects. Finally, the main conclusions of this study are given in Section 6.
2. Preview of theg-ray radiography and
radiographic films on welds
To assess the quality of the welded joints, radiography is among the most useful of thorough and non-destructive tests. It is based upon exposing the target area to the short wavelength. In the societySaybolt-Tunisia theg-ray is used from the Iridium-192. The corresponding wavelength is about 510-7to 310-4μm. We shall note that theg-ray can penetrate and then inspect joints of bigger thickness than treated by X-ray. To produce effectiveg-ray a small pellet of Iridium-192 sealed in an appropriate capsule is used. This latter is placed on one side of the object being screened, and a photographic film is placed on the other side. Theg-rays pass through the target area and create an image on this film which will be later developed and examined.
As it is well known, the quality of radiography images depends on several parameters such as (and not limited to) the emplacement of the source, the exposure time of the film to gamma radiations, the film quality, etc [15].
In radiograph the radiation intensities transmitted by the source through the target area are rendered as
difference densities in the image. The difference of den-sities from one region to another constitutes the radio-graphic contrast. Consequently different films have different contrast characteristics. To check the film quality, the following parameters are mainly considered [16]:
•The radiographic density or the optical density which is a measure of the film darkening.
•The radiographic contrast that evaluate the capa-city to distinguish different tones of gray in the film itself.
In the purpose of measuring the radiographic density the societySaybolt Societyuses a densitometer of type SM-12“Pocket Pal“. In the Figure 2 some characteristics of this devise are given. In practice the acceptable density values lie in the range of 1.8 and 3.5.
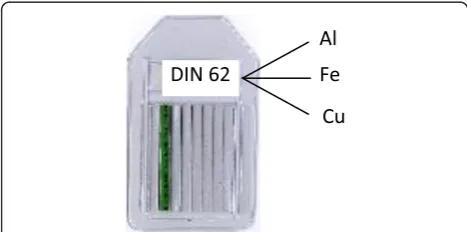
The usual method of measuring the radiographic con-trast is to include some standard details in the image which can give an indication of the image quality. Such devices are known as“Image Quality Indicators (IQIs)”or “penetrameters”. An IQI must be small and relatively cheap to manufacture if it is to be used on every radio-graph and should be as sensitive as possible to changes in the radiographic technique. InSaybolt-Tunisiathe Wire-Type IQI is used (More precisely the IQI DIN 54109). In Figure 3 a scheme of the wire IQI and some related char-acteristics are given.
3. Preprocessing steps 3.1. Digitization
Film digitizing is a critical part of the weld recognition system. Hence, selecting optimized resolution of scan-ning and acceptable quality of digitizing plays an impor-tant role in whole system performance.
In this study, real radiographic films are extracted from the database of a standard films provided by the Society of Saybolt-Tunisia. These radiographic films are considerably dark and their density is rather large. After digitization the fundamental characteristics of these images are
• Lack of the contrast between the defect and the background of the image.
• Presence of a gradient in the background of the image, characterizing the variation of thickness of the part being inspected. This gradient can affect the detec-tion of small size and/or low contrast defects.
•Granular aspect of the background of the image is seen as a background noise. This is due to the granular nature and the thickness of the emulsion and the digiti-zation operation.
as thresholding, edge detection, texture analysis, and others fail to give interesting results.
The second step after the image digitization is the fil-tering process.
3.2. Median filtering
The median filtering allows mainly the attenuation/ elimination of noise. Indeed the acquired images should pass through a stage of image filtering in order to remove distracting and useless information [17]. For example, the existence of impulsive noise in the images is one of the most encountered problems that should be treated.
The application of a low-pass filter is used to remove noise in radiographic images. The median filter is a non-linear filter used to remove the impulsive noise from an image [18-20]. Furthermore, it is more robust than the traditional linear filtering, because it preserves the sharp edges. Median filter is a spatial filtering operator; it uses
a 2D mask applied to each pixel in the input image. This filter performs better than the major averaging fil-ters because it can remove noise from inputting images with a minimum amount of blurring effect.
The median filter operation can be expressed as:
gx,y= MEDIAN(i,j)∈R(x,y)f
i,j (1)
where, f(i, j) represents the gray level value of the input image at the pixel (i,j),g(x, y) represents the gray level value of the smoothed image, R(x,y) represents a
W×Wwindow centered at the pixel (x,y) and MEDIAN stands for the median of the gray level values within the specified window.
In order to simplify the defect detection procedure, the majority of works begin by localizing the ROI and then applying the weld detection algorithm steps.
3.3. Localization of the ROI
For the multiple reasons evoked above, it is difficult, event’s impossible, to detect the presence of small defects and determine accurately their sizes, during the radiogram visualization. Consequently, for the seeking of simplifying the task, one could begin by selecting the ROI, i.e., which can be considered as the parts of the image where the radiograph interpreters suspect the presence of imperfections. The selection of the ROI pre-vents the operator to make treatments on the irrelevant regions of the image and allows, furthermore, to reduce the computing time for real-time applications. Figure 4 presents a typical example of the selection of the ROI in a radiographic image.
Note that the technique of ROI localization is com-monly used by researchers in several works, see [1,2,21].
Figure 2Characteristics of the densitometer SM-12“Pocket Pal”.
Al
DIN62
Fe
Cu
In the following, we shall present the classical diffu-sion model followed by the new proposed anisotropic weld defect detection algorithm.
4. Study of the Perona-Malik anisotropic diffusion model (PMAD)
4.1. Fundamental scheme
In 1990, Perona and Malik [8] proposed to consider the intensity of the image as a concentration of fluid evol-ving toward equilibrium. Consequently, they proposed the new anisotropic diffusion model based on the use of the classical heat equation of diffusion. Recall that diffu-sion is a natural physical phenomenon that moderates the concentration of differences without creating or destroying mass. Then authors introduced a diffusion coefficient depending on the pixel position and the cor-responding magnitude and the gradient direction. This diffusion coefficient is considered as a tuning parameter that governs the diffusion. It is chosen so that it permits diffusion in homogenous areas but not between boundaries.
To develop an efficient algorithm for automatic defect detection in radiographic films and since weld defect can be of very small sizes in the ROI, it is important to take the image at the highest possible contrast. In the sequel, we shall present an anisotropic diffusion scheme for a contrast enhancement.
Anisotropic diffusion was proposed by Perona and Malik [8] for scale-space description of images and edge detec-tion. Anisotropic diffusion removes noise from an image by modifying the image via a partial differential equation. Perona-Malik introduced the following diffusion rule:
∂It(x,y)
∂t = div
ct(x,y)· ∇It(x,y)
(2)
whereIt(x,y) is the gray level at coordinates (x,y) of a
digital image at the iteration t, div is the divergence operator, and∇It(x,y) is the gradient of the image.ct(x,
y) is the diffusion coefficient considered as a function of the gradient ∇Ii
t
x,yin the PMAD model, i.e.,
citx,y= g∇Iitx,y (3)
gis a non-negative monotonically decreasing function verifying:
g(0) = 1 and
lim
|∇Ii t→∞|
g(∇Iit) = 0
(4)
This anisotropic diffusion rule can discretely be imple-mented by using four nearest-neighbors and the Lapla-cian operator [17]:
It+1(x,y) =It(x,y) +
1 4
4
i=1
cit(x,y)· ∇Iti(x,y) (5)
where ∇Iitx,y; i = 1...4, represents the gradient of four neighbors in the north, south, east, and west direc-tions, respectively:
∇I1t x,y=It
x,y−1−It
x,y (6)
∇I2t x,y=It
x,y+ 1−It
x,y (7)
∇I3 t
x,y=It
x+ 1,y−It
x,y (8)
∇I4t x,y=It
x−1,y−It
x,y (9)
It looks like an adaptive diffusion procedure, the PMAD behavior is a function of the local variations of the intensity of the image. Thanks to the functionct(x,y)
it allows a large-smoothing in the zones of low gradient, and a weak-smoothing in the zones of large gradient (contour). Hence, a thresholding coefficientKallows to distinguish between the zones with large gradient values and those with weak gradient ones.
Perona-Malik [8] proposed for example the following exponential functions (known as edge stopping func-tion):
g(∇Iit(x,y)) = 11 + ∇ItiK 2 (10)
or
g(∇Iti(x,y)) = e−(|∇Iit|
K)2 (11)
The inverse proportion edge stopping function in Equation (10) removes the noise in the large area effi-ciently, because its diffusion is the inverse function of the image gradient. But unfortunately, this function can-not preserve edge information. The exponent edge stop-ping function in Equation (11) allows to overcome this matter. With the finite difference scheme and the cen-tral differencing in spatial domain, the 2D anisotropic diffusion rule can be then expressed as:
I(i,j,t+ 1) =I(i,j,t) +λ·[cN· ∇IN(i,j,t)
+cS· ∇IS(i,j,t) +cW· ∇IW(i,j,t)
+cE· ∇IE(i,j,t)]
(12)
where 0 ≤l ≤ 0.25 governs the rate of the diffusion andN, S, E, Ware the mnemonic subscripts for north, south, east, and west, respectively, and
cN=g(|∇IN|) (13)
cS=g(|∇IS|) (14)
cE=g(|∇IE|) (15)
cW =g(|∇IW|) (16)
The choice of the thresholdKis somewhat difficult; it can be fixed arbitrarily or by estimating the noise. For this purpose, the authors in [8] proposed to choose it using the cumulated histogram of the gradient.
Generally speaking, if Kis big, the preservation of the edge will be better; however, the noise will not be suffi-ciently removed; but ifKis small, the noise will be well removed, but the edges of the image will be blurred.
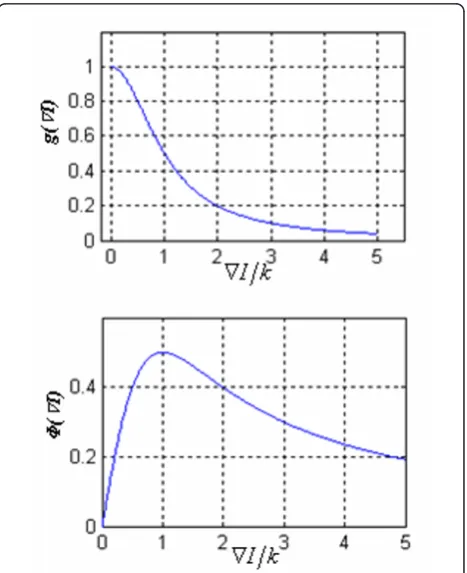
Let ϕ (∇I) be the flux function as defined in [8]:
ϕ (∇I)=g(∇I)· ∇I (17)
A large flux value indicates a strong effect of smooth-ness. Figure 5 presents the evolution of the diffusion coefficient function and the flux function given by Equa-tions (10) and (17), respectively.
For a given value ofK, it is shown from Figure 5a that the curve of the diffusion coefficient function in Equa-tion (10) decreases intensively and becomes near zero when the gradient magnitude |∇I| is greater than 4K. Therefore, the diffusion stops when |∇I|>4K. The maximum smoothness occurs at |∇I|= 1K, as can be seen in the corresponding flux function in Figure 5b. The classical model of PMAD can actually smooth intra-regions in the image.
Consequently, in a low contrast image, the PMAD model can smooth the background but it cannot clearly enhance the defects.
Figure 5Different curves of the Perona Malik model:(a)Curve of the diffusion coefficient function:g(∇I) = 1/⌊1+(|∇I|/K)2⌋(b)
Curve of the flux function:g(∇I) = 1/⌊1+(|∇I|/K)2
Therefore, the result of diffusion still a low contrast image and defects will not be reliably identified in the diffused image.
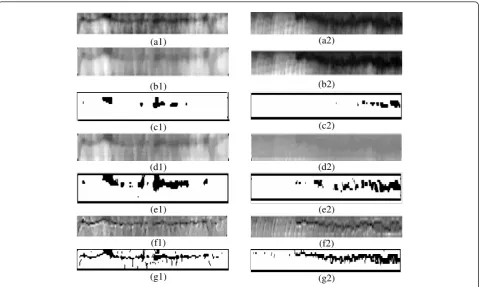
The algorithm of the PMAD model is given in Table 1. Some simulation results of the PMAD applied to images of weld are given in Figures 6 and 7. Indeed Fig-ures 6a1, a2 and 7a1, a2 represent four radiographic images of weld with internal undercut, external under-cut, lack of fusion, and lack of penetration defects, respectively. Figures 6b1, b2 and 7b1, b2 show the restoration results of the diffusing process using PMAD model with a parameterK= 2, and Figures 6c1, c2 and 7c1, c2 represent the result of the binarization of these images with the Otsu method [22].
From these results one can see clearly that this first method fails to detect weld defects. This means that the traditional PMAD model cannot enhance sufficiently anomalies by smoothing low-gradient regions and pre-serving high-gradient edges. Some improvements of these results will be found with the Shin-Du model.
4.2. Shin-Du model
This model was proposed by Shin-Min Chao and Tsai [14], it incorporated a sharpening strategy in the classi-cal diffusion model in order to enhance the anomalies effectively in defected surfaces.
The Shin-Du model is then expressed as:
It+1
x,y=It
x,y+ 1
4
4
i=1
cit· ∇Iti
x,y
−1 4 4 i=1
vitx,y· ∇Iitx,y
(18)
where the third term on the right-hand side is the shar-pening operator. The sharshar-pening diffusion coefficient function hasv∇Ii
t
x,yin order to ensure non-negative
monotonically increasing function with
v(0)= 0and lim
|∇Ii t|→∞
v∇Ii t
= 1
The function v∇Ii t
x,y maintains a high coefficient values at image edge having large magnitudes and low coefficient values. The considered image edge should belong to an image region showing low gradient magni-tudes. This v∇Iitx,y is defined as:
v∇Ii t
x,y=α.1−g∇Ii t
x,y (19)
whereais the weight of sharpening coefficient func-tion, and 0 ≤a ≤1. It governs the degree of sharpness process.
Table 2 gives the algorithm of the different steps of this method.
Figure 8a, b represents the diffusion coefficient func-tion g(∇I)-v(∇I) and the flux function(∇I) = [g(∇I)-v
(∇I)]· ∇I for the model proposed by Shin-Du, respec-tively. For a givena andK, it can be seen in Figure 8a that the diffusion coefficient function decreases dramati-cally and crosses zero when the gradient magnitude |∇I
| is bigger than K/√α.
The flux function in Figure 8b shows that the flow increases with the gradient strength to reach a maxi-mum. And then it decreases and crosses zero to reach negative values. This behavior shows that the diffusion process performs smoothing for lower gradient area (when |∇I|<K√α) and proceeds sharpening for higher gradient area (when |∇I|>K√α).
For defect detection in a low-contrast glass substrates image [17], the model can effectively enhance defects in the diffused image. But, as shown in Figures 6d1, d2, 7d1, d2 and 6e1, e2, 7e1, e2, the Shin-Du improves the weld defect detection but it does not show drastic results for the localization of these defects.
4.3. Choice of the parametersaandK
Since the parametersaandKshould be fixed beforehand for a particular application, the experiments are conducted to find appropriate values ofKandafor the detection of defects in the radiographic images. Whenais too large, anomalies cannot be enhanced in the resulting diffusion image. In contrast, when a is too small the diffusion results show that the proposed diffusion model will over sharpen the image.
WhenKis too large, the resulting images are severely smoothed. Not only the background area is smoothed, but also the default form is lost. WhenK is too small anda is too large, the diffusion process cannot reduce noise. These results fail the inspection of defects in radiographic images.
Table 1 Algorithm of the PMAD model
Initialisation: Chose initial zone parameters: K,ct(x,y) Step1: Digitization
Step2: Region of Interest Localisation Step3: Median filtering
Step4: Compute the 2D convolution masks: hN, hS, hF and hW Step5: For i = 1 to number of image windows
Compute the gradient
Compute the diffusion functionc1(x,y) of 4 neighbors
Compute It+1(x,y) =It(x,y) +
1 4 4 i=1
cit(x,y).∇Iit(x,y)
End
5. The proposed modified anisotropic diffusion model
From Figure 1, it is clear that the gray levels of defects and faultless backgrounds are painfully distinguishable and really merged together.
In [23], the authors used a sigmoidal function to pro-duce different degrees of edge sharpening. Then a weighting function was used for the experimental imple-mentation given by
σ (x)= 1
1 +e−rx (20)
s(x) is a sigmoidal function whose values are 1
2 forx
= 0, and clumbs to a value of 1 with increasing x, and where the r > 0 is a free parameter that controls the steepness ofs(x), i.e., the strength of edge sharpening.
For solving the later cited problem, and preserving the same context of using a sigmoidal function, we intend to modify the diffusion function to reach the joint goal namely good gray level and good sharp edge of the fault. Then a new anisotropic diffusion model based on a new stopping edge function is proposed.
Figure 7Diffusion results of the radiographic images:(a1, a2)defective radiographic images;(b1, b2)respective diffusion results using the P-M model;(d1, d2)respective diffusion results using the Shin-Du model;(f1, f2)respective diffusion results using the proposed model;(c1, c2), (e1, e2), (g1, g2)thresholding results using Otsu method.
(a1) (a2)
(b1) (b2)
(c1) (c2)
(d1) (d2)
(e1) (e2)
(f1) (f2)
(g1) (g2)
In these new models two main modifications on the Shin’s one are proposed.
- First, a filtering procedure is applied to the image gradient as follows:
∇∗Iitx,y= MEDIAN∇Iitx,y (21)
- Second, a sharpening function is added to the edge stopping rule. Then the new proposed formula is given by Equation (22)
g(∇∗Ii t) =
⎡
⎣ 1
1 +∇∗Ii t
K2·
− 1
1 + exp−a∗(∇∗Ii t
K)
⎤
⎦ (22)
Figures 9 and 10 represent the diffusion coefficient functiong(∇I)-v(∇I) and the flux function(∇I) = [g(∇I
)-v(∇I)]·∇Ifor the proposed diffusion model, respectively.
For givena,K, anda, it can be seen that the diffusion coefficient function increases to a maximum and then decreases dramatically and crosses zero to achieve a minimum (when the gradient magnitude |∇I| is bigger than 0).
Table 3 shows the different steps of the proposed model. Figures 6a1, a2 and 7a1, a2 represent four radio-graphic images of weld with internal undercut, external undercut, lack of fusion, and lack of penetration defects, respectively. Figures 6f1, f2 and 7f1, f2 show the restora-tion results of the diffusing process using the proposed model with a parameterK =3 anda= 0.5.
One can note from Figures 6f1, f2 and 7f1, f2 that defects become visible in the diffused image. This indi-cates that the proposed model can sufficiently enhance hardly visible anomalies by simply smoothing low-gradi-ent regions and preserving high-gradilow-gradi-ent edges.
To show furthermore the effectiveness of the proposed method, experiments have been carried on many radio-graphic images with defects. The algorithms are imple-mented on a personal computer. Images were 256 × 256 pixels wide with 8-bit grayscale. The values of para-meters a and K were set at fixed values of 0.5 and 3, respectively. The number of iterations is 20 for all test images. Figures 6a1, a2 and 7a1, a2 represent the origi-nal images of welded joints, Figures 6f1, f2 and 7f1, f2 represent the diffusion results and Figures 6g1, g2 and 7g1, g2 illustrate the simple thresholding [24] results of the filtered images.
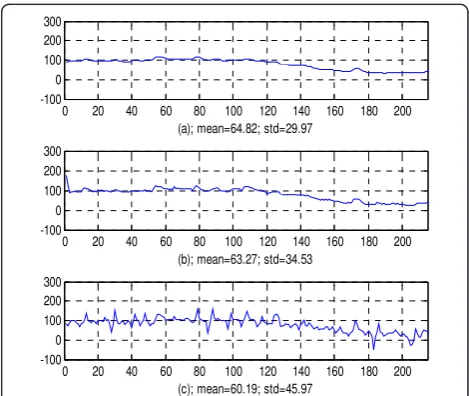
Figures 11, 12, 13, and 14 show different 2D intensity profiles taken from the regions where the possible defects are suspected. For each curve we give the mean and the standard deviation. From these plots and by inspecting the standard deviation values one can clearly see that the new method allows to enhance and to shar-pen different details of the weld defects without affect-ing the background or the neighboraffect-ing regions.
6. conclusion
In this article, the anisotropic diffusion scheme for defect detection in the TFT-LCD screens is extended to the defect detection in radiographic images. These later Table 2 Algorithm of the Shin-Du model
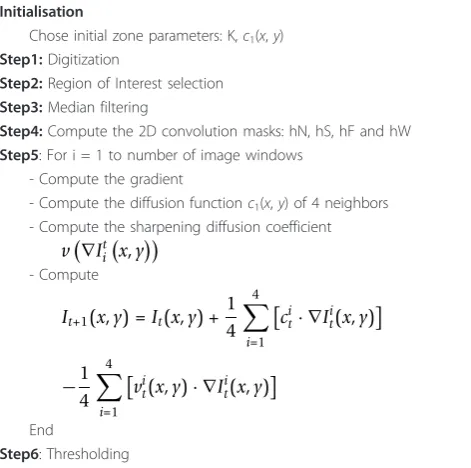
Initialisation
Chose initial zone parameters: K,c1(x,y)
Step1:Digitization
Step2:Region of Interest selection
Step3:Median filtering
Step4:Compute the 2D convolution masks: hN, hS, hF and hW
Step5: For i = 1 to number of image windows - Compute the gradient
- Compute the diffusion functionc1(x,y) of 4 neighbors - Compute the sharpening diffusion coefficient
v∇Iitx,y - Compute
It+1(x,y) =It(x,y) +
1 4
4
i=1
cit· ∇Iit(x,y)
−1
4
4
i=1
vit(x,y)· ∇Iit(x,y)
End
Step6: Thresholding
are used in the inspection of welds in the pipelines. Until now and in several industrial applications graphic film analysis are done exclusively by the radio-graph inspector who is required to visually inspect each film and detect the presence of possible defects. Conse-quently the automatization of such a procedure becomes necessary. The new proposed method allows to
automatically detect the possible defects through enhan-cing and sharpening the radiographic images. The multi-ple simulations carried out show good performance of the proposed detection scheme. Plots of multiple 2D intensity profiles taken from the areas containing the defects show that the new method highlights the defect details and allows efficient distinctions between the faultless background and the defect details.
Figure 9Graph of the proposed diffusion coefficient function g(∇I)-v(∇I): witha= 0.1.
Figure 10Graph of the flux function for the proposed model
(∇I) = [g(∇I)-v(∇I)] witha= 0.1.
Table 3 Algorithm of the proposed model
Initialisation
Chose initial zone parameters: K,c1(x,y)
Step1:Digitization
Step2:Region of Interest selection
Step3:Median filtering
Step4:Compute the 2D convolution masks: hN, hS, hF and hW
Step5: For i = 1 to number of image windows - Compute the gradient
- Compute the diffusion functionc1(x,y) of 4 neighbors - compute the
∇∗Ii t
x,y=median∇Itix,y - Compute the sharpening diffusion coefficient
v∇∗Iitx,y - Compute
It+1(x,y) =It(x,y) +
1 4
4
i=1
cit· ∇Iit(x,y)
−1
4
4
i=1
vit(x,y)· ∇Iit(x,y)
End
Step6: Thresholding
0 20 40 60 80 100 120 140 160 180 200
-100 0 100 200 300
(a); mean=113.48; std=20.46
0 20 40 60 80 100 120 140 160 180 200
-100 0 100 200 300
(b); mean=109.48; std=24.66
0 20 40 60 80 100 120 140 160 180 200
-100 0 100 200 300
(c); mean=79.46; std=68.97
Figure 112D intensity profiles of the line 6 in the ROI of the internal undercut defect.(a)PMAD model;(b)Shin-Du model;(c)
proposed model.
0 20 40 60 80 100 120 140 160 180 200
-100 0 100 200 300
(a); mean=64.82; std=29.97
0 20 40 60 80 100 120 140 160 180 200
-100 0 100 200 300
(b); mean=63.27; std=34.53
0 20 40 60 80 100 120 140 160 180 200
-100 0 100 200 300
(c); mean=60.19; std=45.97
Figure 122D intensity profiles of the line 7 in the ROI of the external undercut defect.(a)PMAD model;(b)Shin-Du model;(c)
Author details
1
Scientific Research Unit: University of Tunis, Signal, Image and Intelligent Control of Industrial Systems: SICISI, Ecole Supérieure des Sciences et Techniques de Tunis (ESSTT), 5 Av. Taha Hussein, 1008, Tunis, Tunisia2LTI équipe EESA 7 rue du Moulin Neuf, 80000 Amiens, France
Authors’contributions
IM conceived of the new defect detection algorithm, and the test on real radiographic images. Wrote the first version of the paper. SA framed the entire of the work, approved the new proposed algorithm, participated in design of the study, the sequence alignment and the manuscript reduction. FF approved the new idea for defect detection, participated in the design of
the paper, and its sequence alignment. All authors read and approved the final version of the manuscript.
Competing interests
The authors declare that they have no competing interests.
Received: 10 April 2011 Accepted: 27 February 2012 Published: 27 February 2012
References
1. N Nacereddine, M Zelmat, SS Belaifa, M Tridi, Weld defect detection in industrial radiography based digital image processing, inProceeding of World Academy of Science, Engineering and Technology.2(2005). ISSN 1307-6884
2. M Sofia, D Redouane, Shapes recognition system applied to the non-destructive testing, inProceeding of the 8th European Conference on Non-Destructive Testing (ECNDT 2002), Barcelona(2002)
3. TW Liao, Classification of welding flaw types with fuzzy expert systems. Expert Syst Appl.25(1), 101–111 (2003). doi:10.1016/S0957-4174(03)00010-1 4. D Mery, MA Berti, Automatic flaw detection in aluminum castings based on
the tracking of potential defects in a radioscopic image sequence. IEEE Trans Robot Autom.18(6), 890–901 (2002). doi:10.1109/TRA.2002.805646 5. G Wang, W Liao, Automatic identification of different types of welding
defects in radiographic images. NDT&E Int.35, 519–528 (2002). doi:10.1016/ S0963-8695(02)00025-7
6. RR Silva, MHS Siqueira, LP Caloba, IC Dasilva, AA Decarvalho, JMA Rebello, Contribution to the development of radiographic inspection automated system, inProceeding of the 8th European Conference on Non-Destructive Testing (ECNDT 2002), Barcelona(2002)
7. TW Liao, YM Li, An automated radiographic NDT system for weld inspection. Part I Weld extraction NDT& E Int.29(3), 157–162 (1996) 8. P Perona, J Malik, Scale-space and edge detection using anisotropic diffusion. IEEE Trans Pattern Anal Mach Intell.12, 629–639 (1990). doi:10.1109/34.56205
9. L Alvarez, PL Lions, JM Morel, Image selective smoothing and edge detection by nonlinear diffusion (II). SIAM J Numer Anal.29, 845–866 (1992). doi:10.1137/0729052
10. G Sapiro, DL Ringach, Anisotropic diffusion of multivalued images with applications to color filtering. IEEE Trans Image Process.5, 1582–1586 (1996). doi:10.1109/83.541429
11. F Torkamani-Azar, KE Tait, Image recovery using the anisotropic diffusion equation. IEEE Trans Image Process.5, 1573–1578 (1996). doi:10.1109/ 83.541427
12. WJ Niessen, KL Vincken, JA Weickert, MA Viergever, Nonlinear multiscale representations for image segmentation. Comput Vis Image Understand.66, 233–245 (1997). doi:10.1006/cviu.1997.0614
13. H Deng, J Liu, Unsupervised segmentation of textured images using anisotropic diffusion with annealing function, inInternational Symposium on Multimedia Information Processing, pp. 62–67 (2000)
14. SM Chao, DM Tsai, An anisotropic diffusion-based defect detection for low-contrast glass substrates. Image Vis Comput.26, 187–200 (2008). doi:10.1016/j.imavis.2007.03.003
15. RA Quinn, CC Sigl, Radiography in Modern Industry. Eastman Kodak Company, 4 (1980)
16. PCA Watanabe, JPM Issa, LC Pardini, SAC Monteiro, ABCEB Catirse, A singular method to compare dental radiographic films used to study maxillofacial structures. Int J Morphol.25(3), 573–578 (2007)
17. S Gonzalez, RE Woods, Digital Image Processing, (Addison-Wesley, 2007) 18. GA Baxes, Digital Image Processing, (Principles & Applications Wiley & Sons,
1994)
19. RM Haralick, LG Shapiro, Computer and Robot Vision, (Addison-Wesley, 1992)1
20. L Yin, R Yang, M Gabbouj, Y Neuvo, Weighted median filters: a tutorial. IEEE Trans Circ Syst.43(3), 157–192
21. TW Liao, YM Li, An automated radiographic NDT system for weld inspection. Part II. Flaw detection NDT&E Int.31(3), 183–192 (1998) 22. N Otsu, A threshold selection method for gray level histograms. IEEE Trans
Syst Man Cybern.9(1), 62–66 (1979)
23. K Jensen, D Anastassiou, Subpixel edge localization and the interpolation of still images. IEEE Trans Image Process.4(3), 285–295 (1995). doi:10.1109/ 83.366477
0 50 100 150 200
-100 0 100 200 300
(a); mean=71.46; std=15.35
0 50 100 150 200
-100 0 100 200 300
(b); mean=62.41; std=10.51
0 50 100 150 200
-100 0 100 200 300
(c); mean=51.85; std=33.30
Figure 132D intensity profiles of the line 3 in the ROI of the lack of fusion defect.(a)PMAD model;(b)Shin-Du model;(c)
proposed model.
0 20 40 60 80 100 120 140 160 180 200
-100 0 100 200 300
(a); mean=115.48; std=50.38
0 20 40 60 80 100 120 140 160 180 200
-100 0 100 200 300
(b); mean=111.07; std=62.26
0 20 40 60 80 100 120 140 160 180 200
-100 0 100 200 300
(c); mean=80.20; std=97.33
Figure 142D intensity profiles of the line 9 in the ROI of the lack of penetration defect.(a)PMAD model;(b)Shin-Du model;
24. M Sezgin, B Sankur, Comparison of thresholding methods for non-destructive testing applications, inIEEE Conference on Image Processing, Grèce(2001)
doi:10.1186/1687-6180-2012-46
Cite this article as:Ben Mhamedet al.:Weld defect detection using a modified anisotropic diffusion model.EURASIP Journal on Advances in Signal Processing20122012:46.
Submit your manuscript to a
journal and benefi t from:
7Convenient online submission 7Rigorous peer review
7Immediate publication on acceptance 7Open access: articles freely available online 7High visibility within the fi eld
7Retaining the copyright to your article