A Data-Driven Multidimensional Indexing Method
for Data Mining in Astrophysical Databases
Marco Frailis
Dipartimento di Fisica, Universit`a degli Studi di Udine, Via delle Scienze 208, 33100 Udine, Italy Email:[email protected]
Alessandro De Angelis
INFN, Sezione di Trieste, Gruppo Collegato di Udine, Via delle Scienze 208, 33100 Udine, Italy Email:de [email protected]
Vito Roberto
Dipartimento di Matematica e Informatica, Universit`a degli Studi di Udine, Via delle Scienze 208, 33100 Udine, Italy Email:[email protected]
Received 1 June 2004; Revised 2 March 2005
Large archives and digital sky surveys with dimensions of 1012bytes currently exist, while in the near future they will reach sizes
of the order of 1015. Numerical simulations are also producing comparable volumes of information. Data mining tools are needed
for information extraction from such large datasets. In this work, we propose a multidimensional indexing method, based on a static R-tree data structure, to efficiently query and mine large astrophysical datasets. We follow a top-down construction method, called VAMSplit, which recursively splits the dataset on a near median element along the dimension with maximum variance. The obtained index partitions the dataset into nonoverlapping bounding boxes, with volumes proportional to the local data density. Finally, we show an application of this method for the detection of point sources from a gamma-ray photon list.
Keywords and phrases:multidimensional indexing, VAMSplit R-tree, nearest-neighbor query, one-class SVM, point sources.
1. INTRODUCTION
At present, several projects for the multiwavelength obser-vation of the universe are underway, for example, SDSS, GALEX, POSS2, DENIS, and so forth [1]. In the next years, new spatial missions will be launched (e.g., GLAST, Swift [2,
3]), surveying the wall sky at different wavelengths (gamma-ray, X-(gamma-ray, optical).
In the astroparticle and astrophysical fields, data are mostly characterized by multidimensional arrays. For in-stance, in X-ray and gamma-ray astronomy, the data gath-ered by detectors are lists of detected photons whose prop-erties include position (RA, DEC), arrival time, energy, error measures both for the position and the energy estimates (de-pendent on the instrument response), and quality measures of the events. Source catalogs, produced by the analysis of the raw data, are lists of point and extended sources charac-terized by coordinates, magnitude, spectral indexes, flux, and so forth.
Data miningapplied to multidimensional data analyzes the relationships between the attributes of a multidimen-sional object stored into the database and the attributes of
the neighboring ones. Typical queries required by this kind of analysis are the following: (i)point queries, to find all ob-jects overlapping the query point; (ii)range queries, to find all objects having at least one common point with a query window; and (iii) nearest-neighbor queries, to find all ob-jects that have a minimum distance from the query object. Another important operation is the spatial join, which in the astrophysical field is needed to search multiple source catalogs and cross-identify sources from different wave-bands.
These multidimensional (spatial) data tend to be large (sky maps can reach sizes of terabytes) requiring the integra-tion of the secondary storage, and there is no total ordering on spatial objects preserving spatial proximity [4]. This char-acteristic makes it difficult to use traditional indexing meth-ods, like B+-trees or linear hashing.
2. AN OPTIMIZED R-TREE
The structure of an R-tree is the following:
(i) aninternal nodeof the R-tree has a number of entries of the form (cp, MBB), where cp is the address of a child node and MBB is then-dimensionalminimum bounding boxof all entries in that child node;
(ii) aleaf nodehas a number of entries of the form (Oid, MBB), whereOidrefers to a record in the database de-scribing a particular object and MBB is the minimum bounding box of that object. For point data, the leaf entries can also have the form (point, attributes), where
point is a coordinate in then-dimensional space and
attributesare data associated to that point.
A bounding boxRis defined by the two endpointsSand
Tof its major diagonal in then-dimensional data space:
R=(S,T), (1)
where
S=s1,s2,. . .,sn, T=t1,t2,. . .,tn, si≤ti∀1≤i≤n. (2) Thelevel(ordepth) of a nodexof the tree is the length (the number of nodes) of the path from the rootrto the node
x. Thefanoutof a nodexis the maximum number of entries a node can have. The internal fanout is the fanout of nonleaf nodes (to be distinguished from the leaf fanout or capacity). Analogous to the B+-tree, the R-tree is a balanced tree and each node has a fanout dependent on the disk page size.
The dynamic R-tree (and its variant, the R*-tree [6]) de-fines particular insertion, deletion, and update operations to reduce the overlapping between sibling nodes and guarantee a minimum filling rate.
Usually, the analysis of astrophysical data is performed on a static dataset. In this case, using multiple insertions to build the index on the entire dataset is very slow: the cost is
O(NlogBN) I/O operations, whereNis the number of input MBBs andBis the number of MBBs fitting into a disk block. An optimized index, in terms of construction time, mem-ory occupied, and query performances, can be built usinga prioriinformation on the dataset by means of bulk loading algorithms. Several bulk loading techniques have been pro-posed in the literature [7]. With these algorithms, the index can be built with O((N/B) log(M/B)(N/B)) number of I/Os, whereMis the number of MBBs fitting into main memory. The result is a near complete and balanced R-tree. The basic idea used in these algorithms is the following: input MBBs or point data are sorted or partially sorted according to a cri-terion that preserves spatial proximity between adjacent ele-ments in the ordering, then they are placed in the leaves in that order. The rest of the tree is then built recursively in a bottom-up manner.
We have followed a top-down construction method called VAMSplit algorithm, described in [8], to build and op-timized R-tree. This method preserves the spatial proximity between sibling nodes, resulting in a partition of the dataset
with no overlapping between MBBs. Moreover, the volume of the data space covered by each node (at a particular level) is variable and dependent on data density. The main idea of this method is to recursively split the dataset on anear me-dianelement along the dimension withmaximum variance. In particular, following the formalism given in [9], the index construction algorithm comprises the following subtasks:
(i) determine the tree topology: height and fanout of the internal nodes, and so forth;
(ii) compute the split strategy based on the tree topology; (iii) use an external selection algorithm to bisect the data
on secondary storage; (iv) construct the index directory.
2.1. Determination of the tree topology
The topology of a tree includes the height of the tree, the fanout of the internal nodes in each tree level, the capacity of the leaf nodes, and the number of the data objects (i.e., records) stored in each subtree. The topology of the tree only depends on static information which is invariant during the construction such as the number of objects, the number of dimensions indexed, and the page capacity.
LetBbe the maximum number of data objects in a data page (i.e., a page storing a leaf node) and F the fanout of a directory page (i.e., a page storing a nonleaf node). Then, using the floor and ceiling operations, respectively, indicated by·and·, we have that
B=
page size size of (data object)
,
F=
page size size of (node entry)
.
(3)
The maximum number of data objects in a tree with height
his
Cmax(h)=B·Fh. (4)
Therefore, knowing the numberNof data objects to be in-dexed, the height of the tree must be determined such that
Cmaxis greater thanN. More formally,
h=
logF
N B
=
logFN
B
. (5)
This corresponds to the height of the root node. The fanout of the root node is evaluated considering its subtrees as com-plete trees with heighth−1 (the target index is a balanced tree). Hence,
fanout (h,N)=
N Cmax(h−1)
2.2. The split strategy
Given the topology of the target disk-based index tree, the split strategy is represented by a linear-space tree. For the VAMSplit algorithm, the split strategy is implicitly repre-sented by a binary tree, where, at each level, the dimension with maximum variance is chosen as the split dimension.
Then, anear medianelement is selected as the split value and computed by
med=
gscap·
1 2·
N
gscap
ifN≤2·cscap, gscap>0, cscap·
1 2·
N
cscap
otherwise,
(7)
where cscap stays for child subtree capacity and gscap stays for grandchild subtree capacity and
cscap=Cmax(h−1),
gscap=Cmax(h−2)= cscapF . (8)
Hence, whenN >2·cscap, the split value is selected so that theleft subtreesof the target index are fully utilized. When
N <2·cscap, the split based on the cscap value would gen-erate a strongly biased split; thus in this case the near median element is evaluated by means of the granchild subtree ca-pacity, but without introducing any extra page in the target index.
For large datasets, not fitting into main memory, an ex-ternal selection algorithm using the secondary storage for partitioning the data around the median element is neces-sary. Our implementation uses a sampling strategy given by [10] to find a good pivot value and reduce the number of I/O operations; a caching strategy explained in [9] has been adopted to partition the data into the secondary storage. When the number of records covered by a subtree fits into main memory, its construction is continued in main mem-ory, reducing further the number of I/O operations.
3. TESTS ON A PHOTON DATASET
To test the behavior of this method, we built the index on a list of gamma-rays simulated for the GLAST project. In par-ticular, the optimized R-tree was built on the RA and DEC values while the other columns of each photon were consid-ered as attribute data.
Figure 1represents the structure of the R-tree built on the first two days of simulated photons (for a total of 1 847 588 photons). The background image represents the projection on the RA-DEC plane of the photon counts. The root node contains only two rectangles (child nodes) splitting the dataset on the RA value of the median element. For the rect-angle on the right, the image shows the partition generated by the second level of the tree instead for the left rectangle the partition at the third level is shown. As one can notice, in regions where the flux is higher, the decomposition is finer.
Figure1: Minimum bounding boxes at different levels of the R-tree.
Then, to test query performances, we built an optimized R-tree on the photons generated by a fast simulation of an entire year of observation for a total of 40.1 millions photons. The size of each photon is of 165 bytes. Indexed attributes are again RA and DEC.
The system in which we run the tests is a Pentium IV 2400 MHz with 512 MB (DDR 266 Mhz), an 80 GB 7200 rpm Ultra ATA/100 hard disk. The operating system is a standard Red Hat 9.0 and the page size is 4096 bytes.
The building of the R-tree index on the entire dataset re-quired 4 hours and 35 minutes. The result of the construction is a single index file with a size of 6.7 GB (it contains both the directory nodes and the data itself).
We performed 25 circular queries on the optimized R-tree, each one repeated 4 times. Each query is defined by a coordinate in RA and DEC together with a radius (of 15 degrees). Circular queries, on the R-tree, require a particu-lar handling. We performed two types of queries. In the first type, the program converts a circular query into a rectangu-lar query:
(RA, DEC, radius)−→(min RA, min DEC),
(max RA, max DEC), (9) where the rectangle sides are tangent to the circular region. This way, the photons obtained by the rectangular query are a superset of the one obtained by the circular query.
The second type of query adds a filtering step to the first one, in which only photons inside the circular region are ac-cepted. A Particular handling is required for circular queries intersecting the poles, but none of the 25 queries required it. The performances obtained are
(i) rectangular query average time: 10.06 seconds, (ii) circular query average time: 10.47 seconds,
(iii) average number of elements retrieved by a rectangular query: 1.210.800,
(iv) average number of elements retrieved by a circular query: 973.239.
Figure2: Adjacency between bounding boxes in the count map example.
in the SDSS project) to partition the photon dataset. A level-5 HTM decomposes the sky into 8 192 spherical triangles, each one associated to a different file on disk. The building of the HTM index required 1 hour and 27 minutes. Then we per-formed the same 25 circular queries used to test our R-tree index. Given a circular query, the HTM library returns a list of HTM IDs, each one identifying a spherical triangle inter-secting the query region. The performances obtained are
(i) circular query average time: 140.72 seconds,
(ii) average number of level-5 triangles intersecting the query: 104.
4. NEIGHBORHOOD AND “WEAK” ADJACENCY
The structure of the optimized R-tree can help exploring the data and finding regions of interest. For this purpose, other information can be added to each node: the total number of data points covered by the node, their mean and variance, and other statistical moments.
Data mining techniques include clustering, classification, and density estimation tasks. The application of these tech-niques to large datasets involves the execution of multiple queries. Typical queries used for this tasks are nearest neigh-bor or similarity queries and adjacency queries. In particu-lar, for cluster analysis or density estimation, it can be useful to define neighborhood or adjacency relations not only be-tween data objects but also bebe-tween the internal nodes of the optimized R-tree storing sufficient statistics. We use the defi-nition of minimum distance between a pointPand a bound-ing boxRgiven by Roussopoulos et al. in [13]:
MINDIST(P,R)=n i=1
pi−ri2
, (10)
where
ri=
si ifpi< si,
ti ifpi> ti,
pi otherwise,
(11)
which corresponds to the distance from the point to the near-est edge of the bounding box. Given a bounding box, its nearest neighbors are found by means of the mindist from its barycenter. An optimal algorithm, visiting only the nodes necessary for obtaining the nearest neighbors, is designed in
Figure3: Local maxima obtained by bounding box sorting in the
galactic anticenter.
[14]. This algorithm is alsoincremental, that is, the number of nearest neighbors to be retrieved is not known in advance. Differently from space-partitioning data structures (like the kd-tree or the HTM) the R-tree has no adjacency relation between its nodes (i.e., usually edges are not shared between their bounding boxes). The adjacency relation is generally used in cluster analysis to find connected components. For point data characterized by an isotropic noise or background distribution, we define aweak adjacencybetween the R-tree bounding boxes as follows.
Definition 1 (weak adjacency). Two bounding boxes U =
(S,T) andV = (S,T) are weakly adjacent if there exists
k∈ {1,. . .,n}such that
(i) ¬(si≥ti∨ti≤si) for all 1≤i≤n,i=k;
(ii) there does not existZ =(S,T) such that Z and U satisfy (i) and Z and V satisfy (i) and (tk ≤sk ≤sk∨
t
k≤sk ≤sk).
In case of a regular grid in two dimensions, the above definition is equivalent to the 4-connectivity. Given an R-tree bounding box, the algorithm to find all its weakly ad-jacent bounding boxes is based on the incremental nearest-neighbor algorithm.Figure 2shows an example of weakly ad-jacent bounding boxes found with this method.
90 bounding boxes in the ordering are filled, highlighting 4 densest areas which correspond to point sources in that re-gion.
5. A STRATEGY FOR THE DETECTION OF POINT SOURCES
One of the major tasks, in the analysis of the data gathered by X-ray or gamma-ray detectors working in survey mode, is to distinguish point sources from diffuse background or extended sources. Point sources are mostly characterized by a stronger flux, with respect to the surrounding, focused on a small angular region. The area covered by a point source depends also on the instrument point spread function.
An optimized R-tree index can be built on a dataset in-cluding photons gathered in a certain range of time (we are using, for the analysis, a minimum interval of 6 days). To find static or strong variable sources (e.g., gamma-ray bursts), only a bidimensional indexing on the RA and DEC values is needed.
In the following, we propose a point source detection algorithm based on kernel methods [15], and in particular on the one-class SVM [16]. Standard kernel methods have memory and computational requirements that make them impractical for large datasets. In this work we show how to speed-up the training process by reducing the number of training data with the partitioning generated by our opti-mized R-tree.
5.1. One-class SVM
The one-class SVM algorithm estimates the support of a multidimensional distribution, that is, a binary function such that most of the data will live in the region where the function is nonzero. Given a dataset X = {x1,. . .,x}, its
strategy is to implicitly map the data into a high-dimensional feature spaceFusing a kernel function, that is, a functionk such that
kxi,xj=φxi,φxj, (12)
whereφis the mapping fromXto the (inner product) feature spaceF. Then, inF, it separates the data from the origin with maximum margin solving the following problem:
min
w,ρ,ξ
1 2w
2−ρ+ 1 ν
i
ξi s.t.w·φxi≥ρ−ξi,
ξi≥0, i=1,. . .,,
(13)
whereν∈(0, 1] is a parameter of the problem. Constructing the Lagrangian and setting the derivatives to zero, we obtain the dual problem
min
α
1 2
i
j
αiαjkxi,xj s.t.
i
αi=1,
0≤αi≤ν1, i=1,. . .,,
(14)
where theαiare the Lagrange multipliers. This is a quadratic programming problem, solved by standard optimization techniques. After solving the dual problem, the support of the distribution is given by
f(x)=sgn
i
αikxi,x−ρ
. (15)
5.2. Scaling one-class method with the optimized R-tree
To scale the one-class method to a large dataset, the idea is to partition the data into pairwise disjoint convex subsets and use, in the one-class training, only one representative for each subset. An analogous method has been applied for classification tasks with the support vector machines (SVMs) [17]. Substituting the data in a subsetX0with a representa-tive is equivalent to adding the following constraint to the dual problem:
α0,i=α00, ∀i=1,. . .,0, (16)
where0= |X0|. Using the Gaussian kernelk=exp(−λx−
z2), it can be shown that the best representative we can
choose is the value, in the input space, satisfying
min
x
φ(x)−01 0
i=1
φx0,i
2
=min
x 2−
2
0
0
i=1
exp−λx−x0,i2,
(17)
that is,x=(1/0)0
i=1x0,i. The partitioning we adopt is the
one generated by one level of the optimized R-tree. We re-duce the elements covered by a node of the partition to their mean value and train the one-class algorithm on such repre-sentatives. With respect to the standard one-class method, an approximate solution is found with a speedup that can be of two orders of magnitudes (depending on the level of detail in the partitioning).
5.3. Tests on the anticenter region
Instead of trying to detect directly the point sources, we use the accelerated one-class method to estimate the support of the background and the diffuse emission distribution. Being able to estimate such distribution, point sources are detected as outliers of the support found.
(a) (b)
Outliers 0
20 40 60 80 100 120 140 160 180 200
Densit
y
(c)
(d)
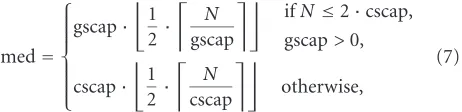
Figure4: Point sources detection applying one-class SVM to the partition generated by the optimized R-tree. (a) A counts map of the
anticenter region. (b) Outliers with respect to the diffuse emission. (c) Densities of the outliers in increasing order. (d) Result after filtering out the outliers with low density.
Putting together position and local density information generates some redundancy. In fact, in areas where the den-sity is higher the mean distance between the photons is smaller. A solution for removing redundancy in a dataset is to perform the principal component analysis (PCA) [18], which gives, in a dataset, the directions of maximum variance. Gen-erally, only a subset of the eigenvectors are kept, that is, the ones corresponding to the directions capturing most of the variance. Hence, the data are first projected into the subspace found:
˜
xi=UTkxi, i=1,. . .,, (18)
wherekis the number of eigenvectors used.
To test this method we have applied it again to the GLAST photon dataset and in particular to the anticenter region (in-cluding 25 890 photons). We have used the partition gener-ated with the last level of the R-tree. The parameter values adopted areν=0.14 andλ=0.0003 (the width of the Gaus-sian kernel). The training has required 0.44 second.
The outliers detected are shown onFigure 4b. Apart from the four stronger sources, also areas with low density are highlighted as outliers. This is due to the one-class method itself: it finds the most dissimilar objects on the boundary of the decision function. In this particular task, the most dis-similar elements are the areas with a very high density with respect to the surrounding and the areas with very low den-sity. This can be seen also by plotting the histogram of the density values (Figure 5.2) for the outliers. Hence, a sim-pler task remains to filter out the areas with low density (see
Figure 5.2).
6. CONCLUSIONS
In this work, we have realized a multidimensional indexing method to efficiently access and mine large multidimensional astrophysical data. The index is based on a static version of the R-tree data structure, the VAMSRtree. We have fixed the original algorithm and adapted it to very large dataset, for which the partial sort cannot be performed in main memory. We have adopted an efficient incremental nearest-neighbor algorithm and defined a weak adjacency relation between the R-tree nodes. These algorithms, together with the op-timized R-tree structure, allow to efficiently query the data (with point andn-dimensional range queries) and perform data mining tasks like clustering and density estimation. A fast novelty detection algorithm, based on the one-class SVM method, has been shown. We have used, as a running exam-ple, photon data gathered from a simulation for the Gamma-ray Large Area Space Telescope (GLAST).
REFERENCES
[1] R. J. Brunner, S. G. Djorgovski, T. A. Prince, and A. S. Sza-lay, “Massive datasets in astronomy,” inInvited Review for the Handbook of Massive Datasets, J. Abello, P. Pardalos, and M. Resende, Eds., pp. 931–979, Kluwer Academic, Norwell, Mass, USA, 2002.
[2] GLAST—Gamma-ray Large Area Space Telescope, http:// glast.gsfc.nasa.gov/.
[3] Swift mission, http://www.nasa.gov/mission pages/swift/ main/index.html.
[5] A. Guttman, “R-trees: a dynamic index structure for spatial searching,” inProc. ACM SIGMOD International Conference on Management of Data, pp. 47–57, Boston, Mass, USA, June 1984.
[6] N. Beckmann, H.-P. Kriegel, R. Schneider, and B. Seeger, “The
R∗-tree: an efficient and robust access method for points and
rectangles,” inProc. ACM SIGMOD International Conference on Management of Data, pp. 322–331, Atlantic City, NJ, USA, May 1990.
[7] L. Arge, K. Hinrichs, J. Vahrenhold, and J. S. Vitter, “Effi -cient bulk operations on dynamicR-trees,” inProc. 1st Inter-national Workshop on Algorithm Engineering and Experimen-tation (ALENEX ’99), vol. 1619 ofLecture Notes In Computer Science, pp. 328–348, Springer, Baltimore, Md, USA, January 1999.
[8] D. A. White and R. Jain, “Similarity indexing: algorithms and performance,” in Storage and Retrieval for Still Image and Video Databases IV, vol. 2670 of Proceedings of SPIE, San Diego, Calif, USA, pp. 62–73, 1996.
[9] C. B¨ohm and H.-P. Kriegel, “Efficient bulk loading of large high-dimensional indexes,” inProc. 1st International Confer-ence on Data Warehousing and Knowledge Discovery (DaWaK ’99), vol. 31, pp. 251–260, Florence, Italy, August–September 1999.
[10] C. Mart´ınez and S. Roura, “Optimal sampling strategies in quicksort and quickselect,”SIAM Journal on Computing, vol. 31, no. 3, pp. 683–705, 2001.
[11] P. Z. Kunszt, A. S. Szalay, and A. R. Thakar, “The hierarchical triangular mesh,” inProc. of the MPA/ESO/MPE Workshop in Mining the Sky, A. J. Bandy, S. Zaroubi, and M. Bartelmann, Eds., pp. 631–637, Garching, Germany, 2001.
[12] Sloan Digital Sky Survey,http://www.sdss.org/.
[13] N. Roussopoulos, S. Kelly, and F. Vincent, “Nearest neighbor queries,” inProc. ACM-SIGMOD International Conference on Management of Data, pp. 71–79, San Jose, Calif, USA, May 1995.
[14] G. R. Hjaltason and H. Samet, “Distance browsing in spatial databases,”ACM Transactions on Database Systems, vol. 24, no. 2, pp. 265–318, 1999.
[15] J. Shawe-Taylor and N. Cristianini,Kernel Methods for Pattern Analysis, Cambridge University Press, Cambridge, UK, 2004. [16] B. Sch¨olkopf, J. C. Platt, J. Shawe-Taylor, and A. J. Smola,
“Estimating the support of a high-dimensional distribution,” Neural Computation, vol. 13, no. 7, pp. 1443–1471, 2001. [17] D. Boley and D. Cao, “Training support vector machine using
adaptive clustering,” inProc. 4th SIAM International Confer-ence on Data Mining (SIAM DM ’04), Lake Buena Vista, Fla, USA, April 2004.
[18] T. Hastie, R. Tibshirani, and J. H. Friedman,The Elements of Statistical Learning, Springer, New York, NY, USA, 2001.
Marco Frailisgraduated in computer science in Udine in 2001. In November 2001, he started his Ph.D. degree at the Depart-ment of Mathematics and Computer Science, the University of Udine. His research work was carried out in collaboration with the Department of Physics and within the GLAST project (NASA). He received his Ph.D. degree in computer science in 2005 with a thesis entitled “Data Management and Mining in Astrophysical Databases” and he has a Postdoc position at the Department of Physics. His main research interests are pattern recognition and data mining techniques.
Alessandro De Angelis, a Professor of experimental physics at the University of Udine and at the IST of Lisboa, chairs the M.S. pro-gram in computational physics in Udine, and is a Member of INFN, CIFS, SIF. After classical high school, he graduated (cum laude) in physics in Padova in 1983, worked in the Group of Marcello Cresti, and was a Technical Officer at the Terrestrial Weapons headquar-ters, Rome, in 1983/1984. From 1984 to 1992, he studied properties of charmed particles with bubble-chamber detectors and worked in Padova and Udine on the preparation of the DELPHI experiment at the CERN LEP electron-positron collider. From 1993 to 1999 at CERN, Geneva, he worked in the Group of Ugo Amaldi, as a Re-search Associate and StaffMember, coordinating the data analysis software of DELPHI and the QCD Group, and was responsible for the software for the INFN project on artificial NN. Back to Italy in 1999, he founded in Udine a group on astroparticle physics, work-ing on GLAST and MAGIC (detection of high-energy gamma rays with satellite and ground based, respectively), and giving a primary contribution to simulation, event display, and data acquisition. He is the author of more than 400 publications, referee for leading sci-entific journals, and organizer of several conferences in the field of astroparticle physics.